Overcoming the Signal Challenge: A Comprehensive Guide to Immunostaining Low Abundance Protein Targets
Detecting low abundance proteins via immunostaining presents significant challenges in protein localization and biomarker research, often hindered by high background noise and weak specific signals.
Overcoming the Signal Challenge: A Comprehensive Guide to Immunostaining Low Abundance Protein Targets
Abstract
Detecting low abundance proteins via immunostaining presents significant challenges in protein localization and biomarker research, often hindered by high background noise and weak specific signals. This article provides a systematic guide for researchers and drug development professionals, covering the foundational principles of immunostaining and the unique obstacles posed by low abundance targets. It details advanced methodological strategies for sample preparation, signal amplification, and enrichment techniques. A dedicated troubleshooting section addresses common pitfalls like high background and autofluorescence, while the final segment focuses on rigorous experimental validation and comparative analysis of detection platforms to ensure reliable and reproducible results.
The Low Abundance Challenge: Understanding the Fundamentals of Immunostaining and Signal-to-Noise Dynamics
Immunostaining is a foundational technique in biological research and clinical diagnostics that utilizes the specific binding of antibodies to target antigens within cells and tissues, allowing for the visualization of their presence, localization, and abundance [1]. For researchers focusing on low-abundance protein targets—such as certain cytokine receptors, signaling molecules, or proteins in limited sample volumes—the choice of immunostaining method is critical [2]. The core decision often centers on whether to use a direct or indirect detection method, as this choice fundamentally impacts the sensitivity, specificity, and overall success of the experiment [1] [3]. This application note details the principles of these methods, provides structured comparisons and optimized protocols for detecting low-abundance targets, and outlines advanced signal amplification strategies essential for reliable results in drug development and basic research.
Core Principles and Methodological Comparison
The principle of immunostaining is based on the specific interaction between an antibody and its target antigen. To visualize this interaction, the antibody is conjugated to a detectable marker, such as a fluorescent dye or an enzyme [1].
Direct Immunostaining
The direct method uses a single primary antibody that is directly conjugated to a detectable marker (e.g., a fluorophore or enzyme). This antibody binds specifically to the target antigen in a one-step incubation process [1] [3].
Advantages:
- Speed: The protocol is faster due to fewer incubation and washing steps [1].
- Simplicity: Reduced complexity minimizes potential sources of error [4].
- Multiplexing: Allows for easier simultaneous detection of multiple targets from different species without cross-reactivity [3].
- Background: Lower potential for background signal from secondary antibody cross-reactivity [3] [4].
Disadvantages:
- Sensitivity: Lower sensitivity because signal amplification is absent [1] [4].
- Flexibility: Limited availability of commercially available conjugated primary antibodies, and each must be purchased pre-conjugated [1] [4].
- Signal: The signal may be weak for low-abundance targets [5].
Indirect Immunostaining
The indirect method uses an unlabeled primary antibody that binds to the antigen. Then, a labeled secondary antibody, which recognizes and binds to the primary antibody, is applied. Multiple secondary antibodies can bind to a single primary antibody, amplifying the signal [1] [3].
Advantages:
- Sensitivity: Significantly higher sensitivity due to signal amplification [1] [4]. This makes it the preferred choice for low-abundance targets [5].
- Flexibility: A wide range of labeled secondary antibodies are available, and the same secondary antibody can be used with different primary antibodies from the same host species [1].
- Cost-Effectiveness: Secondary antibodies are often less expensive than conjugating every primary antibody [3].
Disadvantages:
- Time: The protocol is longer due to the additional incubation and washing steps [1].
- Background: Higher potential for background signal due to non-specific binding of the secondary antibody [3] [4].
- Cross-Reactivity: Requires careful selection of primary and secondary antibodies from different species to avoid aberrant crosslinking [1] [3].
Quantitative Comparison of Direct vs. Indirect Methods
The table below summarizes the key differences between the two methods to aid in selection.
Table 1: Comprehensive Comparison of Direct and Indirect Immunostaining Methods
| Feature | Direct Method | Indirect Method |
|---|---|---|
| Primary Antibody | Conjugated with a detectable marker [1] | Unlabeled; specific to the target antigen [1] |
| Secondary Antibody | Not required [1] | Conjugated; binds to the primary antibody [1] |
| Processing Time | Fast (one-step incubation) [1] | Slow (two-step incubation) [1] |
| Sensitivity | Low [1] [4] | High (signal amplification) [1] [4] |
| Signal Amplification | No [1] | Yes [1] |
| Multiplexing Potential | Easier with antibodies from different hosts [3] | More complex, requires careful host species selection [3] |
| Commercial Availability | Limited conjugated primary antibodies [1] | Many secondary antibody options available [1] |
| Background Signal | Lower (fewer non-specific binding sites) [3] | Higher (potential for secondary cross-reactivity) [3] |
| Best Suited For | High-abundance targets [5] | Low- and medium-abundance targets [5] |
The following workflow diagram illustrates the core components and procedural differences between direct and indirect immunostaining.
Diagram 1: Immunostaining Method Workflow and Outcomes. This chart compares the steps and key characteristics of direct (green) and indirect (blue) immunostaining methods.
Advanced Strategies for Low-Abundance Targets
For low-abundance proteins, which can be present at fewer than 2000 molecules per cell [2], the standard indirect method may be insufficient. Further signal amplification is often required.
Signal Amplification Beyond the Secondary Antibody
Advanced techniques introduce additional layers to the staining protocol to dramatically increase the number of fluorophores deposited at the target site.
- Biotin-Streptavidin Amplification: This is a highly effective three-step method. After the primary antibody is applied, a biotinylated secondary antibody is used, followed by streptavidin conjugated to a bright fluorophore like phycoerythrin (PE) or Alexa Fluor dyes [2]. Streptavidin has a very high affinity for biotin, and multiple fluorophores can be conjugated to a single streptavidin molecule. Sensitivity can be pushed even further by adding a fourth layer (e.g., anti-PE antibody) and a fifth layer (PE-streptavidin) [2].
- Tyramide Signal Amplification (TSA): This is an enzyme-mediated method. An HRP-conjugated secondary antibody catalyzes the deposition of numerous labeled tyramide molecules at the antigen site. This technique provides exceptional sensitivity for detecting targets that are otherwise undetectable [5].
Reagent Selection for Varying Target Abundance
The table below outlines optimal reagent choices based on the abundance level of your target protein.
Table 2: Reagent Selection Guide for Target Abundance Levels
| Target Abundance | Primary Antibody | Secondary Detection | Advanced Amplification |
|---|---|---|---|
| High (e.g., Tubulin) | Conjugated primary [5] | Standard conjugated secondary [5] | Usually not required; may cause over-amplification [5] |
| Medium (e.g., Golgi proteins) | Unlabeled primary [5] | Standard conjugated secondary or streptavidin-biotin [5] | May be beneficial for quantification [5] |
| Low (e.g., Cytokine receptors) | Unlabeled primary [5] | High-sensitivity fluorophores (e.g., PE, Alexa Fluor dyes) [2] | Essential (e.g., multi-layer biotin-streptavidin or tyramide amplification) [2] [5] |
The following diagram visualizes the layered approach of a high-sensitivity amplification strategy.
Diagram 2: High-Sensitivity Detection with Biotin-Streptavidin Amplification. This multi-layer method significantly increases the signal for low-abundance targets.
Optimized Experimental Protocols
Protocol: Standard Indirect Immunofluorescence for Cultured Cells
This protocol is optimized for detecting medium-abundance targets and forms the base for further amplification [1] [5].
- Cell Seeding and Fixation: Seed cells on coverslips. At the desired confluence, fix cells with 4% paraformaldehyde for 15 minutes at room temperature.
- Permeabilization and Blocking: Permeabilize cells with 0.1% Triton X-100 for 10 minutes. Incubate with a blocking buffer (e.g., 5% normal serum from the secondary antibody host species or 1% BSA in PBS) for 1 hour to prevent non-specific binding [1] [6].
- Primary Antibody Incubation: Apply the optimized concentration of primary antibody diluted in blocking buffer. Incubate in a humidified chamber for 1 hour at room temperature or overnight at 4°C.
- Washing: Wash the coverslip 3 times for 5 minutes each with wash buffer (e.g., PBS with 0.05% Tween-20) to remove unbound antibody [1].
- Secondary Antibody Incubation: Apply the fluorophore-conjugated secondary antibody, specific to the host species of the primary antibody, diluted in blocking buffer. Incubate for 1 hour at room temperature in the dark.
- Washing and Mounting: Wash 3 times for 5 minutes in the dark. Counterstain nuclei with DAPI if desired. Mount coverslips using an antifade mounting medium (e.g., VECTASHIELD) to reduce photobleaching [1].
Protocol: Enhanced Detection for Low-Abundance Targets
This protocol modifies the standard indirect method by incorporating biotin-streptavidin amplification [2].
- Steps 1-4: Follow the standard protocol for fixation, blocking, primary antibody incubation, and washing.
- Biotinylated Secondary Antibody: Incubate with a biotinylated secondary antibody (e.g., biotinylated anti-rabbit IgG) diluted in blocking buffer for 1 hour at room temperature.
- Washing: Wash 3 times for 5 minutes.
- Fluorophore-Streptavidin Incubation: Incubate with a bright fluorophore-conjugated streptavidin (e.g., PE or Alexa Fluor 647) diluted in an appropriate buffer for 30 minutes at room temperature in the dark [2].
- Steps 6-7: Complete the protocol with final washes, counterstaining, and mounting as described in the standard protocol.
The Scientist's Toolkit: Essential Reagents and Solutions
Table 3: Key Research Reagent Solutions for Immunostaining
| Item | Function | Key Considerations for Low-Abundance Targets |
|---|---|---|
| High-Specificity Primary Antibodies | Binds specifically to the target protein. | Use monoclonal or recombinant antibodies for consistency. Knock-out (KO) validation is crucial to confirm specificity and avoid false positives [4] [7]. |
| Biotinylated Secondary Antibodies | Serves as a link for subsequent amplification in indirect staining. | Multiple molecules can bind to a single primary antibody, providing the first level of signal amplification [2]. |
| Bright Fluorophores | The detectable label that emits light upon excitation. | For low-abundance targets, select fluorophores with high extinction coefficients and quantum yields (e.g., Phycoerythrin (PE), Alexa Fluor 647) [2]. |
| Fluorophore-Conjugated Streptavidin | Binds with high affinity to biotin on the secondary antibody. | A single streptavidin molecule can be conjugated to multiple fluorophores, providing a second level of signal amplification [2] [5]. |
| Tyramide Signal Amplification (TSA) Kits | Enzyme-mediated system that deposits numerous fluorophores at the target site. | Provides extremely high sensitivity for detecting otherwise undetectable targets [5]. |
| Antifade Mounting Media | Preserves the fluorescence signal during storage and imaging. | Protects against photobleaching, which is critical when using high laser power or long exposure times for weak signals [1]. |
| Autofluorescence Quenchers | Reduces naturally occurring background fluorescence from tissue components. | Reagents like Vector TrueVIEW or Sudan Black B increase the signal-to-noise ratio, making weak specific signals easier to distinguish [6]. |
| 24,25-Epoxytirucall-7-en-3,23-dione | 24,25-Epoxytirucall-7-en-3,23-dione, MF:C30H46O3, MW:454.7 g/mol | Chemical Reagent |
| Pinocembrin, 7-acetate | Pinocembrin, 7-acetate, MF:C17H14O5, MW:298.29 g/mol | Chemical Reagent |
The strategic selection between direct and indirect immunostaining methods is paramount, with the indirect method being the cornerstone for sensitive detection of low-abundance proteins due to its inherent signal amplification. For the most challenging targets, moving beyond the standard indirect protocol to incorporate advanced amplification strategies—such as biotin-streptavidin systems or tyramide signal amplification—is not just beneficial but essential. By combining these powerful methods with rigorous antibody validation, meticulous protocol optimization, and the use of high-sensitivity reagents, researchers can reliably uncover the localization and expression of critical low-abundance protein targets, thereby advancing both basic research and drug development efforts.
The detection of low-abundance proteins (LAPs) is a fundamental challenge in modern biological research and drug development. These proteins, which include key signaling molecules, transcription factors, and receptors, often play critical roles in cellular processes despite their scarce quantities [8]. The central obstacle in their study is the signal-to-noise ratio (SNR)—the strength of the specific detection signal relative to the surrounding non-specific background interference. In proteomics, the dynamic concentration range of proteins can span an estimated 12-15 orders of magnitude, meaning high-abundance proteins can be present in concentrations millions of times greater than low-abundance species [9]. This vast disparity means that the signals from LAPs are often obscured, making their accurate detection and quantification exceptionally difficult. This application note details the sources of this critical challenge and provides validated protocols to enhance SNR for successful LAP detection in immunostaining applications.
The Signal-to-Noise Bottleneck in Protein Detection
The difficulty in detecting LAPs stems from several interconnected factors that collectively degrade the SNR.
Fundamental Physical and Technical Limitations
The cellular abundance of a protein is directly linked to its function. Signaling proteins like kinases and transcription factors are typically low-abundance, often constituting less than 1,000 copies per cell [8]. In a typical sample, the total protein mass is dominated by a few high-abundance proteins (e.g., albumin in serum, RuBisCO in plants), which can mask the detection signals of LAPs [9]. Furthermore, most analytical methods, including immunoassays, have a limited dynamic range of 4-5 orders of magnitude, which is insufficient to cover the full range of protein concentrations in a biological sample [9].
A high background signal, or "noise," is a primary contributor to poor SNR. Key sources of this noise include:
- Autofluorescence: Caused by endogenous molecules in cells and tissues, which fluoresce under the same wavelengths used for detection [3] [10].
- Unspecific Antibody Binding: Antibodies binding non-specifically to non-target proteins or the solid support (e.g., the membrane in Western blotting) [3] [11].
- Incomplete Transfer: In Western blotting, inefficient transfer of proteins from the gel to the membrane leads to a weak target signal [12].
- Masked Epitopes: Chemical fixation can crosslink proteins and mask the antigenic sites recognized by antibodies, reducing the specific signal [3].
The following table summarizes the major challenges and their impact on the signal-to-noise ratio.
Table 1: Key Challenges in Low-Abundance Protein Detection and Their Impact on Signal-to-Noise Ratio
| Challenge | Impact on Signal | Impact on Noise | Overall Effect on SNR |
|---|---|---|---|
| Massive Dynamic Range [9] | LAP signal is obscured by high-abundance proteins | High-abundance proteins contribute to non-specific background | Drastic Reduction |
| Limited Method Dynamic Range [9] | LAP concentrations fall below detection limits | Saturation from high-abundance proteins increases background | Reduction |
| Antibody Specificity [12] [3] | Reduced by cross-reactivity and masked epitopes | Increased due to non-specific binding | Reduction |
| Sample Autofluorescence [3] [10] | No direct impact | Significant increase in background fluorescence | Reduction |
| Inefficient Transfer (WB) [12] | Significant reduction of target protein on membrane | No direct impact | Reduction |
Methodologies for SNR Enhancement: Application Notes and Protocols
Protocol: Enhanced Immunofluorescence with a Low-Cost Antibody Signal Enhancer (ASE)
This protocol, adapted from Rosas-Arellano et al. (2020), uses a simple, low-cost solution to significantly improve the SNR in immunostaining procedures for LAPs [10].
1. Principle The ASE solution works through multiple mechanisms: glycine competes with free aldehydes from fixation to prevent them from binding antibodies and epitopes; hydrogen peroxide quenches autofluorescence; and a mixture of non-ionic detergents (Triton X-100 and Tween-20) provides synergistic membrane permeabilization [10].
2. Reagents and Solutions
- Prepare ASE Solution: 0.75% glycine, 0.075% hydrogen peroxide, 0.04% Triton X-100, 0.03% Tween-20 in your standard buffer (e.g., PBS).
- Standard blocking solution (e.g., 1-5% BSA or serum in PBS).
- Primary antibody dilution buffer (typically 1% BSA in PBS).
- Primary and secondary antibodies.
3. Step-by-Step Procedure
- Sample Preparation: Follow standard procedures for cell culture, tissue fixation, and permeabilization.
- Blocking: Prepare a blocking solution by mixing 2/3 of your standard blocking solution with 1/3 of the ASE solution. Incubate the samples with this mixture for 1 hour at room temperature.
- Primary Antibody Incubation: Dilute the primary antibody in a solution composed of 2/3 standard antibody dilution buffer and 1/3 ASE solution. Incubate with the samples overnight at 4°C.
- Washing: Wash the samples 3 times for 5 minutes each with a wash buffer that contains 0.01% Tween-20.
- Secondary Antibody Incubation: Incubate with the fluorophore-conjugated secondary antibody (diluted in standard dilution buffer without ASE) for 1 hour at room temperature, protected from light.
- Final Wash and Mounting: Perform final washes and mount the samples for microscopy.
4. Key Applications and Validation
- This method has been validated in cell culture, primate brain tissue, and human cancer biopsies [10].
- It is compatible with immunohistofluorescence and can be combined with other protocols, such as the "SIP" (Sequential Incubation Process) for multiple labeling [10].
- The ASE can allow for the use of higher antibody dilutions, conserving precious reagents.
Protocol: Optimizing Western Blotting for Low-Abundance Proteins
This protocol consolidates best practices for maximizing SNR when detecting LAPs via Western blot [12] [11].
1. Efficient Protein Extraction and Transfer
- Lysis Buffer: For proteins in specific compartments (e.g., nucleus, mitochondria), use a harsh lysis buffer like RIPA (containing SDS) to ensure complete lysis, or use subcellular fractionation kits to enrich for your target [11].
- Gel Chemistry: Choose the appropriate gel for optimal separation. Use Bis-Tris gels (6-250 kDa) for general use, Tris-Acetate gels (40-500 kDa) for high molecular weight proteins, and Tricine gels (2.5-40 kDa) for low molecular weight proteins [12].
- Membrane and Transfer: Use PVDF membrane for its higher protein binding capacity and lower non-specific binding compared to nitrocellulose. For efficient transfer, consider dry electroblotting systems to minimize handling inconsistencies and improve transfer reproducibility, especially for high molecular weight proteins [12].
2. Antibody and Detection Optimization
- Antibody Validation: Use antibodies that are knockdown/knockout (KD/KO) validated to ensure specificity for the target protein [11].
- Antibody Titration: When using high-sensitivity substrates, reduce the concentration of primary and secondary antibodies to prevent high background from HRP overloading. Follow manufacturer recommendations for dilution factors [11].
- Enhanced Chemiluminescence (ECL): Use high-sensitivity ECL substrates (e.g., SuperSignal West Atto, SignalBright series) capable of detecting down to the attogram to femtogram level. These substrates provide a brighter signal and a higher SNR than conventional ECL [12] [11].
Table 2: Key Research Reagent Solutions for SNR Enhancement
| Reagent / Tool | Function | Application Example |
|---|---|---|
| Combinatorial Peptide Ligand Libraries (CPLLs) [9] | Equalize protein concentrations by reducing high-abundance proteins and enriching low-abundance proteins. | Pre-processing of complex samples like serum or cell lysates for proteomic analysis. |
| High-Sensitivity ECL Substrates [12] [11] | Amplify the light output from the HRP enzyme, enabling detection of very low levels of protein. | Western blot detection of low-copy-number signaling proteins. |
| KD/KO Validated Antibodies [11] | Ensure the antibody binds specifically to the target protein, minimizing off-target signal (noise). | Any immunodetection application (WB, IF) where specificity is critical. |
| Antibody Signal Enhancer (ASE) [10] | A low-cost additive to block and antibody solutions that reduces background and amplifies specific signal. | Immunofluorescence and immunocytochemistry on fixed cells and tissues. |
| Tyramide Signal Amplification (TSA) [13] | An enzyme-mediated method that deposits multiple fluorophore labels at the target site, dramatically amplifying signal. | Detecting low-abundance targets in immunofluorescence, particularly for 3D pathology. |
Visualizing the Signal-to-Noise Challenge and Solutions
The following diagram illustrates the core problem of SNR and the primary strategic approaches to overcoming it.
The critical role of the signal-to-noise ratio in the detection of low-abundance proteins cannot be overstated. The difficulty is inherent in the vast dynamic range of proteomes and the technical limitations of our detection methods. However, as detailed in these application notes, a systematic approach that combines sample preparation optimization, reagent validation, and signal amplification strategies can successfully tilt the balance in favor of a detectable signal. By implementing protocols such as the Antibody Signal Enhancer for immunostaining and rigorous optimization for Western blotting, researchers can overcome these hurdles to illuminate the previously invisible world of low-abundance proteins, thereby advancing our understanding of cellular mechanisms and drug discovery.
Common Pitfalls in Sample Preparation That Obscure Low Abundance Targets
The detection of low-abundance proteins via immunostaining techniques such as Western blotting and immunohistochemistry (IHC) presents a significant challenge in biomedical research and drug development. These targets, which include rare biomarkers, signaling molecules, and transcription factors, are often obscured by inadequate sample preparation methods that fail to preserve, extract, and detect limited protein quantities. In the context of immunostaining research, where the visual output depends entirely on target preservation and accessibility, optimization of sample preparation is not merely beneficial but essential for generating reproducible and scientifically valid data. This application note details common pitfalls throughout the sample preparation workflow and provides optimized protocols to overcome these challenges, enabling reliable detection of low-abundance targets for critical research applications.
Critical Pitfalls and Optimized Solutions
Protein Extraction and Enrichment
Pitfall: Inefficient extraction leading to inadequate protein yield Inefficient lysis and extraction represent the first major point of failure for low-abundance targets. Standard lysis buffers may fail to completely disrupt cellular compartments, particularly for nuclear, membrane-bound, or cytoskeletal proteins, resulting in insufficient target protein in the final lysate.
Solutions:
- Localization-specific extraction: Use optimized buffers specific to your target's cellular location. Harsher detergents like RIPA buffer (containing SDS) are recommended for complete lysis of intracellular compartments, including the nuclear envelope [14] [15]. For particularly challenging localized proteins, consider subcellular fractionation kits to enrich nuclear or membrane components, thereby increasing the relative concentration of your target [14] [15].
- Inhibition of degradation: Add broad-spectrum protease and phosphatase inhibitors immediately to the lysis buffer to protect vulnerable epitopes and prevent degradation of already scarce targets [12] [14]. For phosphorylation studies, this is particularly critical.
- Mechanical disruption: Employ ultrasonication to ensure complete disruption of all cellular clusters and facilitate the release of nuclear proteins. A typical protocol involves 3-second pulses with 10-second intervals, repeated 5-15 times at 40 kW power [14].
- Inhibition of secretion: For secreted proteins, add Brefeldin A (BFA) to cell cultures before harvesting to prevent target protein secretion into the extracellular space, thereby ensuring sufficient protein remains detectable in the whole cell lysate [14] [16].
Table 1: Recommended Extraction Methods Based on Protein Localization
| Protein Localization | Recommended Lysis Buffer | Additional Techniques |
|---|---|---|
| Nuclear | RIPA with SDS | Ultrasonication, nuclear fractionation kits |
| Membrane-bound | RIPA with SDS | Membrane fractionation kits |
| Cytoplasmic | Standard lysis buffers | Mechanical homogenization |
| Secreted | Standard lysis buffers | Brefeldin A treatment pre-harvest |
| Multiple compartments | RIPA with SDS | Subcellular fractionation |
Gel Electrophoresis and Transfer
Pitfall: Poor resolution and transfer efficiency Even with successful extraction, inadequate separation during gel electrophoresis or inefficient transfer to membrane can prevent antibody access to low-abundance targets, resulting in weak or non-detectable signals.
Solutions:
- Gel chemistry selection: Choose gel chemistry based on your target protein size. Bis-Tris gels (6-250 kDa) with neutral pH preserve protein integrity and provide better band resolution than traditional Tris-glycine gels. For high molecular weight proteins (>300 kDa), Tris-Acetate gels provide superior separation, while Tricine gels are ideal for low molecular weight proteins (<40 kDa) [12] [14].
- Increased sample loading: Load 50-100 μg of total protein per lane to enhance target protein quantity. Using gels with 1.5 mm combs instead of 1.0 mm increases well capacity, allowing for higher sample volumes without compromising separation [14].
- Optimal transfer methods: For high molecular weight targets, extend transfer times and consider higher voltages. PVDF membranes are preferred over nitrocellulose for their higher protein binding capacity and lower non-specific antibody binding, which reduces background [14] [15]. Ensure PVDF membranes are pre-wetted in methanol before transfer [14] [16].
- Transfer verification: Stain membranes with Ponceau S post-transfer to confirm efficient and uniform protein migration from gel to membrane [14] [16].
Antibody Selection and Validation
Pitfall: Non-specific or insensitive detection The use of non-validated antibodies or inappropriate concentrations represents one of the most common failures in low-abundance target detection, leading to high background, false positives, or complete absence of signal.
Solutions:
- Antibody validation: Select antibodies specifically validated for your application (Western blot, IHC, IF) and ideally verified using knockout/knockdown controls to confirm specificity. Recombinant monoclonal antibodies are recommended for superior specificity and batch-to-batch consistency [4].
- Antibody concentration optimization: While higher primary antibody concentrations are often necessary for low-abundance targets, excessive concentrations can increase background. Follow manufacturer recommendations and perform gradient testing to determine optimal dilution [14] [16]. When using high-sensitivity substrates, secondary antibody concentrations may need reduction to prevent background [15].
- Detection method selection: For maximum sensitivity, use indirect detection methods with HRP-conjugated secondary antibodies and high-sensitivity chemiluminescent substrates, which provide significant signal amplification over direct detection methods or fluorescent systems [4] [15].
Table 2: Antibody and Detection Optimization for Low-Abundance Targets
| Parameter | Standard Approach | Optimized for Low-Abundance Targets |
|---|---|---|
| Antibody Validation | Application-specific | Knockout/Knockdown validated |
| Antibody Clonality | Polyclonal or monoclonal | Recombinant monoclonal |
| Detection Method | Direct or standard indirect | Indirect with signal amplification |
| Secondary Antibody | Standard HRP-conjugated | HRP-conjugated with high-sensitivity substrates |
| Signal Detection | Standard ECL or fluorescence | Enhanced chemiluminescence (e.g., SuperSignal West Atto, SignalBright) |
Tissue Preparation for IHC/IF
Pitfall: Epitope masking and poor morphology In immunohistochemistry and immunofluorescence, improper tissue fixation and processing can mask epitopes through cross-linking or destroy tissue morphology, making it impossible to localize low-abundance targets accurately.
Solutions:
- Fixation optimization: For FFPE tissues, ensure consistent fixation times to prevent over-fixation which causes excessive cross-linking and epitope masking, or under-fixation which compromises morphology [17] [18].
- Antigen retrieval: Employ optimized antigen retrieval methods based on your target epitope. Pressure-boiling slides in acidic citrate buffer (pH 6) for 15-20 minutes is common, though some nuclear targets may require high-pH retrieval solutions [17].
- Multiplex IHC considerations: For multiplex fluorescent IHC, carefully optimize antibody concentrations using conventional IHC first, then apply to multiplex protocols with sequential antibody application, HRP-based tyramide signal amplification, and heat-mediated antibody stripping between rounds [19].
Complete Workflow for Low-Abundance Protein Detection
Enhanced Detection System for Low-Abundance Targets
The Scientist's Toolkit: Essential Reagents for Low-Abundance Targets
Table 3: Key Research Reagent Solutions
| Reagent Category | Specific Examples | Function in Low-Abundance Detection |
|---|---|---|
| Protease Inhibitors | Broad-spectrum protease inhibitor cocktails | Protect vulnerable low-abundance targets from degradation during extraction [12] [14] |
| Enhanced Lysis Buffers | RIPA buffer with SDS | Complete disruption of cellular compartments for efficient protein recovery [14] [15] |
| Specialized Gels | Bis-Tris, Tris-Acetate, Tricine gels | Optimal separation based on protein size for improved resolution [12] [14] |
| High-Binding Capacity Membranes | PVDF membranes | Increased protein binding with reduced background compared to nitrocellulose [14] [15] |
| Validated Antibodies | Knockout/knockdown validated antibodies | Specific confirmation of target recognition with minimal off-target binding [4] [15] |
| High-Sensitivity Substrates | SuperSignal West Atto, SignalBright series | Enhanced chemiluminescent detection capable of attogram to femtogram sensitivity [12] [15] |
| Antigen Retrieval Reagents | Citrate buffer (pH 6), EDTA buffer (pH 9) | Unmasking of epitopes cross-linked during tissue fixation [17] |
| 4E-Deacetylchromolaenide 4'-O-acetate | 4E-Deacetylchromolaenide 4'-O-acetate, MF:C22H28O7, MW:404.5 g/mol | Chemical Reagent |
| Isoorientin-7-O-[6-sinapoyl]-glucoside | Isoorientin-7-O-[6-sinapoyl]-glucoside, MF:C38H40O20, MW:816.7 g/mol | Chemical Reagent |
Successful detection of low-abundance protein targets requires a holistic approach to sample preparation that addresses multiple potential failure points across the entire workflow. By implementing these optimized protocols—from targeted protein extraction and appropriate separation chemistries to validated antibodies and enhanced detection systems—researchers can significantly improve their capability to visualize and quantify scarce targets. These methods provide a foundation for reliable investigation of low-abundance proteins, enabling advances in biomarker discovery, drug development, and fundamental biological research where sensitivity and specificity are paramount.
The detection and accurate quantification of low-abundance proteins are critical for advancing biomedical research, particularly in the discovery of biomarkers for diseases such as cancer. However, the immense dynamic range of protein concentrations in biological samples presents a significant analytical challenge. In blood serum or plasma, for instance, high-abundance proteins (HAPs) like albumin and immunoglobulins can constitute over 90% of the total protein mass, while potential biomarker proteins may exist at concentrations several orders of magnitude lower [20] [21]. This disparity allows HAPs to dominate analytical signals, effectively masking the detection of rare, low-abundance targets [20]. This application note delineates the core problems posed by HAPs, evaluates current solutions with structured data, and provides detailed protocols for researchers engaged in immunostaining and proteomic analysis of low-abundance protein targets.
Mechanisms of Interference and Masking
The domination of HAPs manifests through several technical mechanisms that compromise assay sensitivity and specificity.
- Ion Suppression in Mass Spectrometry: In LC-MS/MS analysis, the co-elution of highly abundant peptides from HAPs can suppress the ionization of peptides from low-abundance proteins, rendering them undetectable [20] [21].
- Resource Sequestration: HAPs compete for and deplete reagents, such as enzymes (e.g., trypsin), antibodies, and fluorescent tags, during sample processing and staining, leaving limited capacity for the detection of low-abundance targets [3].
- Increased Background Noise: Non-specific binding of antibodies to HAPs or to surfaces saturated with HAPs elevates background signal, which drastically reduces the signal-to-noise ratio critical for visualizing low-abundance proteins [3] [22].
- Spatial Occlusion: In tissue imaging, dense regions of HAPs can physically block antibody access to epitopes on less abundant targets, leading to false negatives [3].
The following diagram illustrates the core problem and the two principal strategic approaches to resolve it.
Quantitative Assessment of Depletion and Amplification Strategies
Comparative Performance of Depletion Techniques
A cross-species proteomic study evaluated several depletion methods for their efficiency, protein identification capability, and cost-effectiveness. The table below summarizes the key findings, which are critical for selecting an appropriate method for your experimental setup [21].
Table 1: Performance comparison of high-abundance protein (HAP) depletion methods across different animal sera.
| Depletion Method | Working Mechanism | Depletion Efficiency (Rank) | Protein Identification (Rank) | Cost-Effectiveness (USD/sample) |
|---|---|---|---|---|
| Minute Kit | Solubility-based (dissolves HAPs, precipitates low-abundance proteins) | 1 | 2 | ~$11 - $136 |
| Norgen Kit | Ion Exchange Chromatography | 2 | 1 | >$20 (more expensive than PerCA) |
| PerCA Precipitation | Acid-based Precipitation (Perchloric Acid) | 3 | 3 | ~$5 (>20x cheaper than kits) |
| Thermo Kit | Immunoaffinity (Anti-Albumin) | 4 | 4 | Most expensive among kits |
Advanced Signal Amplification Technologies
For techniques like western blot, immunofluorescence, and mass cytometry, signal amplification is often necessary to detect low-abundance proteins. The following table compares several advanced amplification methods [22] [23].
Table 2: Comparison of advanced signal amplification technologies for detecting low-abundance proteins.
| Technology | Principle | Key Feature | Reported Signal Increase | Multiplexing Capacity |
|---|---|---|---|---|
| ACE (Amplification by Cyclic Extension) | Thermal-cycling-based DNA concatenation with photocrosslinking | High thermal stability; suitable for mass cytometry | >500-fold | High (>30 targets) |
| Immuno-SABER | Presynthesized DNA concatemer hybridization | Originally developed for imaging | Not quantified for mass cytometry | High (tens of targets) |
| Tyramide Signal Amplification (TSA) | Enzyme-catalyzed deposition of tyramide | High sensitivity | High (often >100x) | Low (limited by enzyme use) |
| Enhanced Chemiluminescence (e.g., SignalBright) | Enhanced chemiluminescent substrates for HRP | Detects femtogram levels of protein | High vs. standard ECL | Compatible with standard WB |
Detailed Experimental Protocols
Protocol 1: Immunoaffinity Depletion of Serum/Plasma HAPs
This protocol is adapted for a standard immunoaffinity depletion column (e.g., MARS, Seppro) [20].
Materials:
- Immunoaffinity depletion column specific to target species HAPs.
- Equilibrium Buffer (as recommended by column manufacturer).
- Serum or plasma sample.
- Low-protein binding microcentrifuge tubes.
Procedure:
- Equilibration: Condition the immunoaffinity column with 5-10 column volumes of Equilibrium Buffer at 4°C.
- Sample Preparation: Centrifuge the serum/plasma sample at 15,000 × g for 10 minutes to remove any precipitates or lipids. Dilute the supernatant as per the manufacturer's instructions (typically 1:5 in Equilibrium Buffer).
- Depletion: Load the diluted sample onto the pre-equilibrated column. Collect the flow-through, which contains the HAP-depleted serum/plasma.
- Wash: Wash the column with 2-3 column volumes of Equilibrium Buffer, pooling the wash fractions with the initial flow-through.
- Concentration and Buffer Exchange: Concentrate the pooled HAP-depleted sample using a centrifugal filter unit (e.g., 10 kDa MWCO) and exchange the buffer into one compatible with downstream analysis (e.g., PBS or MS-compatible buffer).
- Regeneration and Storage: Regenerate the column according to the manufacturer's instructions for future use.
Protocol 2: ACE Signal Amplification for Mass Cytometry
This protocol enables high-sensitivity detection of low-abundance epitopes in single-cell mass cytometry [23].
Materials:
- Antibodies conjugated to short DNA initiator oligonucleotides (TT-a, 11-mer).
- Bst DNA Polymerase (Large Fragment).
- Extender oligonucleotide (a-T-a, 19-mer).
- Deoxynucleotide solution (dNTPs).
- Detector oligonucleotides with CNVK photocrosslinker, conjugated to metal-cheating polymers (e.g., DTPA-Ln3+).
- UV lamp (365 nm).
Procedure:
- Staining: Stain cell suspensions (for surface or intracellular markers) with the initiator-conjugated antibody cocktail. Wash to remove unbound antibodies.
- Cyclic Extension Reaction:
- Prepare the extension master mix containing Bst polymerase, dNTPs, and the extender oligonucleotide.
- Resuspend the stained cells in the extension master mix.
- Perform thermal cycling (20-500 cycles): Denature at 58°C for 1 minute, Extend at 22°C for 1 minute.
- This cycle elongates the initiator strand, creating hundreds of repeats of the detector binding site.
- Metal Detector Hybridization: Hybridize the metal-conjugated, CNVK-modified detector oligonucleotides to the extended initiator strands on the cells. Incubate for 30 minutes at room temperature.
- Photocrosslinking: Expose the cell suspension to UV light (365 nm) for 1 second to covalently crosslink the detector strands to the extended initiator. This step is critical for stability during mass cytometry acquisition.
- Acquisition: Wash cells and acquire data on a mass cytometer. The stabilized amplification complex survives the high-temperature vaporization step.
The workflow for the ACE protocol is detailed below.
Protocol 3: Optimized Western Blotting for Low-Abundance Proteins
This protocol focuses on maximizing the signal from low-abundance targets in western blot [22].
Materials:
- RIPA Lysis Buffer (or other appropriate, harsh lysis buffer for efficient extraction).
- PVDF Membrane (higher protein binding capacity than nitrocellulose).
- High-Sensitivity Chemiluminescent Substrate (e.g., SignalBright Pro, Plus, or Max).
- Knockout/Knockdown validated primary antibodies.
- HRP-conjugated secondary antibodies.
Procedure:
- Protein Extraction: Use a harsh lysis buffer like RIPA (containing SDS) to ensure efficient extraction of proteins from all cellular compartments, including the nucleus. For particularly difficult targets, consider using subcellular fractionation kits prior to lysis.
- Gel Electrophoresis and Transfer: Perform standard SDS-PAGE. For transfer to membrane, optimize conditions for your target protein's molecular weight. Use PVDF membrane due to its high binding capacity and low non-specific antibody binding. Ensure complete transfer to prevent signal loss.
- Blocking and Antibody Incubation:
- Block the membrane with an appropriate blocking agent (e.g., 5% BSA or non-fat milk in TBST) for 1 hour.
- Critical: When using high-sensitivity ECL substrates, it is essential to titrate and often dramatically decrease the concentration of both primary and secondary antibodies to avoid high background and signal saturation. Follow the substrate manufacturer's recommendations.
- Signal Detection:
- Incubate the membrane with the high-sensitivity ECL substrate.
- Image using a digital imager. The stable signal (often >5 hours) allows for multiple exposures to ensure optimal capture without over-saturation.
The Scientist's Toolkit: Essential Research Reagents
Table 3: Key reagents and materials for studying low-abundance protein targets.
| Item | Function/Purpose | Example Products/Components |
|---|---|---|
| HAP Depletion Kits | Removes high-abundance proteins (e.g., Albumin, IgG) to reduce dynamic range. | MARS columns (Agilent), Seppro kits (Millipore), ProteoPrep (Sigma), Minute kit. |
| Signal Amplification Substrates | Enhances detection signal in immunoassays like western blot. | SignalBright ECL (Proteintech), Tyramide (TSA) kits. |
| DNA-Conjugated Antibodies | Enables DNA-based signal amplification methods. | Custom conjugates for ACE, Immuno-SABER. |
| High-Sensitivity ECL Substrates | Provides ultra-sensitive chemiluminescent detection for western blots. | SignalBright Pro, Plus, Max (Proteintech). |
| Photocrosslinkable Oligos (CNVK) | Stabilizes DNA amplification complexes for mass spectrometry. | CNVK-modified detector oligonucleotides. |
| Ion Exchange Resins | Depletes HAPs based on protein charge. | Used in Norgen's ProteoSpin kit. |
| Validated Primary Antibodies | Ensures specificity and reduces false positives; crucial for low-abundance targets. | Knockout/Knockdown validated antibodies (e.g., from Proteintech). |
| 2-Hydroxy4,7-dimethoxy-9,10-dihydrophenanthrene | 2-Hydroxy4,7-dimethoxy-9,10-dihydrophenanthrene, MF:C16H16O3, MW:256.30 g/mol | Chemical Reagent |
| cis-9-Hexadecen-1-yl formate | cis-9-Hexadecen-1-yl formate, MF:C17H32O2, MW:268.4 g/mol | Chemical Reagent |
The challenge of detecting low-abundance proteins amidst a sea of high-abundance interferents is a central problem in modern proteomics and biomarker research. Success requires a strategic combination of sample pre-fractionation (e.g., depletion) to reduce complexity and high-sensitivity detection methodologies (e.g., ACE, optimized immunofluorescence) to amplify the signal of interest. The protocols and data provided herein offer a framework for researchers to systematically address this problem. As the field advances, the integration of these methods with robust normalization and calibration techniques [24] [25] will be paramount for achieving the reproducibility and quantitative rigor required for translational research and drug development.
Advanced Strategies for Success: Sample Preparation, Enrichment, and High-Sensitivity Detection
The reliable detection of low-abundance protein targets via immunostaining is a cornerstone of modern biomedical research and drug development. This achievement hinges on a meticulously optimized sample preparation workflow designed to maximize epitope preservation and accessibility. This application note provides a detailed, protocol-driven guide to mastering the critical stages of fixation, permeabilization, and antigen retrieval. Framed within the context of low-abundance target research, we summarize key quantitative data in structured tables, provide step-by-step methodologies, and illustrate optimized signaling pathways and workflows. The following sections are designed to empower researchers to overcome the significant challenges associated with epitope masking and degradation, thereby ensuring high-specificity, high-sensitivity, and reproducible immunostaining results.
Immunostaining allows for the localization of proteins at a quantitative level within cells and tissues [3]. However, the entire immunostaining process is fraught with potential pitfalls that can lead to the misinterpretation of results, including protein loss, relocation, conformational changes, and the masking of epitopes [3]. These challenges are exponentially greater when the target protein is of low abundance. Factors such as over-fixation, improper permeabilization, and inadequate antigen retrieval can obliterate a weak signal or elevate background noise to unacceptable levels. Consequently, a nuanced understanding and precise execution of sample preparation are non-negotiable for researchers aiming to visualize and study rare biomarkers, post-translational modifications, or low-expression gene products effectively.
Critical Stages for Epitope Preservation
Fixation: Balancing Preservation and Accessibility
The primary goal of fixation is to stabilize cells and tissues while preserving morphological detail and preventing degradation [26]. However, the most common fixative, formalin, works by creating protein cross-links, which can obscure antigenic sites and make epitopes inaccessible to antibodies [27] [26]. Therefore, fixation must be a carefully calibrated process.
Protocol: Optimized Formalin Fixation
- Fixative Selection: Use 10% neutral buffered formalin for most applications.
- Fixative Volume: Ensure the volume of fixative is 15-20 times greater than the tissue volume to ensure effective penetration [26].
- Fixation Time: Optimize fixation time based on tissue size. Under-fixation leads to poor morphology and protein loss, while over-fixation excessively masks epitopes. As a general guide, fix small tissue specimens (e.g., mouse organs) for 24-48 hours at room temperature [26]. For cell cultures, 15-30 minutes is often sufficient.
- Post-Fixation Handling: After fixation, tissues should be processed for paraffin embedding or transferred to a 70% ethanol solution for storage to prevent over-fixation and brittleness.
Permeabilization: Enabling Antibody Access
Permeabilization is the process of creating holes in the cellular membranes to allow antibodies to access intracellular targets. This step can be performed as an independent stage or incorporated into the blocking or washing buffers [3]. The choice of agent and concentration is critical, as overly harsh permeabilization can damage cellular structures.
Protocol: Permeabilization for Cultured Cells
- Reagent Preparation: Prepare a permeabilization solution of 0.1-0.5% Triton X-100 in PBS.
- Application: After fixation and washing, incubate cells with the permeabilization solution for 10-15 minutes at room temperature.
- Washing: Rinse cells thoroughly with PBS to remove the detergent. This step can be combined with a blocking step using serum or protein blockers (e.g., BSA) to minimize non-specific antibody binding.
Antigen Retrieval: Reversing Epitope Masking
Antigen retrieval is arguably the most critical step for successful immunostaining of formalin-fixed, paraffin-embedded (FFPE) tissues. It reverses the cross-links formed during fixation, thereby unmasking epitopes [27]. The two primary methods are Heat-Induced Epitope Retrieval (HIER) and Protease-Induced Epitope Retrieval (PIER), with HIER being generally preferred due to its higher success rate and better preservation of morphology [28].
Protocol: Heat-Induced Epitope Retrieval (HIER) The following protocol can be performed using a pressure cooker, microwave, or vegetable steamer [27].
- Dewax and Rehydrate: Deparaffinize FFPE sections in xylene and rehydrate through a graded series of ethanol to water.
- Select Retrieval Buffer: The choice of buffer and its pH are antigen-dependent. Common buffers include:
- Sodium Citrate (10 mM, pH 6.0)
- Tris-EDTA (10 mM Tris, 1 mM EDTA, 0.05% Tween 20, pH 9.0)
- EDTA (1 mM, pH 8.0)
- Heat Treatment:
- Pressure Cooker Method: Bring the retrieval buffer to a boil in a pressure cooker. Immerse slides, secure the lid, and once full pressure is reached, incubate for 3 minutes. Immediately cool by running cold water over the cooker for 10 minutes [27].
- Microwave Method: Immerse slides in pre-heated retrieval buffer in a microwave-safe vessel. Heat at full power to maintain a boil for 20 minutes, ensuring slides do not dry out. Cool at room temperature for 20-30 minutes.
- Wash: Rinse slides with distilled water and proceed to immunostaining.
Optimization and Data Presentation
Optimizing Antigen Retrieval Conditions
Achieving a strong, specific signal for a low-abundance target often requires empirical optimization of the HIER conditions. The key variables are buffer pH, retrieval time, and temperature [28].
Table 1: Experimental Matrix for Optimizing HIER Conditions
| Time | Antigen Retrieval Solution pH | ||
|---|---|---|---|
| Acidic (e.g., Citrate, pH 6.0) | Neutral (e.g., PBS) | Basic (e.g., Tris-EDTA, pH 9.0) | |
| 1 minute | Condition A | Condition B | Condition C |
| 5 minutes | Condition D | Condition E | Condition F |
| 15 minutes | Condition G | Condition H | Condition I |
Researchers should test this matrix using a known positive control tissue to identify the combination that yields the highest signal-to-noise ratio for their specific target [28].
Table 2: Common Antigen Retrieval Buffers and Their Applications
| Buffer | Composition | Typical pH | Recommended For |
|---|---|---|---|
| Sodium Citrate | 10 mM Sodium Citrate, 0.05% Tween 20 | 6.0 | A wide range of nuclear and cytoplasmic antigens [27] |
| Tris-EDTA | 10 mM Tris Base, 1 mM EDTA, 0.05% Tween 20 | 9.0 | Many phospho-targets and more challenging antigens [27] |
| EDTA | 1 mM EDTA | 8.0 | An alternative for certain nuclear antigens |
Visualizing the Optimization Workflow
The following diagram illustrates the decision-making pathway for optimizing sample preparation, particularly for challenging low-abundance targets.
The Scientist's Toolkit: Essential Reagents and Materials
A successful immunostaining experiment relies on high-quality, specific reagents. The following table details key solutions required for the protocols described in this note.
Table 3: Research Reagent Solutions for Immunostaining
| Reagent / Material | Function / Purpose | Example / Notes |
|---|---|---|
| 10% Neutral Buffered Formalin | Chemical fixative that stabilizes tissue architecture and proteins by forming cross-links. | Standard for FFPE tissues; requires precise timing to avoid over-fixation [26]. |
| Triton X-100 | Detergent for permeabilizing cell membranes to allow antibody entry into cells. | Use at 0.1-0.5% in PBS; concentration and time require optimization. |
| Protease Inhibitor Cocktail | Prevents proteolytic degradation of target proteins during cell lysis and sample preparation. | Essential addition to lysis buffers for labile or low-abundance targets [14]. |
| HIER Buffers (Citrate, Tris-EDTA) | Breaks methylene cross-links formed during formalin fixation, unmasking epitopes for antibody binding. | pH is critical; selection is antigen-dependent [27] [28]. |
| Blocking Serum (e.g., BSA, NGS) | Reduces non-specific binding of antibodies to the tissue, thereby lowering background signal. | Prepare in TBST; serum should match the species of the secondary antibody. |
| Primary Antibody | Binds with high specificity to the target antigen of interest. | Must be validated for IHC/ICC; use higher concentrations for low-abundance targets [14]. |
| Trilobatin 2''-acetate | Trilobatin 2''-acetate, MF:C23H26O11, MW:478.4 g/mol | Chemical Reagent |
| 10-Hydroxy-2,6,10-trimethyl-2,6,11-dodeca-4-one | 10-Hydroxy-2,6,10-trimethyl-2,6,11-dodeca-4-one, MF:C15H24O2, MW:236.35 g/mol | Chemical Reagent |
Concluding Remarks
Mastering sample preparation is not a mere preliminary step but the foundational element upon which reliable immunostaining data is built. This is especially true in the demanding field of low-abundance protein research, where the margin for error is minimal. By systematically optimizing fixation, permeabilization, and—most crucially—antigen retrieval, researchers can dramatically enhance epitope preservation, maximize signal-to-noise ratio, and ensure the reproducibility of their findings. The protocols, optimization strategies, and reagent knowledge contained in this application note provide a concrete pathway to achieving this mastery, ultimately supporting robust and impactful scientific discovery.
The detection of low-abundance proteins represents a significant challenge in biomedical research, particularly in the study of signaling pathways, biomarker discovery, and drug development. Proteins exist in mammalian cells across an extraordinary concentration range of at least seven orders of magnitude, with many functionally important proteins such as transcription factors and cell-surface cytokine receptors expressing at levels below the detection threshold of conventional immunohistochemistry and immunofluorescence techniques [29]. This limitation has driven the development of sophisticated signal amplification methodologies that enable researchers to visualize and quantify these elusive targets without fundamentally perturbing the finely balanced molecular interaction networks that underlie cellular function [29].
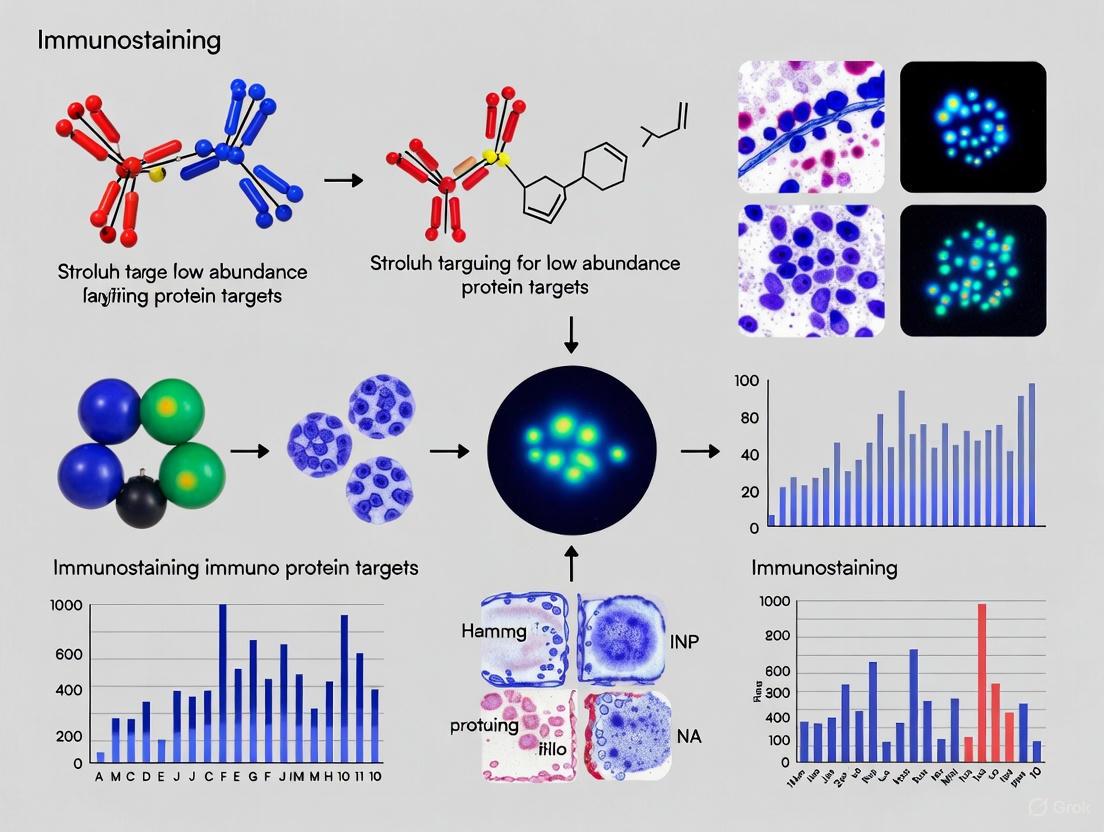
Signal amplification techniques have evolved to address two primary needs in biomedical research: enhancing sensitivity for targets present in limited copies per cell and enabling multiplexed detection of several targets within the same sample. Among these techniques, Tyramide Signal Amplification (TSA) has emerged as a powerful enzyme-mediated method that substantially increases detection sensitivity for both proteins and nucleic acids [30] [31]. Also known as Catalyzed Reporter Deposition (CARD), TSA leverages the catalytic activity of horseradish peroxidase (HRP) to generate high-density labeling of target molecules, achieving up to 100-fold greater sensitivity compared to conventional detection methods [31]. This enhanced sensitivity is particularly valuable for researchers investigating spatial relationships within tissue microenvironments, where the simultaneous detection of multiple low-abundance targets can provide critical insights into cellular interactions and disease mechanisms [32].
Principles of Tyramide Signal Amplification
Fundamental Mechanism
Tyramide Signal Amplification is based on the catalytic activity of horseradish peroxidase (HRP) to generate highly reactive tyramide radicals that covalently bind to tyrosine residues in proteins surrounding the enzyme site [30] [33]. The fundamental process begins when a target molecule of interest is labeled with HRP enzymes through specific antibodies. When the labeled tissue is exposed to a solution containing biotinylated or fluorophore-conjugated tyramine and hydrogen peroxide (Hâ‚‚Oâ‚‚), the HRP enzyme catalyzes the oxidation of the phenolic part of tyramine [30]. This reaction generates a quinone-like structure containing a radical on the C2 group of tyramine, creating "activated" tyramine that subsequently forms covalent bonds with electron-rich tyrosine residues on nearby proteins [30].
The covalent nature of tyramide deposition is a key feature that distinguishes TSA from conventional detection methods. Unlike standard immunofluorescence techniques that rely on affinity binding, the covalent bonding of tyramide substrates creates a stable signal that remains localized to the site of the HRP enzyme, resulting in excellent spatial resolution [31]. This localization is critical for accurate subcellular localization studies and prevents signal diffusion that could compromise experimental results. Each HRP enzyme can activate multiple tyramide substrate molecules, creating a substantial amplification effect that dramatically enhances detection sensitivity for low-abundance targets that would otherwise remain undetectable [31].
Direct vs. Indirect Detection Approaches
TSA can be implemented through either direct or indirect detection approaches, each offering distinct advantages for specific applications. In the direct TSA method, the tyramide substrate is conjugated directly to a fluorophore, allowing immediate signal detection after the deposition reaction without requiring additional detection steps [30]. This approach provides good spatial resolution and high signal intensity while simplifying the experimental workflow. The direct method is particularly advantageous when minimal background and streamlined procedures are priorities.
In contrast, the indirect TSA approach utilizes hapten-labeled tyramides, most commonly biotin-XX tyramide, which requires a subsequent detection step with a streptavidin conjugate or anti-hapten antibody [31]. Although this method adds complexity to the protocol, it provides additional flexibility as the same hapten-labeled tyramide can be detected with different conjugates, enabling researchers to customize the detection methodology based on their specific needs. The indirect approach also offers potential for further signal amplification through additional enzymatic steps, which can be beneficial for exceptionally challenging targets [31].
Comparative Advantage Over Conventional Methods
TSA methodology offers several significant advantages over conventional detection techniques. When compared to standard avidin-biotinylated enzyme complex (ABC) procedures, TSA has demonstrated up to 100-fold improvement in detection sensitivity [31]. This enhanced performance translates into practical benefits for researchers, including the ability to use dramatically lower concentrations of primary antibodies - in some cases up to 50-fold higher dilutions - while still obtaining robust signals [30]. This antibody conservation is particularly valuable when working with rare or expensive antibodies.
The amplification power of TSA also enables detection of targets that are simply undetectable with conventional methods. For example, researchers have successfully utilized TSA to detect low-abundance epidermal growth factor (EGF) and estrogen receptors by flow cytometry with far greater sensitivity than achievable using directly labeled probes or standard fluorophore-labeled antibodies [31]. Similarly, TSA has proven effective for fluorescence in situ hybridization (FISH) applications, enabling detection of low-abundance mRNAs and facilitating definitive results in a single day, which is notably faster than other FISH techniques [30].
TSA Protocols and Methodologies
Standard TSA Workflow for Immunohistochemistry
The implementation of Tyramide Signal Amplification follows a systematic workflow that shares similarities with conventional immunohistochemistry but incorporates critical amplification steps. The following protocol outlines the standard procedure for TSA-based detection of low-abundance proteins in cell cultures or tissue sections:
Sample Preparation: Fix cells or tissue sections using appropriate fixatives (typically formaldehyde-based) followed by permeabilization to allow antibody access to intracellular targets. The fixation step must be optimized to preserve antigenicity while maintaining cellular structure [33].
Blocking: Incubate samples with a blocking buffer to minimize non-specific binding of antibodies. TSA-specific blocking reagents are often included in commercial kits to further reduce background signal [31].
Primary Antibody Incubation: Apply target-specific primary antibody diluted in an appropriate buffer. Due to the signal amplification, primary antibodies can typically be used at significantly higher dilutions (e.g., 10- to 100-fold higher) compared to conventional IHC [30]. Incubation conditions (time, temperature) should be optimized for each antibody.
HRP-Conjugated Secondary Antibody Incubation: Detect the primary antibody using a species-specific secondary antibody conjugated to horseradish peroxidase. Alternatively, HRP-conjugated streptavidin can be used if a biotinylated primary antibody was employed [33] [31].
Tyramide Substrate Incubation: Prepare the tyramide working solution according to manufacturer instructions, typically by diluting the tyramide reagent in amplification buffer and adding Hâ‚‚Oâ‚‚ immediately before use. Incubate the samples with this working solution for precisely optimized duration (usually 2-10 minutes) to achieve optimal signal-to-noise ratio [33] [31].
Signal Detection: For fluorescent TSA, directly visualize the signal using appropriate microscopy filters. For chromogenic or biotinylated tyramide, perform additional detection steps as needed [30].
Counterstaining and Mounting: Apply nuclear counterstains (e.g., DAPI) if desired, and mount samples using antifade mounting media for fluorescence preservation [31].
Throughout this workflow, careful optimization of each step is essential, particularly for the tyramide incubation time, which significantly impacts signal intensity and background levels.
Multiplex Immunohistochemistry Using TSA
A powerful application of TSA technology is in multiplex immunohistochemistry (mIHC), which enables simultaneous detection of multiple protein targets on a single tissue section. The sequential nature of TSA staining, combined with efficient antibody stripping between cycles, makes it ideal for visualizing complex cellular populations and spatial relationships within tissues [32]. The general workflow for TSA-based mIHC includes:
First Target Staining: Complete the full TSA protocol for the first protein target using a specific fluorophore-labeled tyramide (e.g., Opal 520).
Antibody Stripping: Apply an optimized antibody removal method to eliminate primary and secondary antibodies while preserving the covalently deposited tyramide signal. Recent studies have demonstrated that hybridization oven-based antibody removal at 98°C (HO-AR-98) effectively strips antibodies while better preserving tissue integrity in delicate samples compared to microwave-assisted methods [32].
Validation of Stripping Efficiency: Confirm complete antibody removal by attempting to detect signal using the fluorophore from the previous cycle. Absence of signal indicates successful stripping.
Subsequent Target Staining: Repeat the TSA staining process for the next target using a different fluorophore-labeled tyramide (e.g., Opal 570, Opal 620, Opal 690).
Iterative Staining: Continue the cycle of staining and stripping for additional targets, typically up to 6-8 markers on a single section [32].
Final Visualization: Acquire multispectral images using appropriate fluorescence filters or spectral imaging systems.
This multiplexing approach enables researchers to characterize complex tissue microenvironments, such as the tumor immune microenvironment, with unprecedented resolution while conserving precious samples.
Technical Considerations and Optimization
Successful implementation of TSA requires careful attention to several technical aspects. The activity of the HRP enzyme is critical for optimal performance, and sodium azide should be strictly avoided in all buffers as it inhibits HRP activity [14]. The concentration of hydrogen peroxide in the tyramide working solution must be carefully controlled, as excessive Hâ‚‚Oâ‚‚ can lead to increased background signal or enzyme inactivation [31].
For multiplex applications, the antibody stripping step requires particular optimization. Different tissue types may respond differently to various stripping conditions. For example, brain tissues prone to delamination benefit from hybridization oven-based stripping at 98°C (HO-AR-98), which better preserves tissue integrity compared to microwave-assisted removal [32]. The sequence of target detection should also be planned strategically, with less abundant targets typically stained first and brighter fluorophores reserved for targets requiring higher sensitivity.
Appropriate controls are essential for validating TSA results. These should include samples without primary antibody (to assess background from secondary reagents), samples without tyramide substrate (to confirm signal amplification is TSA-dependent), and if possible, comparison with conventional detection methods to demonstrate enhanced sensitivity.
Complementary Techniques for Low-Abundance Protein Detection
Enhanced Western Blotting for Low-Abundance Proteins
While TSA excels in immunohistochemistry applications, detecting low-abundance proteins via Western blotting requires alternative optimization strategies. Enhanced Western blot protocols for low-abundance targets focus on several key areas: sample preparation, transfer efficiency, and sensitive detection methods [14].
Sample preparation is critical for successful detection of low-abundance proteins. For proteins localized to specific cellular compartments, such as transcription factors in the nucleus or membrane proteins, use of appropriate lysis buffers is essential. RIPA buffer containing SDS is recommended for complete lysis of intracellular compartments, while fractionation kits can enrich specific subcellular fractions [14] [34]. To prevent protein degradation, broad-spectrum protease inhibitor cocktails should be included during cell lysis, and for phosphorylated proteins, phosphatase inhibitors are essential [14]. For membrane proteins, high-temperature heating should be avoided as it can cause aggregation; instead, incubation at room temperature or 70°C is recommended [14].
Electrophoresis and transfer conditions significantly impact detection sensitivity. Increasing sample load to 50-100 μg per lane on SDS-polyacrylamide gels with 1.5 mm combs increases the amount of target protein [14]. PVDF membranes are preferred over nitrocellulose for their higher protein-binding capacity and reduced non-specific antibody binding, which improves the signal-to-noise ratio for low-abundance targets [14] [34]. Transfer efficiency should be verified using Ponceau red staining, particularly for high molecular weight proteins that may require extended transfer times [14].
Detection optimization includes using higher concentrations of primary antibodies with overnight incubation at 4°C and employing enhanced chemiluminescent substrates specifically designed for high sensitivity. These substrates, such as the SignalBright series, can detect femtogram levels of protein and provide a bright, stable signal for over 5 hours, facilitating optimal image capture [34].
Advanced Methodologies for Single-Molecule Sensitivity
For applications requiring ultimate sensitivity, several advanced methodologies have been developed that enable single-molecule detection of proteins and nucleic acids. Digital ELISA techniques, such as Simoa (Single Molecule Array), represent the current state-of-the-art in protein detection sensitivity, achieving detection limits below 1 fM [35]. These methods work by isolating individual protein molecules in femtoliter-sized wells along with enzyme-linked immunocomplexes, allowing detection of single enzyme-labeled molecules through fluorogenic or chromogenic substrates.
For nucleic acid detection, digital PCR provides absolute quantification of target nucleic acids without the need for standard curves, achieving a 0.1% variant allele frequency compared to 1% with conventional qPCR [35]. This technique involves partitioning samples into thousands of individual reactions, with each partition containing zero or one target molecule, followed by amplification and detection of positive partitions.
Bona fide single-molecule techniques such as SiMPull (Single Molecule Pull-Down) and SIMPlex (Single Molecule Interaction Pull-Down) enable direct visualization and quantification of individual protein molecules and their complexes without amplification steps, achieving sensitivity down to 1 pM [35]. These methods combine specific pull-down of target proteins with single-molecule fluorescence microscopy, providing unprecedented insights into protein complexes and interactions.
Comparison of Signal Amplification Techniques
The selection of an appropriate signal amplification method depends on multiple factors, including the abundance of the target, required sensitivity, available equipment, and experimental goals. The table below provides a comparative overview of major signal amplification techniques:
Table 1: Comparison of Signal Amplification Techniques for Low-Abundance Protein Detection
| Technique | Principle | Sensitivity Enhancement | Applications | Advantages | Limitations |
|---|---|---|---|---|---|
| Tyramide Signal Amplification (TSA) | HRP-catalyzed deposition of tyramide conjugates | Up to 100-fold vs. conventional IHC [31] | IHC, ICC, FISH, flow cytometry | High sensitivity, compatible with standard equipment, enables multiplexing | Optimization required, potential for high background if over-amplified |
| Enhanced Chemiluminescence | Optimized substrates for HRP-luminol reaction | Femtogram protein detection [34] | Western blotting | Extreme sensitivity, wide dynamic range | Limited to Western blot applications |
| Enzyme-Labeled Fluorescence (ELF) | Alkaline phosphatase substrates forming fluorescent precipitates | ~10-fold vs. standard fluorescence [29] | IHC, ICC, cell-based assays | Very bright signal, photostability | Limited multiplexing capability |
| Macrofluorophores | Multiple fluorophores on common scaffold | Varies with fluorophore number | Flow cytometry, imaging | Bright signals without enzymatic steps | Potential nonspecific binding |
| Digital ELISA (Simoa) | Single molecule detection in femtoliter wells | <1 fM sensitivity [35] | Protein quantification in biofluids | Extreme sensitivity, digital quantification | Specialized equipment required |
| Single Molecule Pull-Down (SiMPull) | Combination of pull-down with single molecule microscopy | 1 pM sensitivity [35] | Protein complex analysis, interactions | Single molecule resolution, quantitative | Technically challenging, specialized setup |
Essential Reagents and Tools for Signal Amplification
Successful implementation of signal amplification techniques requires specific reagents and tools optimized for these sensitive applications. The following table outlines key components for establishing TSA and related methodologies:
Table 2: Essential Research Reagent Solutions for Signal Amplification Experiments
| Reagent Category | Specific Examples | Function | Application Notes |
|---|---|---|---|
| Tyramide Reagents | Alexa Fluor tyramides (488, 546, 594, 647) [33] [31]; Cy3, Cy5 tyramides [33]; Biotin-XX tyramide [31] | Signal amplification substrate | Fluorophore selection should match available filter sets; biotinylated tyramide enables additional flexibility |
| Enzyme Conjugates | HRP-conjugated secondary antibodies [31]; HRP-conjugated streptavidin [33]; Zenon HRP Antibody Labeling Kits [31] | Target recognition with enzymatic activity | Anti-mouse, anti-rabbit most common; Zenon kits enable HRP labeling of primary antibodies |
| Amplification Buffers | TSA reaction buffer [31]; Hâ‚‚Oâ‚‚ reaction additive [31] | Optimal enzymatic activity | Fresh Hâ‚‚Oâ‚‚ critical for consistent results; commercial buffers ensure optimal pH and composition |
| Blocking Reagents | TSA blocking reagent [31]; Protein block sera; BSA-based blockers | Reduce nonspecific background | TSA-specific blockers minimize nonspecific tyramide deposition |
| Antibody Stripping Solutions | High-temperature buffer (HO-AR-98) [32]; Commercial stripping reagents [32] | Antibody removal for multiplexing | Temperature and pH critical for efficiency; HO-AR-98 preserves delicate tissues |
| Sensitive Detection Substrates | SignalBright ECL substrates [34]; Opal fluorophores [32] | Signal generation | ECL substrates vary in sensitivity and signal duration; opal fluorophores optimized for multiplex IHC |
Signal amplification techniques, particularly Tyramide Signal Amplification, have revolutionized the detection of low-abundance proteins in biomedical research. The exceptional sensitivity of TSA—up to 100-fold greater than conventional methods—enables researchers to visualize and quantify biologically important targets that were previously undetectable, from transcription factors and cell-surface receptors to rare biomarkers in pathological samples [31]. When combined with multiplexing approaches, TSA provides unprecedented insights into complex cellular environments and protein interactions within their native context.
The successful implementation of these techniques requires careful optimization of multiple parameters, including sample preparation, antibody concentrations, tyramide incubation times, and for multiplex applications, efficient antibody stripping protocols [32]. As research continues to push the boundaries of detection sensitivity, particularly in fields such as liquid biopsy and single-cell analysis, the integration of TSA with emerging technologies like digital detection methods and advanced imaging platforms will further expand our capability to explore the molecular intricacies of biological systems and disease processes.
Within the framework of immunostaining research for low-abundance protein targets, effective protein enrichment is a critical prerequisite for successful detection and analysis. The immense complexity of biological samples and the vast dynamic range of protein concentrations often obscure low-abundance targets, making their direct visualization challenging [36] [37]. This application note details three powerful enrichment methodologies—ProteoMiner, magnetic nanoparticles (MNPs), and immunoaffinity partitioning—providing detailed protocols and application data to guide researchers in selecting and implementing the optimal strategy for their specific research needs in drug development and diagnostic science.
The following table summarizes the core characteristics and performance metrics of the three featured enrichment technologies, aiding in the selection of an appropriate method.
Table 1: Comparison of Protein Enrichment Technologies
| Technology | Principle of Action | Best For | Typical Sample Input | Key Performance Metrics |
|---|---|---|---|---|
| ProteoMiner | Equalizes protein abundance via a vast library of hexapeptide ligands [38]. | Comprehensive proteome discovery; identifying "missing proteins" [38]. | 100 µL - 1 mL of serum/plasma or tissue extract [38]. | Identified 20 previously "missing" proteins from human tissues; effective enrichment of low-abundance and membrane/secreted proteins [38]. |
| Magnetic Nanoparticles (MNPs) | Surface-functionalized particles for affinity binding, separated magnetically [39] [40]. | Rapid purification from complex matrices (e.g., silkworm fat body, E. coli lysate) [39]. | 0.5 - 1 mL of cell lysate or clarified plasma [39] [36]. | ~77.7% reduction in host proteins; ~50.8% recovery of target protein; binding capacity of 83.3 µg/mg MNP [39]. |
| Immunoaffinity Partitioning | High-affinity antibodies immobilized on beads or tips capture specific antigens [36] [37]. | Ultra-specific target enrichment for validation; quantifying specific isoforms [36] [37]. | 0.5 mL plasma [36]. | Intra- and inter-assay CV < 15%; >1400 samples analyzed in <3 weeks; 10-fold lower LLOQ vs. bead-based methods [36] [37]. |
Detailed Experimental Protocols
Protocol: Protein Enrichment Using Magnetic Nanoparticles (e.g., Ni-NTA for His-Tagged Proteins)
This protocol is adapted for purifying His-tagged recombinant proteins from a complex silkworm fat body lysate using Ni-modified MNPs [39].
Materials:
- MNPs: Ni-shell magnetic nanoparticles (100-200 nm size, ~20 nm shell) [39].
- Lysis Buffer: Tris-HCl buffer (e.g., 50 mM, pH 8.0) containing protease inhibitors.
- Wash Buffer: Lysis buffer supplemented with 20-50 mM imidazole.
- Elution Buffer: Lysis buffer supplemented with 250-500 mM imidazole.
- Magnetic Separation Rack.
Procedure:
- MNP Preparation: Resuspend the Ni-MNPs by gentle vortexing.
- Binding: Add 1 mg of MNPs to 1 mL of clarified cell lysate. Incubate the mixture for 30-60 minutes at room temperature with gentle rotation.
- Magnetic Separation: Place the tube on a magnetic rack for 2-5 minutes until the solution clears. Carefully aspirate and discard the supernatant.
- Washing: Resuspend the bead pellet in 1 mL of Wash Buffer. Transfer the tube back to the magnetic rack, separate, and discard the supernatant. Repeat this wash step twice.
- Elution: Resuspend the MNPs in 100 µL of Elution Buffer. Incubate for 10-15 minutes with gentle agitation. Place the tube on the magnetic rack and transfer the eluate (containing the purified protein) to a new tube.
- MNP Regeneration (Optional): The MNPs can be washed with EDTA to remove nickel, then recharged with Ni(II) solution for reuse [39].
Protocol: Immunoaffinity Enrichment for Mass Spectrometry
This protocol describes an automated, high-throughput workflow for enriching low-abundance proteins (e.g., CETP, PCSK9) from plasma for downstream LC-MS analysis [36].
Materials:
- Immunoaffinity Beads: Dynabeads MyOne Tosylactivated coupled with target-specific monoclonal antibodies [36].
- RIPA Lysis Buffer: Contains detergent and protease inhibitors.
- Wash Buffers: RIPA buffer and PBS.
- Elution Solution: 10% formic acid in water.
- 96-Deep Well Plates and Automated Liquid Handler.
Procedure:
- Sample Clarification: Thaw plasma samples and centrifuge at 2,000g for 30 minutes at 4°C to remove debris [36].
- Antibody Binding: In a 96-deep well plate, mix 0.5 mL of clarified plasma with RIPA buffer and 0.6 mg each of anti-CETP and anti-PCSK9 beads. Incubate overnight at 4°C with rotation [36].
- Bead Washing: Using a magnetic rack, separate beads from the solution. Wash once with RIPA buffer and twice with PBS.
- Protein Elution: Incubate beads with 100 µL of 10% formic acid for 20 minutes to release bound proteins. Transfer the eluate to a new plate and dry completely in a SpeedVac [36].
- Digestion: Reconstitute dried proteins in ammonium bicarbonate buffer, reduce with DTT, alkylate with iodoacetamide, and digest with trypsin overnight at 37°C [36].
- LC-MS Analysis: Acidify samples with formic acid and analyze by microflow LC-MS/MS [36].
Workflow Visualization
The following diagram illustrates the logical workflow for selecting an appropriate protein enrichment method based on research goals.
The Scientist's Toolkit: Essential Research Reagents
Successful implementation of these enrichment strategies requires key reagents and materials, as cataloged below.
Table 2: Essential Research Reagents for Protein Enrichment
| Reagent / Material | Function / Principle | Application Notes |
|---|---|---|
| ProteoMiner Kit | Comprehensive enrichment via a diverse hexapeptide library to equalize high- and low-abundance proteins [38]. | Ideal as a first-pass pretreatment for samples like plasma or tissue extracts to dig deeper into the proteome [38]. |
| Ni-Modified MNPs | Affinity purification of His-tagged proteins; nickel shell coordinates with the histidine tag [39]. | Optimal size: 100-200 nm with ~20 nm Ni shell. Ensure compatibility with lysis buffer; imidazole is used for competitive elution [39]. |
| Tosylactivated Magnetic Beads | Universal solid support for covalent coupling of antibodies for immunoaffinity applications [36]. | Follow manufacturer's protocol for antibody coupling. Pre-washing with acidic glycine buffer can increase recovery [36]. |
| High-Affinity Nanobodies | Ultra-high affinity binders (e.g., GFP-Trap with KD ~1 pM) for efficient pulldown of low-abundance targets [41]. | Critical for low-abundance targets. According to binding equations, target concentration should exceed the KD of the binder for effective capture [41]. |
| PAMAM Dendrimers | Dendritic polymers with abundant amine groups for functionalizing MNPs; bind phosphopeptides via electrostatic/hydrogen bonding [42]. | Used in MNP synthesis for enriching phosphoproteins/peptides (e.g., phosvitin phosphopeptides). Low toxicity and cost-effective [42]. |
| 13-Deacetyltaxachitriene A | 13-Deacetyltaxachitriene A, MF:C32H44O13, MW:636.7 g/mol | Chemical Reagent |
| Anemarrhenasaponin A2 | Anemarrhenasaponin A2, MF:C39H64O14, MW:756.9 g/mol | Chemical Reagent |
The selection of a protein enrichment method is a pivotal decision that directly influences the success of subsequent immunostaining and analytical techniques. ProteoMiner offers a powerful broad-spectrum discovery tool, magnetic nanoparticles provide rapid and efficient purification from challenging matrices, and immunoaffinity partitioning delivers unmatched specificity for target validation and quantification. By applying these detailed protocols and leveraging the appropriate toolkit, researchers can significantly enhance the detection and analysis of low-abundance protein targets, thereby accelerating progress in biomedical research and therapeutic development.
The success of immunostaining experiments for low-abundance protein targets critically depends on the choice of detection modality. Proteins present at concentrations of 100 molecules per cell or less pose a significant technical challenge, as conventional staining techniques typically only detect molecules present at around 2000 molecules per cell [43]. This application note provides a structured comparison between high-sensitivity fluorophores and enzymatic detection methods, offering detailed protocols and analytical frameworks to guide researchers and drug development professionals in optimizing their experimental designs for maximal sensitivity, specificity, and reproducibility in low-abundance target detection.
Technical Comparison of Detection Modalities
The table below summarizes the key characteristics of high-sensitivity fluorophores and enzymatic detection methods for visualizing low-abundance protein targets.
Table 1: Comparison of Detection Modalities for Low-Abundance Proteins
| Feature | High-Sensitivity Fluorophores | Enzymatic Detection |
|---|---|---|
| Fundamental Principle | Direct photon emission upon light excitation [44] | Enzyme-catalyzed chromogenic precipitate formation [45] |
| Key Advantage | Superior sensitivity for low-abundance targets [43] | Signal amplification via enzymatic deposition [45] |
| Multiplexing Capability | High (simultaneous detection of multiple targets) [43] [44] | Low (typically single-plex) |
| Spatial Resolution | Excellent (subcellular localization) | Good (can be limited by precipitate diffusion) |
| Quantification | Highly quantitative with appropriate controls | Semi-quantitative |
| Typical Assay Time | Faster (direct signal) | Slower (requires incubation for development) |
| Sample Compatibility | FFPE, frozen sections, cells [44] | FFPE, frozen sections, cells |
| Primary Best Use Case | Detecting targets < 100 molecules/cell; multiplexed experiments [43] | Single-target detection where extreme sensitivity is not critical |
Experimental Protocols
Protocol for High-Sensitivity Fluorescence Detection
This protocol is optimized for detecting low-abundance membrane markers (e.g., <100 molecules per cell) using a three-layer amplification process with phycoerythrin (PE) or other high-brightness fluorophores [43].
Workflow Overview:
Materials and Reagents:
- Primary Antibody: Validated for immunostaining and specific for the low-abundance target.
- Biotinylated Secondary Antibody: Species-specific, cross-adsorbed to minimize cross-reactivity.
- Fluorophore-Conjugated Streptavidin: e.g., Phycoerythrin (PE), or bright, photostable dyes such as iFluor 647 [44].
- Blocking Buffer: 5% BSA or normal serum in PBS.
- Antigen Retrieval Buffer: Citrate buffer (pH 6.0) or EDTA buffer (pH 9.0) [44].
- Antifade Mounting Medium: Containing DABCO or similar antifade agent [44].
Step-by-Step Procedure:
- Sample Preparation: Perform antigen retrieval on FFPE sections using a heated citrate or EDTA buffer (pH 6.0 or 9.0) for 20 minutes to unmask epitopes. Cool slides to room temperature [44].
- Blocking: Incubate sections with a blocking buffer for 1 hour at room temperature to minimize non-specific binding.
- Primary Antibody Incubation: Apply the optimized concentration of primary antibody (typically 30-50% lower than in single-plex staining) diluted in blocking buffer. Incubate overnight at 4°C in a humidified chamber [44].
- Washing: Wash the slides three times for 5 minutes each with PBS-T (PBS with 0.025% Triton X-100).
- Secondary Antibody Incubation: Apply biotinylated secondary antibody at the predetermined optimal dilution in blocking buffer. Incubate for 1 hour at room temperature.
- Washing: Repeat the washing procedure as in Step 4.
- Tertiary Amplification: Incubate with fluorophore-conjugated streptavidin (e.g., PE) for 1 hour at room temperature, protected from light [43].
- Final Wash and Mounting: Perform a final wash. Apply an antifade mounting medium containing DAPI for nuclear counterstaining and coverslip [44].
- Image Acquisition: Image slides using a fluorescence microscope equipped with appropriate excitation/emission filters. For low-abundance targets, use a high-sensitivity camera (e.g., EM-CCD or sCMOS). Minimize light exposure to prevent photobleaching.
Protocol for High-Sensitivity Enzymatic Detection (TLip-LISA)
This protocol details a Temperature-responsive Liposome-Linked Immunosorbent Assay (TLip-LISA), an advanced enzymatic method capable of ultra-sensitive biomarker detection, achieving limits of detection for PSA as low as 0.97 aM [45].
Workflow Overview:
Materials and Reagents:
- Capture Antibody: Specific for the target protein.
- Biotinylated Detection Antibody: Specific for a different epitope on the target protein.
- Temperature-Responsive Liposomes (Biotin-TLip): Composed of DPPC lipids and incorporating a squaraine dye (SQR22) and biotinylated lipids [45].
- Streptavidin: To bridge the biotinylated detection antibody and the biotinylated liposomes.
- Microplate Reader: Equipped with a temperature control unit and a fluorescence detector.
Step-by-Step Procedure:
- Plate Coating: Immobilize the capture antibody on the surface of a microwell plate by incubating in coating buffer overnight at 4°C.
- Blocking: Block the plate with a suitable blocking agent (e.g., 1% BSA in PBS) for 1-2 hours to prevent non-specific binding.
- Antigen Incubation: Add the sample or antigen standard to the wells and incubate for 2 hours to allow the target protein to be captured.
- Detection Antibody Incubation: After washing, add the biotinylated detection antibody and incubate for 1-2 hours, forming a sandwich complex.
- Signal Amplification Incubation: Add streptavidin, followed by biotin-TLip. The liposomes, loaded with thousands of SQR22 dye molecules, act as signal amplifiers [45].
- Washing: Wash thoroughly to remove any unbound liposomes.
- Signal Detection: Heat the plate on a hot plate while monitoring fluorescence. The bound liposomes will undergo a phase transition at their critical temperature (~41-45°C), causing a rapid and intense increase in fluorescence as the SQR22 dye molecules de-quench and emit light. The time point of the fluorescence inflection is used for quantification [45].
The Scientist's Toolkit: Research Reagent Solutions
Table 2: Essential Reagents for High-Sensitivity Immunodetection
| Reagent / Material | Function | Key Considerations for Low-Abundance Targets |
|---|---|---|
| Combinatorial Peptide Ligand Libraries (CPLL) | Enriches low-abundance proteins from complex samples by reducing dynamic concentration range [9]. | Critical for pre-analytical concentration of targets from biological fluids where high-abundance proteins dominate. |
| Phycoerythrin (PE) | Fluorophore with high brightness due to large extinction coefficient [43]. | Ideal for 3-layer amplification protocols; superior for targets <100 molecules/cell [43]. |
| iFluor & DyLight Dyes | Synthetic fluorophores offering high brightness and photostability [44]. | Recommended for low-abundance targets in multiplex IHC; more stable than FITC [44]. |
| Temperature-Responsive Liposomes | Nanocarriers for fluorescent dye encapsulation in enzymatic assays [45]. | Enable extreme sensitivity (aM range) via signal amplification from thousands of dyes per liposome [45]. |
| Antifade Mounting Medium | Preserves fluorescence signal during storage and imaging [44]. | Essential for preventing signal loss from photobleaching, especially with weak signals. |
| Cross-Adsorbed Secondary Antibodies | Secondary antibodies purified to minimize cross-species reactivity. | Critical for multiplex IHC to prevent off-target binding and high background [44]. |
| Eriodictyol 7-O-glucuronide | Eriodictyol 7-O-glucuronide, MF:C21H20O12, MW:464.4 g/mol | Chemical Reagent |
| 2-Deacetyltaxachitriene A | 2-Deacetyltaxachitriene A, MF:C30H42O12, MW:594.6 g/mol | Chemical Reagent |
Strategic Guidance for Method Selection
Choosing between fluorescence and enzymatic detection depends on several experimental factors. For the most challenging low-abundance targets (≤100 molecules/cell), high-sensitivity fluorescence is generally the preferred choice, especially when using amplification strategies and bright, photostable fluorophores [43]. Its strengths are most evident in multiplexed experiments where spatial co-localization data is required [44]. In these cases, careful fluorophore selection with minimal spectral overlap is critical.
Advanced enzymatic methods, particularly those incorporating nanotechnologies like TLip-LISA, are capable of attaining exceptional sensitivity for single-plex assays in plate-based formats and are ideal for quantifying biomarkers in solution at ultra-low concentrations [45].
For optimal results in any modality, pairing your detection method with a sample preparation technique designed to enrich for low-abundance targets, such as Combinatorial Peptide Ligand Libraries (CPLLs), can dramatically improve outcomes by compressing the dynamic range of protein concentrations in your sample [9].
Multiplexing Strategies for Co-localization Studies of Low Abundance Proteins
The accurate detection and spatial localization of low-abundance proteins represent a significant challenge in biomedical research, particularly in the era of immunotherapy and precision oncology. Conventional immunohistochemistry (IHC) is limited by its single-marker per tissue section approach, resulting in missed opportunities to gain critical prognostic and diagnostic information from valuable patient samples [46]. The need to better understand the immune response to cancer has driven the development of multiplex immunohistochemistry/immunofluorescence (mIHC/IF) technologies that can simultaneously detect multiple markers on a single tissue section [47] [46]. These technologies enable comprehensive studies of cell composition, functional states, and cell-cell interactions within the tumor microenvironment (TME), providing insights that are particularly valuable for clinical decision-making in cancer immunotherapy [47] [46]. For low-abundance proteins, the technical challenges are amplified, requiring specialized approaches that combine ultrasensitive detection with high multiplexing capabilities while preserving crucial spatial information that is essential for understanding protein co-localization and cellular interactions [48] [49].
Technology Platforms for Multiplexed Protein Detection
Multiple technology platforms have emerged to address the challenges of detecting low-abundance proteins in multiplexed formats, each with distinct advantages, limitations, and optimal applications.
Comparison of Multiplexing Platforms
Table 1: Comparison of Major Multiplexed Protein Detection Technologies
| Technology | Multiplex Capacity | Sensitivity | Spatial Context | Key Applications | Primary Limitations |
|---|---|---|---|---|---|
| Multiplexed IF | 5-8 markers (TSA-based); 30-60 (non-TSA) | Moderate | Preserved | Tumor microenvironment characterization, immune cell profiling | Spectral overlap, photobleaching [47] [50] |
| Mass Spectrometry Imaging | 40+ markers | High for abundant proteins | Preserved | Untargeted biomarker discovery, spatial distribution analysis | Limited sensitivity for low-abundance proteins, matrix effects [51] |
| Digital Spatial Profiling | 30+ markers | High | Preserved with ROI selection | Pre-defined ROI analysis, translational research | Antibody dependency, region of interest limitation [47] [51] |
| Imaging Mass Cytometry | 40+ markers | High | Preserved | High-plex tissue analysis, signaling studies | Complex equipment, high cost [51] [46] |
| MOSAIC | 8+ targets | Attomolar | Not preserved | Ultrasensitive cytokine/serum biomarker detection | Loss of tissue architecture [49] |
| Immuno-MRM | 40+ targets | Low nanogram/milliliter | Not preserved | Verification of candidate biomarkers, clinical correlation studies | Requires tissue digestion, no spatial information [52] [48] |
Technology Selection Guidelines
Choosing the appropriate multiplexing technology depends on several factors, including the abundance of target proteins, required multiplexing capacity, need for spatial information, and available sample quantity. For low-abundance proteins where spatial context is critical, tyramide-based signal amplification provides enhanced sensitivity while maintaining spatial resolution [47] [46]. When spatial information is less critical but maximum sensitivity is required for circulating biomarkers, solution-based digital platforms like MOSAIC offer attomolar sensitivity [49]. For verification studies of candidate biomarkers discovered through unbiased approaches, immuno-MRM platforms provide specific, multiplexed quantification in plasma and tissue matrices [52] [48].
Experimental Design and Workflow Considerations
Sample Preparation and Validation
Proper sample preparation is fundamental to successful multiplexed detection of low-abundance proteins. Formalin-fixed, paraffin-embedded (FFPE) tissues represent the most common sample type for spatial multiplexing approaches, while frozen tissues and biological fluids (plasma, serum) are suitable for non-spatial multiplexed assays [51] [48]. For FFPE tissues, antigen retrieval optimization is particularly critical for low-abundance targets, as epitope masking can significantly impact detection sensitivity [47]. Validation of individual antibody specificity should be performed using appropriate controls, including knockout cells, isotype controls, and comparison with orthogonal methods when possible [47] [48].
For mass spectrometry-based approaches, protein extraction efficiency must be optimized, particularly for membrane-associated or nuclear proteins that may be underrepresented in standard extraction protocols [52] [48]. In immuno-MRM assays, the selection of proteotypic peptides that uniquely represent the target protein and exhibit favorable mass spectrometry properties is crucial for assay performance [52] [48].
Image Acquisition and Analysis
For spatial multiplexing approaches, image acquisition parameters must be optimized to balance sensitivity, resolution, and throughput. Whole-slide imaging reduces selection bias and is valuable when marker or tissue heterogeneity is high, while region of interest (ROI) selection provides faster acquisition and reduced data storage requirements [47]. Previous studies have generally sampled a minimum of five high-power fields (ranging from 0.33-0.64 mm² each), with some studies deliberately sampling regions based on morphological features or immune cell densities [47].
Color deconvolution (for chromogenic mIHC) and spectral unmixing (for mIF) are essential preprocessing steps for accurate assignment of marker expression [47]. These processes separate the contributions of individual stains or fluorophores, resulting in separate channels for each marker that can be quantitatively analyzed [47]. Subsequent analysis typically includes tissue segmentation (identifying relevant tissue compartments), cell segmentation (identifying individual cells), and phenotyping (assigning cell types based on marker expression) [47].
Table 2: Key Reagent Solutions for Multiplexed Detection of Low-Abundance Proteins
| Reagent Category | Specific Examples | Function | Considerations for Low-Abundance Targets |
|---|---|---|---|
| Signal Amplification Systems | Tyramide Signal Amplification (TSA) | Enzyme-mediated deposition of fluorescent tyramide | Enhances sensitivity for low-abundance targets; requires optimization to prevent over-amplification [47] [46] |
| Antibody Conjugates | DNA-barcoded antibodies (CODEX, DSP) | Oligonucleotide-conjugated antibodies for sequential detection | Enables high-plex imaging; reduces spectral overlap issues [51] [46] |
| Metal-labeled Antibodies | Imaging Mass Cytometry (IMC) | Elemental mass tag-conjugated antibodies | Enables high-plex with minimal background; requires specialized instrumentation [51] [46] |
| Isotope-labeled Standards | Heavy isotope-coded peptides (hipMHC) | Internal standards for mass spectrometry quantification | Enables absolute quantification; corrects for sample processing losses [53] |
| Digital Detection Reagents | Rolling circle amplification (RCA) reagents | DNA concatemer formation for single molecule detection | Enables attomolar sensitivity in MOSAIC platform [49] |
Detailed Protocols
Protocol 1: Multiplex Immunofluorescence with Tyramide Signal Amplification
This protocol describes a standardized approach for multiplexed immunofluorescence using tyramide-based signal amplification, optimized for detection of low-abundance protein targets in FFPE tissue sections [47] [46].
Materials and Reagents
- FFPE tissue sections (4-5 μm thickness)
- Primary antibodies validated for multiplex IHC/IF
- Tyramide Signal Amplification (TSA) kits with appropriate fluorophores
- Automated staining platform (e.g., DISCOVERY ULTRA, Vectra) or manual staining equipment
- Antigen retrieval buffers (citrate-based or EDTA-based)
- Blocking buffer (serum-free protein block recommended)
- Mounting medium with anti-fade agents
- Antibody stripping solution (e.g., glycine-HCl, pH 2.0)
Staining Procedure
- Deparaffinization and Antigen Retrieval: Bake slides at 60°C for 30 minutes, followed by deparaffinization in xylene and graded ethanol series. Perform heat-induced epitope retrieval using appropriate buffer (citrate pH 6.0 or EDTA pH 9.0) in a pressure cooker or steamer for 15-20 minutes.
- Peroxidase Blocking: Incubate slides with 3% hydrogen peroxide for 10 minutes to quench endogenous peroxidase activity.
- Protein Blocking: Apply serum-free protein block for 30 minutes at room temperature to reduce non-specific binding.
- Primary Antibody Incubation: Apply first primary antibody at optimized dilution and incubate for 1 hour at room temperature or overnight at 4°C.
- HRP-Conjugated Secondary Antibody: Apply species-appropriate HRP-conjugated secondary antibody for 30 minutes at room temperature.
- Tyramide Amplification: Apply fluorophore-conjugated tyramide reagent at recommended dilution for 5-10 minutes.
- Antibody Stripping: For sequential staining cycles, perform heat-mediated or chemical stripping to remove primary-secondary antibody complexes (e.g., heating in retrieval buffer at 95°C for 20 minutes or incubation in glycine-HCl, pH 2.0, for 10 minutes).
- Repeat Staining Cycle: Return to step 4 with the next primary antibody, repeating the process for each marker in the panel.
- Counterstaining and Mounting: Apply DAPI counterstain (0.5 μg/mL for 5 minutes) and mount with anti-fade mounting medium.
Critical Steps and Optimization
- Antibody Order: Stain from lowest to highest abundance antigens to prevent signal reduction due to repeated stripping cycles.
- TSA Incubation Time: Optimize for each antibody to balance sensitivity and background (typically 2-10 minutes).
- Validation: Include single-stain controls for each antibody to verify specificity and check for bleed-through between channels.
Protocol 2: Immuno-Multiple Reaction Monitoring (Immuno-MRM) for Low-Abundance Proteins
This protocol describes a multiplexed, mass spectrometry-based approach for quantifying low-abundance proteins in tissue and plasma specimens, achieving limits of quantitation in the 1-10 ng/mL range [52] [48].
Materials and Reagents
- Frozen tissue specimens or plasma/serum samples
- Monoclonal antibodies for immunoaffinity enrichment
- Stable isotope-labeled (heavy) peptide standards
- Protein extraction reagents (urea, Tris, CHAPS detergent)
- Reduction and alkylation reagents (TCEP, iodoacetamide)
- Trypsin or Lys-C proteases (sequencing grade)
- Strong cation exchange (SCX) chromatography materials
- LC-MS/MS system with triple quadrupole mass spectrometer
- Immunoaffinity purification materials (protein G magnetic beads)
Sample Processing and Analysis Procedure
- Protein Extraction: Homogenize frozen tissue specimens in urea-based extraction buffer (6 M urea, 10 mM Tris, pH 8.0) or process plasma/serum samples with appropriate dilution.
- Protein Quantification: Determine protein concentration using BCA or similar assay.
- Reduction and Alkylation: Reduce proteins with 20 mM TCEP at 37°C for 30 minutes, then alkylate with 50 mM iodoacetamide at room temperature for 30 minutes in the dark.
- Digestion: Dilute urea concentration to 1 M with ammonium bicarbonate and digest with trypsin (1:50 enzyme:substrate ratio) overnight at 37°C.
- Peptide Cleanup: Desalt peptides using reverse-phase C18 cartridges.
- Immunoaffinity Enrichment: Incubate peptide digests with antibody-bead complexes (5 μg antibody:1 μL bead slurry) for 2 hours at room temperature with gentle mixing.
- Peptide Elution: Elute bound peptides with 0.1% trifluoroacetic acid.
- Strong Cation Exchange (SCX) Chromatography: Fractionate peptides using SCX chromatography to reduce sample complexity.
- LC-MRM/MS Analysis: Analyze fractions by liquid chromatography coupled to multiple reaction monitoring mass spectrometry.
- Data Analysis: Process MRM data using Skyline software, quantifying target proteins by comparing signals from endogenous and heavy isotope-labeled peptides.
Critical Steps and Optimization
- Signature Peptide Selection: Choose proteotypic peptides that are unique to the target protein, have favorable ionization characteristics, and are not prone to chemical modifications.
- Antibody Validation: Confirm antibody specificity for the target peptide using knockout controls or synthetic peptide competitors.
- Quality Controls: Include quality control samples with known concentrations to monitor assay performance across runs.
Workflow Visualization
Diagram 1: Multiplexed Tissue Imaging Workflow. The process involves sequential experimental phases followed by computational analysis and biological interpretation.
Diagram 2: Evolution of Sensitivity in Multiplexed Protein Detection Technologies. Parallel advancements have occurred in both solution-based and tissue-based detection platforms.
Applications in Immunotherapy Research
Multiplexed protein detection strategies have proven particularly valuable in immuno-oncology research, where understanding the complex interactions within the tumor microenvironment is essential for predicting treatment response and understanding resistance mechanisms. A meta-analysis comparing mIF/IHC assays to PD-L1 IHC, interferon-gamma-related gene signatures, and mutational density for predicting response to anti-PD-(L)1 therapies showed that mIF/IHC assays had superior predictive value, with area under the curve (AUC) on the order of 0.8 compared to 0.65-0.7 for other modalities [47]. Several specific multiplexed biomarkers have demonstrated clinical relevance, including the proportion of intratumoral CD8+CD39+ cells in various cancers, the density of CD8+FoxP3+ T cells in non-small cell lung carcinoma, and combinatorial biomarkers incorporating multiple immune cell populations in advanced melanoma [47].
For low-abundance proteins specifically, the ability to simultaneously measure multiple immunomodulatory proteins has enabled comprehensive profiling of the "cancer-immunity cycle" [48]. This approach has been applied to both tissue and plasma biospecimens from immunotherapy clinical trials, revealing potential biomarkers of response and immune-related adverse events [48]. The development of validated assays for quantifying these low-abundance immunomodulatory proteins supports correlative studies in clinical trials and may ultimately contribute to improved patient selection for immunotherapy.
Multiplexing strategies for co-localization studies of low-abundance proteins have evolved significantly, enabling researchers to address increasingly complex biological questions in tumor immunology and therapeutic development. The choice of appropriate technology depends on the specific research objectives, with spatial multiplexing approaches providing critical contextual information within tissue architecture, and solution-based ultrasensitive platforms offering maximum detection sensitivity for circulating biomarkers. As these technologies continue to mature and become more accessible, they are poised to transform both basic research and clinical practice, particularly in the era of cancer immunotherapy. Future directions will likely include increased integration of multiplexed protein detection with genomic and transcriptomic analyses, further improvements in sensitivity and multiplexing capacity, and enhanced computational tools for extracting biologically meaningful insights from these rich multidimensional datasets.
Solving Common Problems: A Troubleshooting Guide for High Background and Weak Signal
Diagnosing and Eliminating High Background Staining
High background staining represents one of the most frequent challenges in immunohistochemistry (IHC), particularly when detecting low abundance protein targets. This nonspecific signal can obscure critical biological information, compromise data interpretation, and ultimately hinder research reproducibility. For scientists investigating sparse protein targets, where signal-to-noise ratio is paramount, effectively managing background becomes essential for generating reliable and meaningful data. This application note provides a structured framework for diagnosing the sources of high background in immunostaining experiments and presents detailed protocols for its elimination, with special consideration for the unique demands of low abundance target research.
Diagnosing the Source of High Background
Accurate diagnosis is the critical first step in troubleshooting. The table below categorizes common types of high background, their visual characteristics, and their most probable causes to guide your initial investigation.
Table 1: Diagnostic Guide to Common High Background Staining Patterns
| Staining Pattern | Visual Characteristics | Most Probable Causes |
|---|---|---|
| Diffuse, Even Background | A uniform, light staining across the entire tissue section [54]. | - Excessive primary antibody concentration [55] [56].- Insufficient blocking [55] [57].- Inadequate washing [57] [54]. |
| Specific Structural Staining | Staining of distinct, off-target tissue structures (e.g., connective tissue, specific organelles) [58]. | - Antibody cross-reactivity with unrelated epitopes [59].- Non-specific antibody binding [57]. |
| High Edge Staining | Pronounced staining at the very edges of the tissue section [55]. | - Tissue sections drying out during the staining procedure [55] [56]. |
| Endogenous Enzyme Activity | Background present in negative controls that omit the primary antibody [59]. | - Inadequate blocking of endogenous peroxidases (e.g., in liver, spleen) or phosphatases [55] [59].- Endogenous biotin (e.g., in liver, kidney, brain) [59]. |
| Autofluorescence | A uniform signal across all channels in fluorescent detection, even in unstained samples [58]. | - Aldehyde-based fixation [58].- Presence of intrinsic tissue components like lipofuscin, collagen, or elastin [58] [56]. |
To systematically determine the source of background, a series of controlled experiments is recommended. The following workflow diagram outlines a logical diagnostic pathway.
Detailed Experimental Protocols for Background Elimination
Protocol 1: Optimization of Blocking and Antibody Incubation
This protocol addresses the most common sources of background: non-specific antibody binding and insufficient blocking [55] [57].
Materials:
- Blocking reagent: Normal serum from the species of the secondary antibody, or Bovine Serum Albumin (BSA) [55] [57].
- Antibody diluent: PBS or TBS, preferably with 0.05% Tween-20 and a carrier protein (e.g., 1% BSA) [56].
- Wash buffer: PBS or TBS, with 0.05% Tween-20 [57].
Method:
- Deparaffinization and Antigen Retrieval: Perform standard deparaffinization and antigen retrieval steps suitable for your target and tissue.
- Peroxidase Blocking (for HRP systems): Incubate sections with 3% Hâ‚‚Oâ‚‚ in methanol or water for 10-15 minutes at room temperature to quench endogenous peroxidase activity [59] [54].
- Serum Blocking: Tap off excess liquid and apply an appropriate blocking solution. For 10% normal serum, incubate for 1 hour at room temperature in a humidified chamber [55]. For BSA, a 1-5% solution for 30 minutes may be sufficient [54].
- *Primary Antibody Incubation:
- Preparation: Dilute the primary antibody in an appropriate diluent. *For low abundance targets, a higher concentration may be tempting, but this often increases background. Titration is essential.
- Incubation: Apply the diluted primary antibody. Incubate at 4°C overnight in a humidified chamber to enhance specific binding and reduce non-specific attachment [54].
- Washing: Wash sections 3-5 times for 5 minutes each with gentle agitation in wash buffer. Inadequate washing is a major cause of high background [57].
- Secondary Antibody Incubation:
- Preparation: Dilute the enzyme- or fluorophore-conjugated secondary antibody in diluent. Using a secondary antibody that has been pre-adsorbed against the immunoglobulin of the sample species can dramatically reduce non-specific staining [55] [58].
- Incubation: Apply the secondary antibody and incubate for 30-60 minutes at room temperature in a humidified chamber.
- Washing: Repeat the washing procedure as in Step 5.
- Signal Detection and Counterstaining: Proceed with standard chromogenic or fluorescent detection and counterstaining protocols.
Protocol 2: Elimination of Endogenous Enzyme and Biotin Activity
This protocol is crucial when using enzyme-based detection systems (e.g., HRP/DAB) or avidin-biotin complexes (ABC), and is particularly important for tissues with high endogenous levels like liver, kidney, and spleen [59].
Materials:
- Hydrogen Peroxide (Hâ‚‚Oâ‚‚), 3% solution.
- Levamisole (2 mM) for Alkaline Phosphatase (AP) systems [55].
- Avidin/Biotin Blocking Kit (commercially available).
Method (to be performed after deparaffinization and antigen retrieval):
- Endogenous Peroxidase Blocking: Incubate slides with 3% Hâ‚‚Oâ‚‚ in methanol for 15 minutes at room temperature [59]. Rinse gently with distilled water, followed by a wash in PBS or TBS.
- Endogenous Biotin Blocking (for ABC methods):
- Apply an avidin solution from a commercial blocking kit for 15 minutes. Wash thoroughly with buffer.
- Apply a biotin solution from the same kit for 15 minutes. Wash thoroughly with buffer [59].
- Note: Using streptavidin or NeutrAvidin instead of avidin can also help, as they are not glycosylated and thus do not bind to endogenous lectins [59].
- Endogenous Phosphatase Blocking (for AP systems): Add 2 mM levamisole to the substrate solution just before use [55].
Protocol 3: Advanced Method for Species-on-Species Staining
A significant challenge arises when the primary antibody host species matches the tissue species (e.g., a mouse monoclonal antibody on mouse tissue). Standard blocking is often insufficient, leading to high background from the secondary antibody binding to endogenous immunoglobulins [60]. The following method uses heat to denature and inactivate these interfering immunoglobulins.
Materials:
- Phosphate-Buffered Saline (PBS), pH 7.4.
- Humidified chamber.
- Hot plate and glass beaker.
Method:
- Section Preparation: Air-dry unfixed cryostat sections for at least 30 minutes at room temperature [60].
- Heat Treatment: Fill a glass beaker with PBS and heat until it is boiling vigorously. Submerge a single slide in the boiling PBS for 1 to 5 minutes. The optimal time should be determined empirically [60].
- Cooling and Washing: Remove the slide and briefly rinse it in PBS at room temperature. For some sensitive antigens, a subsequent wash in 1% Triton X-100 for 15 minutes may help restore immunoreactivity [60].
- Immunostaining: Proceed with the standard immunostaining protocol, beginning with the blocking step.
Special Considerations for Low Abundance Protein Targets
Research on low abundance proteins pushes the limits of IHC sensitivity, necessitating a careful balance between signal amplification and background suppression. Traditional semiquantitative scoring systems can be prone to variability, and background can disproportionately affect simpler digital analysis methods like the positive pixel count [61]. Artificial intelligence (AI)-driven cellular density quantitation has shown promise as a more robust method for identifying sparse pathology in the presence of inconsistent background [61]. When quantifying low abundance targets, it is critical to apply consistent image processing thresholds, as manipulations to reduce background can also remove legitimate weak signal, leading to erroneous conclusions [62].
Table 2: Research Reagent Solutions for Background Suppression
| Reagent / Kit | Function / Purpose | Application Context |
|---|---|---|
| Normal Serum | Blocks non-specific binding sites on tissue with inert proteins. | General purpose blocking; should be from the same species as the secondary antibody [55]. |
| Pre-adsorbed Secondary Antibody | Secondary antibody purified to remove antibodies that cross-react with immunoglobulins of other species. | Critical for reducing non-specific signal, especially in complex tissues or species-on-species staining [55] [58]. |
| Avidin/Biotin Blocking Kit | Sequesters endogenous biotin and avidin/lectin binding sites. | Essential when using ABC detection systems, particularly for tissues rich in endogenous biotin (e.g., liver, kidney) [59]. |
| Hydrogen Peroxide (Hâ‚‚Oâ‚‚) | Chemical inhibitor of endogenous peroxidase enzymes. | Used in HRP-based detection systems to prevent false-positive signal [55] [54]. |
| TrueVIEW Autofluorescence Quenching Kit / Sudan Black B | Reduces tissue autofluorescence by binding to and quenching fluorescent compounds. | Used in immunofluorescence on fixed tissues or tissues with inherent autofluorescence (e.g., from lipofuscin) [58] [56]. |
| M.O.M. (Mouse on Mouse) Blocking Reagent | Specialized blocking kit for using mouse monoclonal antibodies on mouse tissue. | Essential for effectively blocking endogenous mouse Ig when performing species-on-species staining with mouse primaries [58]. |
Effectively diagnosing and eliminating high background staining is a systematic process that requires careful attention to experimental design and protocol optimization. By leveraging the diagnostic guides, detailed protocols, and specialized reagents outlined in this application note, researchers can significantly improve the signal-to-noise ratio in their immunostaining experiments. This is especially critical for the accurate detection and quantification of low abundance protein targets, where clarity and specificity are fundamental to generating reliable and reproducible data that advances scientific discovery and drug development.
Optimizing Antibody Concentration and Incubation Conditions via Titration
The detection of low-abundance proteins via immunostaining techniques presents a significant challenge in biomedical research and drug development. The reliability of these assays is critically dependent on antibody binding efficiency, which is directly influenced by antibody concentration and incubation conditions. For rare, expensive, or low-titer antibody stocks, optimizing these parameters is not merely a matter of protocol refinement but a necessity for achieving specific detection while conserving precious reagents. This application note provides detailed methodologies for antibody titration, supported by quantitative data, to establish robust and reproducible immunostaining assays for challenging targets.
The Critical Role of Antibody Titration
Antibody titration is a fundamental optimization process used to determine the concentration that provides the best possible signal-to-noise ratio. Using an antibody at an incorrect concentration can lead to false negatives, high background, and inconclusive data. An excess of antibody often increases non-specific binding and background signal, whereas insufficient antibody results in a weak or absent specific signal, compromising the assay's resolution and consistency [63]. For low-abundance targets, this optimization is paramount, as the margin for error is small. A properly titrated antibody ensures that the assay is robust, reproducible, and efficient in its use of reagents, which is particularly crucial for high-cost antibodies or large-scale screening in drug development [64].
Experimental Protocols for Antibody Titration
General Titration Protocol for Immunofluorescence and Western Blot
This protocol is adapted from established flow cytometry and immunofluorescence practices and can be applied to various immunostaining methods, including Western blot and immunofluorescence [63] [65].
Materials:
- Primary antibody of interest
- Relevant positive control cell line or tissue sample (known to express the target protein)
- Standard immunostaining reagents: fixation buffer, permeabilization buffer (for intracellular targets), blocking buffer, fluorescently-labeled or enzyme-conjugated secondary antibody, and detection reagents.
- Microscope slides or Western blot membranes with immobilized target.
Method:
- Preparation of Antibody Dilutions: Reconstitute or dilute the antibody stock as per the manufacturer's instructions. Prepare a series of at least six, two-fold serial dilutions in the antibody dilution buffer (e.g., blocking buffer). A suggested starting point for a purified antibody is 5 µg/mL, or follow the manufacturer's recommendation [63].
- Sample Staining:
- For cell-based assays (IF/Flow Cytometry): Aliquot a fixed number of positive control cells (e.g., 0.5-1 million per tube) for each dilution and an unstained control.
- For Western Blot: Load a set of replicate gels or membrane strips with a positive control lysate.
- Incubation: Apply the different antibody dilutions to the respective samples. Incubate under the standard conditions for your assay (e.g., 1 hour at room temperature or overnight at 4°C). Crucially, keep all other conditions (temperature, incubation time, wash stringency) identical across all dilutions [63].
- Detection: Complete the staining protocol by incubating with the appropriate secondary antibody and detection reagents.
- Data Acquisition: For flow cytometry, acquire a minimum of 1,000 positive events for each concentration on a flow cytometer [63]. For immunofluorescence or Western blot, capture images or signals using standardized exposure times.
Minimal Volume Incubation for Western Blot (Sheet Protector Strategy)
This innovative protocol drastically reduces the volume of antibody required for Western blotting, from the conventional 10-15 mL to as little as 20-150 µL, without compromising sensitivity [66].
Materials:
- Blocked nitrocellulose (NC) or PVDF membrane
- Primary antibody solution
- Sheet protector (standard stationery item)
- Zipper bag and wet paper towels (for long incubations)
Method:
- Membrane Preparation: After blocking, briefly immerse the membrane in wash buffer (e.g., TBST) and then blot it thoroughly with a paper towel to absorb residual moisture. The membrane should be semi-dry [66].
- Assembly:
- Place the membrane on one leaflet of a cropped sheet protector.
- Pipette the calculated minimal volume of primary antibody working solution directly onto the membrane. The required volume can be estimated; for a 4.5 cm-long NC membrane, it is approximately
Volume (µL) = 6.5 × (Number of Lanes) - 7.5[66]. - Gently lower the upper leaflet of the sheet protector onto the membrane. The antibody solution will disperse over the membrane as a thin layer via surface tension, forming an "SP unit" [66].
- Incubation: Incubate the SP unit flat on a benchtop. For incubations longer than 2 hours, place the SP unit on a wet paper towel inside a sealed zipper bag to prevent evaporation [66].
- Post-Incubation: Open the SP unit, retrieve the membrane, and proceed with standard washing and secondary antibody incubation steps.
Data Presentation and Analysis
Quantitative Analysis of Titration Data
To determine the optimal antibody concentration, quantitative analysis of the signal and noise is required. The table below outlines key metrics and calculations.
Table 1: Key Metrics for Titration Data Analysis
| Metric | Description | Calculation | Optimal Value |
|---|---|---|---|
| Median Fluorescence Intensity (MFI) | The median signal intensity of the positive cell population. | N/A (Direct instrument output) | N/A |
| Background MFI | The median signal intensity of the negative cell population or unstained control. | N/A (Direct instrument output) | N/A |
| Staining Index (SI) | A standardized measure of the separation between positive and negative populations; uses standard deviation. | (MFI_positive - MFI_negative) / (k × SD_negative) where k=2 or 4 [63] |
Highest value |
| Signal-to-Noise Ratio | The ratio of the specific signal to the background signal. | MFI_positive / MFI_negative |
Highest value |
The optimal antibody concentration is identified as the one that yields the highest Staining Index or Signal-to-Noise Ratio, providing the most robust and reliable detection [63] [65].
Performance Comparison: Conventional vs. Sheet Protector Method
The following table summarizes quantitative data comparing the conventional Western blot method with the minimal-volume Sheet Protector (SP) strategy, demonstrating its efficacy for standard and potentially low-abundance targets.
Table 2: Comparison of Conventional and Sheet Protector Western Blot Methods
| Parameter | Conventional Method | Sheet Protector (SP) Strategy |
|---|---|---|
| Antibody Volume | 10 mL or more [66] | 20 - 150 µL [66] |
| Antibody Consumption | High (Baseline) | ~99% reduction [66] |
| Incubation Time | Overnight (18 hours) [66] | As little as 15 minutes to a few hours [66] |
| Incubation Temperature | Typically 4°C [66] | Room temperature possible [66] |
| Agitation | Required (gentle rocking) [66] | Not required [66] |
| Reported Sensitivity | Baseline (Comparable) | Comparable to conventional method for housekeeping proteins (GAPDH, α-tubulin, β-actin) [66] |
Visualization of Workflows
Antibody Titration and Optimization Workflow
Minimal Volume Western Blot Incubation
The Scientist's Toolkit: Research Reagent Solutions
Table 3: Essential Reagents for Immunostaining Optimization
| Reagent / Material | Function in Optimization |
|---|---|
| Sheet Protector | A common stationery item used to create a sealed, thin-layer incubation chamber for Western blot, enabling a >99% reduction in antibody solution volume [66]. |
| Viability Dye | A fluorescent stain used to identify and exclude dead cells during flow cytometry analysis, which can cause non-specific antibody binding and increase background noise [64]. |
| Fc Receptor Block | A solution (e.g., purified antibody, serum) used to block Fc receptors on cells, preventing non-specific binding of antibodies and reducing background [65]. |
| Phosphatase Inhibitors | Cocktails added to lysis buffers to preserve protein phosphorylation states during sample preparation for Western blot, crucial for detecting post-translational modifications [67]. |
| Signal-to-Noise Calculation | The quantitative process of comparing the specific signal from a positive population to the background signal from a negative population to objectively determine the optimal antibody titer [65]. |
| (2E)-Leocarpinolide F | (2E)-Leocarpinolide F, MF:C20H24O7, MW:376.4 g/mol |
Effective Blocking Strategies to Reduce Non-Specific Binding
In the context of immunostaining for low-abundance protein targets, the specificity of antibody binding is paramount. Non-specific binding (NSB) presents a significant obstacle, often obscuring the authentic signal of rare proteins and leading to inaccurate data interpretation. Effective blocking is a critical preparatory step that minimizes these unwanted interactions by saturating potential off-target sites on the sample surface and the solid support matrix. This application note details optimized blocking strategies and protocols to enhance assay sensitivity and specificity, enabling the reliable detection of low-abundance proteins in complex biological samples through flow cytometry and immunofluorescence techniques. The judicious use of blocking reagents not only improves signal-to-noise ratios but also prevents undesirable interactions between detection dyes [68].
Understanding Non-Specific Binding and Blocking Mechanisms
Non-specific binding occurs when antibodies or other detection reagents interact with cellular components through mechanisms not related to specific antigen recognition. Common causes include interactions with Fc receptors on immune cells, hydrophobic or electrostatic interactions with cellular membranes or plastic surfaces, and binding to phosphorylated residues or other common protein motifs. For low-abundance targets, even minimal NSB can generate a background signal that overwhelms the specific signal, rendering the target undetectable.
Blocking agents work by pre-occupying these non-specific sites before antibody application. The effectiveness of a blocking protein depends on its physicochemical properties and its mechanism of action. Research indicates that proteins like casein primarily prevent NSB through protein-plastic interactions, effectively coating the solid surface. In contrast, other proteins like gelatin function mainly through protein-protein interactions, which may be more effective at preventing non-specific binding to cellular components [69]. Understanding these mechanistic differences is crucial for selecting the optimal blocking strategy for a given experimental system.
Quantitative Comparison of Blocking Reagents
The choice of blocking agent significantly impacts the level of non-specific background. Comparative studies have quantified the effectiveness of various proteins as blocking agents across a wide concentration range. The table below summarizes key performance characteristics of common blocking reagents, highlighting their relative efficacies in different application contexts.
Table 1: Performance Characteristics of Common Blocking Reagents
| Blocking Reagent | Optimal Concentration Range | Relative Effectiveness | Primary Mechanism | Best Suited Applications |
|---|---|---|---|---|
| Instantized Dry Milk/Casein | 1-5% | High (≥90% NSB reduction) [69] | Protein-plastic interaction [69] | Western Blot, ELISA |
| Bovine Serum Albumin (BSA) | 1-5% | Moderate to High | Protein-protein interaction | Flow Cytometry, Immunocytochemistry |
| Fish Skin Gelatin | 1-5% | Moderate | Protein-protein interaction | General Immunostaining |
| Porcine Skin Gelatin (Hydrolyzed) | 1-5% | Low (Poor as pretreatment) [69] | Protein-protein interaction | Limited Application |
| Serum (Species-Matched) | 1-10% | Moderate to High (Provides Fc receptor blocking) | Combined (Fc block + protein interaction) | Flow Cytometry, Intracellular Staining |
| Amphiphilic Sugars | Varies | High for label-free assays [70] | Surface passivation | Label-free Biosensors, Reflective Interferometry |
The data demonstrates that instantized dry milk and casein are among the most effective agents, achieving over 90% reduction in NSB at significantly lower concentrations than most alternatives. A critical finding is the poor performance of enzymatically hydrolyzed porcine skin gelatin, which failed to reduce NSB by more than 90% even at high concentrations and was particularly ineffective as a pretreatment agent [69]. Fish skin gelatin, while less effective than casein, offers the practical advantage of remaining fluid at refrigeration temperatures.
Detailed Experimental Protocols
Basic Protocol 1: Surface Staining for Flow Cytometry
This protocol is optimized for high-parameter flow cytometry to ensure high specificity, which is crucial for detecting low-abundance cell surface markers [68].
- Reagents Required: Flow Cytometry Staining Buffer (e.g., PBS with 1% BSA or 2% FBS), Fc Receptor Blocking Solution (optional), Primary Antibodies, Viability Dye (optional).
- Procedure:
- Preparation: Harvest and wash cells with cold staining buffer. Count and aliquot 1-5 x 10^6 cells per tube.
- Fc Receptor Blocking (Recommended): Resuspend cell pellet in 50-100 µL of staining buffer containing an Fc receptor blocking reagent (e.g., purified anti-CD16/32 for mouse cells) or 1-5% species-matched serum. Incubate on ice or at 4°C for 10-15 minutes.
- Surface Staining: Without washing, add directly titrated fluorescently-conjugated antibodies to the tube. Mix gently and incubate for 30-60 minutes in the dark at 4°C.
- Washing: Add 2 mL of cold staining buffer to the tube, centrifuge at 300-500 x g for 5 minutes, and carefully decant the supernatant.
- Fixation (Optional): For delayed acquisition, resuspend cells in 100-200 µL of 1-4% paraformaldehyde in PBS.
- Acquisition: Resuspend cells in an appropriate volume of staining buffer and acquire data on a flow cytometer.
- Critical Notes: Antibody titration is essential for optimal signal-to-noise ratio. The use of viability dyes helps exclude dead cells, which are prone to NSB. Always include unstained and single-stained controls for compensation and setting thresholds.
Basic Protocol 2: Intracellular Staining (IC)
This method is for detecting intracellular proteins or transcription factors and requires cell permeabilization, which increases the potential for NSB [68].
- Reagents Required: Fixation Buffer (e.g., 4% PFA), Permeabilization Buffer (e.g., with saponin or Triton X-100), Permeabilization Wash Buffer, Primary Antibodies.
- Procedure:
- Surface Staining (Optional): Perform surface antibody staining as in Basic Protocol 1, then wash cells.
- Fixation: Resuspend cells thoroughly in 100-200 µL of fixation buffer. Incubate for 20-30 minutes at room temperature.
- Washing: Add 2 mL of staining buffer, centrifuge, and decant the supernatant.
- Permeabilization: Resuspend cells in 100-200 µL of permeabilization buffer. Incubate for 15-30 minutes at room temperature.
- Intracellular Staining: Add directly titrated antibodies diluted in permeabilization buffer to the tube. Mix and incubate for 30-60 minutes at room temperature in the dark.
- Washing: Add 2 mL of permeabilization wash buffer, centrifuge, and decant. Perform a final wash with regular staining buffer.
- Acquisition: Resuspend cells in staining buffer and acquire data.
- Critical Notes: The permeabilization buffer must be compatible with the antibody and antigen target. The blocking agent (e.g., 1% BSA) is often included in the perm buffer. Titration of both fixation and perm conditions is recommended.
Basic Protocol 3: Blocking with Immunizing Peptide
This protocol validates antibody specificity by pre-adsorbing it with the peptide used to generate it, which should abolish specific staining [71].
- Reagents Required: Blocking Buffer (e.g., TBST with 5% non-fat dry milk or 3% BSA for WB; PBS with 1% BSA for IHC), Immunizing (Blocking) Peptide, Target-Specific Antibody.
- Procedure:
- Preparation: Dilute the necessary amount of antibody to its optimal working concentration in blocking buffer. Divide this solution equally into two tubes.
- Neutralization: To the first tube ("blocked"), add a five-fold excess (by weight) of immunizing peptide. To the second tube ("control"), add an equivalent volume of buffer only [71].
- Incubation: Incubate both tubes with agitation for 30 minutes at room temperature or overnight at 4°C.
- Staining: Perform the standard staining protocol (e.g., Western Blot, IHC) on two identical samples, using the "blocked" antibody for one and the "control" antibody for the other.
- Analysis: Compare the results. The specific signal will be absent or significantly diminished in the sample stained with the peptide-blocked antibody [71].
- Critical Notes: This is a critical control for confirming antibody specificity, especially for polyclonal antibodies. A five-fold weight excess of peptide to antibody is typically sufficient for complete neutralization.
The Scientist's Toolkit: Essential Reagents
Table 2: Key Research Reagent Solutions for Effective Blocking
| Reagent/Category | Function/Purpose | Example Applications |
|---|---|---|
| Fc Receptor Blockers | Binds to Fc receptors on cells, preventing antibody non-specific binding via the Fc portion. | Flow cytometry, especially with immune cells [68]. |
| Protein-Based Blockers (BSA, Casein, Serum) | Saturates hydrophobic or charged sites on surfaces and cells to minimize non-specific adsorption. | Western Blot (Milk/Casein) [69], Immunofluorescence (BSA) [72]. |
| Blocking Peptides | Validates antibody specificity by competitively inhibiting binding to the target epitope [71]. | Antibody validation for Western Blot, IHC, ICC. |
| Amphiphilic Sugars | Forms a reversible, non-fouling layer on surfaces, reducing non-specific adsorption in label-free assays [70]. | Reflective interferometry, biosensor surfaces [70]. |
| Enhanced Chemiluminescent (ECL) Substrates | Increases sensitivity and signal-to-noise ratio in Western Blot for low-abundance targets [73]. | Detecting low-abundance proteins via Western Blot. |
Workflow Visualization
The following diagram illustrates the logical decision process for selecting an appropriate blocking strategy based on the experimental application.
Decision Workflow for Blocking Strategy Selection
Advanced Techniques and Future Directions
Emerging blocking strategies continue to improve assay sensitivity. The use of amphiphilic sugars for reversible surface blocking in label-free assays like reflective interferometry shows promise for reducing NSB without permanent surface modification [70]. This approach allows for sensor reuse and can be particularly beneficial in point-of-care diagnostic platforms.
For the most challenging low-abundance targets, integrating multiple strategies is often necessary. This includes combining traditional protein blockers with Fc receptor inhibition in flow cytometry, using high-sensitivity detection substrates in Western blotting [73], and employing live-cell antibody injection techniques to visualize proteins that are difficult to detect with standard immunofluorescence after fixation [72]. The continued optimization of these integrated protocols will be crucial for advancing research in systems biology and drug development, where understanding the role of rare protein species is increasingly important.
Autofluorescence (AF) is a prevalent challenge in immunofluorescence microscopy, characterized by the background fluorescence emitted by endogenous biomolecules within cells and tissues. This nonspecific signal severely compromises the signal-to-noise ratio, complicating data interpretation and quantification [74] [75] [76]. The issue is particularly acute in research focused on low-abundance protein targets, where the desired specific immunofluorescence (IF) signal can be easily obscured by background noise [12] [14]. Effective management of autofluorescence is therefore not merely an optimization step but a critical prerequisite for obtaining reliable and reproducible data in sensitive immunostaining applications.
The sources of autofluorescence are diverse. Endogenous fluorophores include lipofuscin, elastin, collagen, flavins, and flavoproteins, which emit across a broad spectrum [74] [76]. Furthermore, tissue processing, particularly formalin fixation, introduces additional autofluorescence that can emit across blue, green, and red channels [76]. Some tissues, such as the adrenal cortex, kidney, and spleen, are notoriously autofluorescent due to their high content of lipids or connective tissues [74] [76]. The broad excitation and emission spectra of these autofluorescent components mean they can interfere with the detection of many commonly used fluorophores, including DAPI, EGFP, Alexa Fluor 430, and Alexa Fluor 514 [74]. For researchers investigating low-abundance proteins, this interference can mean the difference between detecting a faint but specific signal and missing it entirely.
This application note details two synergistic strategies to overcome autofluorescence: the use of chemical quenching agents to suppress background signal and the strategic selection of fluorophores to maximize specific signal detection. By implementing these protocols, researchers can significantly enhance the quality and reliability of their immunofluorescence data, particularly for challenging targets.
Chemical Quenching of Autofluorescence
Chemical quenching involves treating tissue sections with specific reagents that reduce the intensity of autofluorescence through various physical and chemical mechanisms. These methods are often simple to implement and can be readily incorporated into standard immunofluorescence workflows.
Efficacy of Common Quenching Reagents
A quantitative comparison of various autofluorescence quenching methods revealed significant differences in their effectiveness, dependent on both the reagent and the excitation wavelength [74]. The following table summarizes the performance of several common treatments.
Table 1: Efficacy of Autofluorescence Quenching Reagents
| Treatment Method | Reduction at 405 nm Excitation | Reduction at 488 nm Excitation | Key Considerations |
|---|---|---|---|
| TrueBlack Lipofuscin Autofluorescence Quencher | 93% ± 0.1% (SE) | 89% ± 0.04% (SE) | Preserves specific IF signals and tissue integrity; effective against lipofuscin [74]. |
| MaxBlock Autofluorescence Reducing Reagent Kit | 95% ± 0.03% (SE) | 90% ± 0.07% (SE) | Reduces overall AF homogeneously; results in slightly brighter nuclei than cytoplasm [74]. |
| Sudan Black B (SBB) | 88% ± 0.3% (SE) | 82% ± 0.7% (SE) | Reduction is heterogeneous, depending on local staining intensity [74]. |
| TrueVIEW Autofluorescence Quenching Kit | 70% ± 3% (SE) | 62% ± 2% (SE) | Simple, two-minute protocol; compatible with common fluorophores [74] [76]. |
| Ammonia/Ethanol (NH₃) | 70% ± 2% (SE) | 65% ± 2% (SE) | Effective but may not eliminate all autofluorescent granules [74]. |
| Copper(II) Sulfate (CuSO₄) | 68% ± 0.8% (SE) | 52% ± 1% (SE) | Reduces overall background but does not shift AF emission profile [74]. |
| Trypan Blue (TRB) | 12% ± 2% (SE) | No reduction; shifts AF emission | Largely ineffective at 488 nm excitation [74]. |
Protocols for Chemical Quenching
Protocol: TrueVIEW Autofluorescence Quenching Kit
The TrueVIEW kit provides a straightforward and rapid method for quenching autofluorescence post-staining [76].
- Sample Preparation: Complete all standard steps of your immunofluorescence protocol, including primary and secondary antibody incubations and final washes.
- Reagent Preparation: Briefly vortex the TrueVIEW reagent to ensure it is well-mixed.
- Quenching Incubation: Apply enough TrueVIEW reagent to completely cover the tissue section on the slide. Incubate for 2 minutes at room temperature, protected from light.
- Washing: Gently tap off the excess reagent and rinse the slide by immersing it in deionized water or a mild buffer for a few seconds.
- Mounting: Apply an appropriate anti-fade mounting medium and a coverslip. Proceed to image acquisition.
Note: The treatment may cause a modest loss in specific fluorescence signal. This can be compensated for by increasing the primary antibody concentration or extending the camera exposure time during imaging [76].
Protocol: TrueBlack Lipofuscin Autofluorescence Quencher
TrueBlack is particularly effective against lipofuscin, a common autofluorescent pigment [74].
- Preparation: After immunostaining and final washes, ensure slides are slightly damp.
- Dilution: Dilute TrueBlack reagent as recommended by the manufacturer's instructions (common dilutions range from 1:50 to 1:200 in buffer or solvent).
- Application: Apply the diluted TrueBlack solution to the tissue section. Incubate for 10-30 minutes at room temperature, protected from light.
- Washing: Wash the slide thoroughly with the recommended buffer (e.g., PBS or TBST) to remove all residual quencher. Perform 3 washes, 5 minutes each.
- Mounting: Apply an anti-fade mounting medium and a coverslip. Image the slides promptly.
Strategic Fluorophore Selection
The strategic choice of fluorophore is equally critical for successful immunofluorescence, especially for low-abundance targets. The goal is to select bright, photostable dyes whose spectral profiles minimize overlap with tissue autofluorescence and other fluorophores in multiplexed panels.
Key Principles for Fluorophore Selection
- Check Microscope Configuration: The first step is to align fluorophore choice with the available microscope hardware. Consult the instrument's excitation lasers and emission filter sets to ensure they are compatible with your chosen fluorophores' excitation and emission maxima [77].
- Match Fluorophore Brightness to Target Abundance: Assign your brightest fluorophores (e.g., Alexa Fluor 488, R-PE) to the least abundant protein targets. Less bright dyes (e.g., FITC) can be used for highly expressed antigens [77] [78]. The brightness of a fluorophore is determined by its extinction coefficient and quantum yield.
- Minimize Spectral Overlap in Multiplexing: Use a online spectra viewer to visualize the excitation and emission spectra of all fluorophores in your panel. Choose dyes with well-separated emission peaks to minimize bleed-through (spillover) between channels [77] [78].
- Utilize Far-Red and Near-IR Dyes: Tissue autofluorescence is typically most intense in the green and yellow portions of the spectrum (350-550 nm) [77] [76]. Using fluorophores that emit in the far-red and near-infrared regions (e.g., Cy5, Alexa Fluor 647) can dramatically improve the signal-to-noise ratio by avoiding this noisy region.
- Prioritize Photostability and Compatibility: Choose modern synthetic dyes (e.g., Alexa Fluor dyes, StarBright dyes) over traditional ones like FITC. They are generally more photostable, resistant to quenching by alcohols or acidic pH, and perform better after fixation [77].
Table 2: Essential Research Reagent Solutions
| Item | Function | Example Use Case |
|---|---|---|
| TrueBlack Lipofuscin Autofluorescence Quencher | Suppresses autofluorescence from lipofuscin and other broad-spectrum sources. | Ideal for tissues with high lipofuscin content (e.g., adrenal cortex, aging tissues) [74]. |
| TrueVIEW Autofluorescence Quenching Kit | Rapidly quenches AF from formalin-fixed tissue, collagen, elastin, and RBCs. | A quick, post-staining step for general reduction of background in FFPE tissues [76]. |
| Anti-Fade Mounting Medium (with DAPI) | Retards photobleaching during imaging and storage; often includes nuclear counterstain. | Essential for preserving signal, especially for low-abundance targets requiring long exposures [79]. |
| Bright, Photostable Fluorophores (e.g., Alexa Fluor dyes, StarBright dyes) | Provide strong, durable specific signals that can be distinguished from background. | Critical for detecting low-abundance antigens and for multiplexed experiments [77]. |
| High-Sensitivity Detection Substrates | Amplify weak signals for detection (in Western blotting or FLISA). | Enables detection of low-abundance proteins in Western blots when immunostaining is not feasible [12]. |
| Protease Inhibitor Cocktails | Prevent protein degradation during sample preparation. | Preserves low-abundance targets in cell and tissue lysates [12] [14]. |
Advanced and Emerging Techniques
While chemical quenching and fluorophore selection are foundational, advanced microscopic techniques offer powerful digital alternatives for autofluorescence suppression.
Fluorescence Lifetime Imaging Microscopy (FLIM)
FLIM separates specific signals from autofluorescence based on differences in their fluorescence lifetime—the time a fluorophore remains in the excited state before emitting a photon. Autofluorescence typically has a shorter lifetime (e.g., ~2.2 ns) compared to many synthetic fluorophores (e.g., ~3.5 ns for CF450) [75].
Phasor Analysis for Signal Separation: In a phasor plot, the unique lifetime signatures of autofluorescence and immunofluorescence occupy distinct clusters. The signal from each pixel can be decomposed into its fractional contributions from AF and IF, allowing for the quantitative extraction of an autofluorescence-free image [75]. Recent advancements in high-speed FLIM, accelerated by GPU parallel computing, have overcome traditional speed limitations, making this technique viable for routine imaging workflows [75]. This method has been shown to enhance the correlation between immunofluorescence and immunohistochemistry data, outperforming chemical photobleaching.
The following workflow diagram illustrates the integrated strategy for combating autofluorescence, combining the principles of chemical quenching, strategic fluorophore selection, and advanced imaging techniques.
Combating autofluorescence is a multi-faceted endeavor essential for the successful detection of low-abundance protein targets. No single method is universally superior; the most robust approach involves a combination of strategies. Chemical quenching with reagents like TrueBlack or TrueVIEW provides a simple and highly effective means of physically suppressing background fluorescence. Concurrently, the strategic selection of fluorophores—prioritizing brightness, photostability, and emission in spectral windows with low autofluorescence—serves to maximize the specific signal. For the most challenging applications, advanced techniques like high-speed FLIM offer a digital, non-destructive path to separating signal from noise. By systematically applying the principles and protocols outlined in this application note, researchers can significantly enhance the quality, reliability, and interpretability of their immunofluorescence data, pushing the boundaries of what is detectable in biomedical research.
Addressing Epitope Masking Through Antigen Retrieval Optimization
Epitope masking represents a significant challenge in immunostaining techniques, particularly in the context of low abundance protein research. This phenomenon occurs when the process of tissue fixation, essential for preserving morphological structure, inadvertently alters or conceals the antigenic determinants (epitopes) that antibodies are designed to recognize [80]. For researchers investigating low abundance protein targets, effective reversal of epitope masking is not merely an optimization step but a critical prerequisite for obtaining valid, reproducible data.
The primary culprit in epitope masking is formalin fixation, which has remained the standard in histopathology since 1893. Formalin acts as a cross-linking fixative, forming methylene bridges between adjacent proteins and amino acid residues. While this stabilizes tissue architecture, it simultaneously alters protein conformation, potentially eliminating the ability of primary antibodies to recognize their target peptide sequences [80]. For low abundance targets, even minimal masking can result in false negatives, compromising data interpretation and potentially leading to erroneous conclusions in critical research areas such as biomarker discovery, drug development, and mechanistic studies.
The discovery in 1991 that these formalin-induced cross-linkages could be reversed through specific treatments led to the development of modern antigen retrieval techniques [80]. These methods have become indispensable tools in the researcher's arsenal, particularly when working with challenging low abundance targets where signal optimization is paramount.
Fundamental Mechanisms of Antigen Retrieval
Antigen retrieval functions through two primary mechanistic approaches: thermal energy and enzymatic digestion. Heat-Induced Epitope Retrieval (HIER) utilizes elevated temperatures (typically 95-97°C) to disrupt the methylene bridges formed during formalin fixation through thermal unfolding [80]. The molecular mechanism involves both the physical breakdown of cross-links and the chelation of calcium ions that contribute to protein cross-linking [80]. Buffer selection in HIER is pH-critical, with low pH citrate buffer (pH 6.0) and high pH Tris-EDTA solutions (pH 8.0-9.9) representing the most frequently employed formulations [80].
In contrast, Proteolytic-Induced Epitope Retrieval (PIER) employs proteolytic enzymes such as trypsin, proteinase K, pepsin, protease, and pronase to cleave protein crosslinks and restore antigenic accessibility [80]. This method typically operates at 37°C with incubation periods of 10-20 minutes in humidified chambers [80]. The enzymatic approach selectively digests the cross-linked proteins, physically liberating the epitopes for antibody recognition.
The efficacy of any retrieval method depends on multiple factors including the chemical nature of the target antigen, the extent of glycosylation, the duration of formalin fixation, and the structural context within the tissue [81]. For low abundance targets, even minor variations in these parameters can significantly impact detection sensitivity, necessitating careful optimization.
Comparative Analysis of Antigen Retrieval Methods
Methodological Comparisons
Table 1: Characteristics of Major Antigen Retrieval Methods
| Parameter | Heat-Induced Epitope Retrieval (HIER) | Proteolytic-Induced Epitope Retrieval (PIER) |
|---|---|---|
| Mechanism | Thermal disruption of crosslinks | Enzymatic cleavage of crosslinks |
| Typical Conditions | 95-97°C for 10-30 minutes [80] | 37°C for 10-20 minutes (enzyme-dependent) [80] |
| Common Reagents | Citrate buffer (pH 6.0), Tris-EDTA (pH 8.0-9.9) [80] | Proteinase K, Trypsin, Pepsin [81] [80] |
| Advantages | Superior for most antigens, better morphology preservation [80] | Effective for densely cross-linked or glycosylated targets [81] |
| Limitations | Potential tissue damage from heat, detachment of sections [81] | Risk of over-digestion, morphological damage [80] |
| Success with Low Abundance Targets | High when optimized [80] | Variable; target-dependent [81] |
Experimental Evidence for Method Selection
Recent research provides concrete evidence for method selection in specific applications. A 2024 systematic comparison of antigen retrieval methods for detecting cartilage intermediate layer protein 2 (CILP-2), a minor but diagnostically promising cartilage glycoprotein, demonstrated that PIER using Proteinase K (30 µg/mL solution at 37°C for 90 minutes) followed by hyaluronidase treatment (0.4% for 3 hours at 37°C) yielded superior results compared to HIER or combined approaches [81]. Notably, combining PIER with HIER did not improve CILP-2 staining and actually frequently resulted in section detachment from slides [81].
The study further revealed that the glycosylation status of target proteins influences retrieval efficacy. CILP-2 contains fewer glycosylation sites than its homolog CILP-1, potentially making it more reliant on non-covalent bonds for structural stability and thus more susceptible to heat denaturation [81]. This underscores the importance of understanding target protein characteristics when selecting retrieval methods, particularly for low abundance targets where optimal retrieval is critical.
For specialized applications such as immunoelectron microscopy (IEM), the timing of immunolabeling relative to sample embedding introduces additional considerations. Pre-embedding labeling optimizes detection efficiency through pre-exposure of antigenic epitopes and is especially suitable for low-abundance and sensitive antigens, though it may compromise cellular structure preservation. Post-embedding labeling, utilizing low-temperature resin embedding or Tokuyasu frozen ultrathin sectioning, better preserves ultrastructural integrity while potentially improving deep-end labeling accessibility [82].
Optimized Protocols for Low Abundance Targets
Heat-Induced Epitope Retrieval (HIER) Protocol
Deparaffinization and Hydration: Process formalin-fixed, paraffin-embedded sections through xylene and graded ethanol series to distilled water [81].
Buffer Selection: Prepare either citrate buffer (10mM, pH 6.0) or Tris-EDTA buffer (10mM, pH 9.0) as retrieval solution. For novel targets, test both pH conditions initially [80].
Heating Method: Place slides in preheated retrieval solution using one of the following approaches:
- Water bath: 92-95°C for 5-10 minutes
- Microwave: 95-97°C for 10-30 minutes with intermittent replenishment of evaporated buffer
- Pressure cooker: 120°C for 1-5 minutes [80]
Cooling: Following heating, allow slides to remain in the buffer for 35 minutes of cooling at room temperature [80].
Washing: Rinse slides with phosphate-buffered saline (PBS, pH 7.4) prior to immunostaining procedures [81].
Proteolytic-Induced Epitope Retrieval (PIER) Protocol
Enzyme Solution Preparation: Prepare Proteinase K at 30 µg/mL in 50 mM Tris/HCl with 5 mM CaCl₂ (pH 6.0) [81]. Alternative enzymes include trypsin (typically at pH 7.8) or pepsin.
Digestion Conditions: Apply enzyme solution to tissue sections and incubate at 37°C for 90 minutes in a humidified chamber [81].
Enzyme Inactivation: Terminate the reaction by rinsing slides with Gibco Phosphate-Buffered Saline (PBS, pH 7.4) [81].
Optional Secondary Digestion: For extracellular matrix-rich tissues (e.g., cartilage), subsequent treatment with 0.4% bovine hyaluronidase in HEPES-buffered medium for 3 hours at 37°C may enhance epitope accessibility [81].
Specialized Retrieval for Challenging Targets
For particularly refractory low abundance targets, consider these enhanced approaches:
Sequential Retrieval: Employ brief HIER (5 minutes at 95°C) followed by shortened PIER (10-15 minutes enzyme digestion). This combination approach may overcome masking in densely cross-linked tissues but requires careful optimization to prevent tissue damage [81].
Extended HIER: For nuclear antigens or deeply embedded epitopes, extend HIER incubation to 45-60 minutes with careful monitoring of morphological preservation.
Buffer Additives: Incorporate 2-5% SDS or 0.5% Tween-20 into retrieval buffers to enhance protein unfolding and epitope exposure, particularly for membrane-associated targets.
The Scientist's Toolkit: Essential Research Reagents
Table 2: Key Reagents for Antigen Retrieval Optimization
| Reagent/Category | Specific Examples | Function & Application Notes |
|---|---|---|
| HIER Buffers | Citrate buffer (pH 6.0), Tris-EDTA (pH 8.0-9.9), Reveal Decloaker [80] [81] | Disrupt crosslinks through thermal energy; pH critical for efficacy |
| PIER Enzymes | Proteinase K, Trypsin, Pepsin, Pronase [81] [80] | Enzymatically cleave protein crosslinks; concentration and time critical |
| Fixation Reagents | Formaldehyde, Paraformaldehyde, Glutaraldehyde [82] | Preserve tissue architecture; concentration and duration affect masking |
| Blocking Agents | BSA, Normal serum, NFDM/TBST [14] [1] | Reduce nonspecific background; essential for low abundance targets |
| Detection Enhancers | Tyramide signal amplification, Colloidal gold [82] | Amplify weak signals; crucial for low abundance protein detection |
Strategic Optimization Framework
Systematic Optimization Approach
A methodical strategy is essential for optimizing antigen retrieval for low abundance targets:
Initial Method Screening: Begin with HIER at both low pH (citrate buffer, pH 6.0) and high pH (Tris-EDTA, pH 8.0-9.9) as these conditions cover the majority of protein targets [80].
Enzymatic Retrieval Evaluation: If HIER yields suboptimal results, proceed to test PIER using different enzymatic approaches (trypsin, proteinase K, pepsin) with varying concentrations and incubation times [80].
Matrix Studies: Conduct preliminary optimization using various combinations of time, temperature, and pH to establish ideal retrieval conditions for novel targets [80].
Validation with Controls: Always include appropriate positive controls (tissues with known antigen expression) and negative controls (sections processed without primary antibody) to confirm protocol efficacy and specificity [80].
Troubleshooting Common Issues
Weak or No Staining: Often caused by insufficient epitope unmasking. Potential solutions include increasing heating time, switching to higher pH retrieval solution, or incorporating enzymatic pre-treatment [80].
High Background Staining: Frequently results from over-retrieval or excessive enzymatic digestion. Reduce retrieval time/temperature or enzyme concentration, and ensure adequate blocking [80] [1].
Tissue Damage: May occur from excessive heat or over-digestion. Optimize retrieval intensity and consider using specialized adhesion slides to prevent detachment [81].
Inconsistent Results: Often stems from uncontrolled variables in heating method or buffer preparation. Standardize retrieval equipment and buffer preparation protocols [80].
Workflow Integration and Quality Control
Figure 1: Antigen Retrieval Optimization Workflow for Low Abundance Targets
Quality Control Measures
Rigorous quality control is essential when working with low abundance targets:
Transfer Efficiency Assessment: Briefly stain membranes with Ponceau red dye (1-10 minutes) to determine transfer efficiency following retrieval [14].
Specificity Controls: Employ multiple validation approaches including:
- Knockout/knockdown validation where possible
- Blocking peptides with matched antibody-antigen pairs [80]
- Comparison across multiple antibody clones recognizing different epitopes
Signal Verification: For low abundance targets, confirm specificity through multiple detection methods or orthogonal techniques when possible.
Effective addressing of epitope masking through optimized antigen retrieval represents a cornerstone technique for successful investigation of low abundance protein targets. The strategic selection and optimization of HIER or PIER methodologies, based on target protein characteristics and tissue context, can dramatically enhance detection sensitivity while maintaining morphological integrity. As research continues to push the boundaries of detection sensitivity, particularly in areas such as single-cell analysis and spatial proteomics, refined antigen retrieval approaches will remain essential tools for revealing the subtle yet biologically critical world of low abundance proteins.
Preventing Protein Loss and Degradation During Processing
In the context of research on immunostaining for low-abundance protein targets, preserving protein integrity is paramount. The challenges of protein loss and degradation during sample processing can significantly obscure the detection of subtle but critical biological signals. This document provides detailed application notes and protocols designed to safeguard protein integrity, ensuring reliable and reproducible results in your research and drug development workflows.
Mechanisms of Protein Degradation and Key Stabilizing Strategies
Protein integrity during processing is threatened by enzymatic, chemical, and physical degradation pathways. Proactive stabilization is required to mitigate these risks, particularly for sensitive, low-abundance targets. The table below summarizes the primary agents of degradation and corresponding protective strategies.
Table 1: Key Mechanisms of Protein Degradation and Stabilization Strategies
| Degradation Agent | Primary Effect on Proteins | Recommended Stabilization Strategy |
|---|---|---|
| Proteolytic Enzymes [67] [14] | Cleavage of peptide bonds, leading to fragmentation and loss of epitopes. | Use of broad-spectrum protease inhibitor cocktails (e.g., PMSF, Aprotinin, Leupeptin) in lysis buffer [67]. |
| Phosphatases [67] | Removal of phosphate groups from phosphorylated amino acids (e.g., Ser, Thr, Tyr). | Use of phosphatase inhibitors (e.g., Sodium Orthovanadate, β-glycerophosphate) in lysis buffer [67]. |
| Heat [83] [84] | Denaturation, aggregation, and degradation of heat-labile proteins. | Use of low-temperature processing; optimization of thermal treatment intensity and duration [84]. |
| Oxidation [84] | Modification of amino acid side chains (e.g., Met, Cys), leading to loss of function. | Use of antioxidants; processing under inert atmosphere (e.g., nitrogen sparging) [84]. |
| Physical Shearing [14] | Disruption of protein complexes and membrane-associated proteins. | Controlled, gentle homogenization methods; avoidance of excessive frothing or sonication [14]. |
Experimental Protocols for Optimal Protein Preservation
Protocol: Optimized Sample Preparation for Low-Abundance Proteins
This protocol is tailored for the preparation of cell lysates intended for the detection of low-abundance proteins via western blotting, incorporating key steps to minimize degradation [14].
Key Research Reagent Solutions:
- RIPA Buffer: For effective whole cell, membrane-bound, and nuclear protein extraction [67] [14].
- Protease Inhibitor Cocktail: A prepared mixture to inhibit serine, cysteine, aspartic, and metalloproteases [67].
- Phosphatase Inhibitor Cocktail: A prepared mixture to inhibit serine/threonine and tyrosine phosphatases [67].
- 5X Laemmli Sample Buffer: Contains SDS for denaturation, glycerol for density, and bromophenol blue as a tracking dye [85].
Detailed Workflow:
Cell Collection & Washing:
- Collect cells and wash twice with ice-cold Phosphate-Buffered Saline (PBS) by centrifugation (100–500 x g, 5 min, 4°C) [14].
Cell Lysis:
- Resuspend the cell pellet in cold RIPA buffer supplemented with fresh protease and phosphatase inhibitor cocktails.
- Incubate on ice for 15 minutes to ensure complete lysis [14].
Sonication and Clarification:
- For nuclear protein release: Use an ultrasonic cell disruptor (e.g., 3 s pulses, 10 s intervals, 5-15 cycles, 40 kW power) until the lysate becomes clear. This step is crucial for disrupting nuclear and cellular clusters [14].
- Centrifuge the lysate at 14,000–17,000 x g for 5 minutes at 4°C to remove insoluble debris.
- Transfer the supernatant (soluble protein fraction) to a fresh tube kept on ice [14].
Protein Quantification:
Sample Preparation for Electrophoresis:
- Dilute the lysate with 5X Laemmli buffer. Using a higher concentration loading buffer (5X instead of 2X) avoids excessive dilution of the protein sample, which is critical for low-abundance targets [14].
- Denaturation: For most proteins, heat the sample at 100°C for 10 minutes. Exception: For multi-transmembrane proteins, avoid boiling to prevent aggregation. Instead, incubate at room temperature for 15-20 minutes, on ice for 30 minutes, or at 70°C for 10-20 minutes [14].
The following diagram illustrates the critical decision points in the sample preparation workflow to preserve protein integrity.
Protocol: Optimized Processing for Food and Biological Matrices
Novel non-thermal processing technologies can significantly reduce protein degradation compared to conventional thermal methods.
Detailed Workflow:
High-Pressure Processing (HPP):
- Principle: Subjects food or biological samples to elevated pressures (e.g., 100-600 MPa), inactivating microorganisms with minimal heat.
- Impact on Proteins: Primarily affects non-covalent bonds, leading to changes in secondary and tertiary structure, particle size, and coagulation properties, but with minimal impact on small molecules and nutritional value [83] [84].
- Application: Effective for liquid and solid matrices like fruit juices and meat products to preserve protein native state [84].
Pulsed Electric Fields (PEF):
- Principle: Applies short, high-voltage pulses to a product placed between two electrodes, electroporating cell membranes.
- Impact on Proteins: Can enhance protein solubility and modify structure with less thermal damage compared to conventional heating [83].
Ohmic Heating:
- Principle: Uses electrical current to generate heat rapidly and uniformly within the product, acting as an electrical resistor.
- Impact on Proteins: Can improve functional properties like water and oil holding capacity, emulsifying, and foaming properties of protein isolates. However, unoptimized processes can lead to protein denaturation [83].
Table 2: Comparison of Novel Food Processing Methods and Their Impact on Proteins
| Processing Method | Mechanism of Action | Key Effects on Food Proteins | Potential for Protein Loss/Degradation |
|---|---|---|---|
| High-Pressure Processing (HPP) [83] | Application of isostatic pressure (100-600 MPa). | Alters secondary structure, particle size, and coagulation properties. | Lower than thermal methods; can be controlled. |
| Pulsed Electric Fields (PEF) [83] | Application of short, high-voltage pulses. | Enhances solubility and can modify protein structure. | Relatively low, as treatment is often at ambient or mild temperatures. |
| Ohmic Heating [83] | Internal heat generation via electrical resistance. | Can improve functional properties (e.g., emulsification); can cause denaturation if unoptimized. | Moderate to High if process is not carefully controlled. |
| Enzymatic Hydrolysis [83] | Uses specific enzymes to break peptide bonds. | Breaks down proteins, improving texture, solubility, and bioactivity (e.g., bioactive peptides). | Controlled degradation; aim is to create specific hydrolysates. |
The Scientist's Toolkit: Essential Reagents and Materials
The following table catalogs critical reagents and their functions for preventing protein loss and degradation during processing for immunostaining and related techniques.
Table 3: Essential Research Reagent Solutions for Protein Stabilization
| Reagent/Material | Function | Key Considerations |
|---|---|---|
| Protease Inhibitor Cocktail [67] [14] | Broad-spectrum inhibition of serine, cysteine, aspartic, and metalloproteases released during cell lysis. | Add fresh to lysis buffer immediately before use. Specific inhibitors (e.g., PMSF for serine proteases) can be used for targeted protection. |
| Phosphatase Inhibitor Cocktail [67] [14] | Preserves the phosphorylation state of proteins by inhibiting endogenous phosphatases. | Essential for studying signal transduction pathways. Often used in combination with protease inhibitors. |
| RIPA Lysis Buffer [67] [14] | A denaturing buffer effective for extracting proteins from whole cells, membranes, and nuclei. | Contains detergents (SDS, Triton X-100) that solubilize membranes and denature proteins, inactivating some enzymes. |
| PVDF Membrane [14] [85] [86] | A hydrophobic membrane with high protein-binding capacity used in western blotting. | Preferred over nitrocellulose for low-abundance proteins due to superior binding and mechanical strength. Must be pre-wetted in methanol. |
| Laemmli Sample Buffer [85] | Prepares proteins for SDS-PAGE by denaturing and imparting a uniform negative charge. | Contains SDS (denaturant), glycerol (adds density), and a reducing agent (DTT or β-mercaptoethanol to break disulfide bonds). |
Process Optimization and Verification Workflow
A systematic approach to optimizing and verifying your protein processing protocol is essential for success. The following diagram outlines a logical workflow for this process, from initial setup to final verification.
Ensuring Data Integrity: Validation, Controls, and Platform Comparison for Reproducible Results
In immunostaining research, particularly for low-abundance protein targets, the signal-to-noise ratio is a significant challenge. Non-specific antibody binding or residual background fluorescence can lead to false positive interpretations, compromising data integrity. Genetic validation controls, such as knockout (KO) and knockdown (KD), provide a definitive method for verifying antibody specificity by testing signal dependency on the target protein [87] [88]. Furthermore, secondary-only controls are essential for distinguishing specific primary antibody signal from non-specific background staining caused by secondary reagents [89]. This application note details rigorous protocols for implementing these critical controls to ensure the reliability of experimental data in drug development and basic research.
Knockout and Knockdown Validation for Antibody Specificity
Core Principles and Comparative Approach
Genetic validation controls function by reducing or eliminating the expression of a target protein, thereby creating a negative control for antibody binding. A significant reduction in signal in the modified cells compared to wild-type controls confirms antibody specificity. The choice between knockout and knockdown methods depends on the experimental goals and target protein characteristics [88].
Table 1: Comparison of Knockdown vs. Knockout Validation Methods
| Feature | Knockdown (RNAi/siRNA) | Knockout (CRISPR-Cas9) |
|---|---|---|
| Mechanism of Action | Degradation of target mRNA, reducing protein translation [87] [88] | Direct cleavage of genomic DNA, preventing gene transcription [87] |
| Best For | Essential genes (allows for partial suppression), genes with pre-designed RNAi reagents [88] | Scenarios requiring high precision and complete absence of the protein [88] |
| Key Limitations | Potential for off-target effects; residual signal may persist [88] | Not suitable for essential genes (can cause cell death) [87] [88] |
| Protein Depletion Efficiency | Partial to substantial (knockdown) | Complete (knockout) |
| Effect Duration | Usually transient [88] | Permanent |
Detailed Experimental Protocols
CRISPR-Cas9-Mediated Knockout Validation Protocol
This protocol utilizes the CRISPR-Cas9 system to create knockout cell models, providing a robust negative control [87].
Workflow Overview:
Required Reagents and Materials:
- Cells: An appropriate cell line expressing the target protein.
- CRISPR-Cas9 System: Cas9 nuclease and a single-guide RNA (sgRNA) designed for your target gene [87].
- Transfection Reagent: For delivering CRISPR components into cells.
- Antibodies: Target-specific primary antibody and a validated secondary antibody.
- Lysis Buffer: For Western blot analysis.
- Fixation/Permeabilization Buffer: For immunocytochemistry/immunofluorescence (ICC/IF).
- Detection Reagents: Such as HRP substrate for Western blot or fluorophore-conjugated secondary antibodies for microscopy.
Step-by-Step Methodology:
- sgRNA Design and Complex Formation: Design a sgRNA that directs Cas9 to an early exon of the target gene to ensure a frameshift mutation. Complex the sgRNA with Cas9 protein.
- Cell Transfection: Transfect the target cell line with the CRISPR-Cas9/sgRNA ribonucleoprotein (RNP) complex using an optimized transfection method.
- Cell Culture and Expansion: Culture the transfected cells for several days to allow for gene editing and turnover of the existing target protein.
- Knockout Validation: Confirm successful gene editing. This can be done by extracting genomic DNA and performing T7 Endonuclease I assay or Sanger sequencing of the target region. Alternatively, use a functional assay to confirm loss of protein function.
- Immunostaining/Western Blot:
- For Western Blot: Prepare whole-cell lysates from both knockout and wild-type control cells. Separate proteins by SDS-PAGE, transfer to a membrane, and probe with the target-specific antibody. A housekeeping protein (e.g., Actin) should be used as a loading control [87].
- For Immunostaining: Culture knockout and control cells on glass coverslips. Fix, permeabilize, and block the cells. Incubate with the primary antibody, followed by a fluorophore-conjugated secondary antibody. Mount and image.
- Data Analysis: A specific antibody will show a dramatic loss or complete absence of signal in the knockout cells compared to the control cells, as demonstrated in the validation examples for ErbB2 and EGFR [87].
RNAi-Mediated Knockdown Validation Protocol
This protocol uses small interfering RNA (siRNA) to transiently reduce target protein levels [87] [88].
Workflow Overview:
Required Reagents and Materials:
- Validated siRNA: siRNA duplexes targeting the mRNA of your protein of interest.
- Scrambled siRNA Control: A non-targeting siRNA sequence with no known homology to the genome.
- Transfection Reagent: Optimized for siRNA delivery.
- Cell Culture Materials.
Step-by-Step Methodology:
- siRNA Preparation: Resuspend and dilute the target-specific and scrambled control siRNAs to a working concentration.
- Cell Seeding and Transfection: Seed cells to reach 30-50% confluency at the time of transfection. Prepare complexes of siRNA and transfection reagent in a serum-free medium according to the manufacturer's protocol. Add the complexes to the cells.
- Incubation: Incubate the transfected cells for 48-72 hours to allow for target mRNA degradation and subsequent reduction of the target protein.
- Analysis: Perform Western blot or immunostaining as described in the knockout protocol.
- Data Analysis: A specific antibody will show a significant reduction in signal intensity in the target siRNA-treated cells compared to the scrambled siRNA control. The loading control (e.g., Actin) should remain constant [87] [88].
Secondary Antibody-Only Controls
Core Principle and Application
The secondary-only control is used to identify non-specific binding, Fc receptor-mediated binding, or background fluorescence contributed by the secondary antibody itself [89]. This control is processed identically to the experimental sample but omits the primary antibody incubation step.
Detailed Experimental Protocol
Workflow Overview:
Step-by-Step Methodology:
- Sample Preparation: Prepare replicate samples of cells or tissue sections on the same slide or in separate wells.
- Blocking: Block all samples with an appropriate buffer (e.g., containing BSA or serum) to minimize non-specific binding. For cell types with high Fc receptor expression (e.g., monocytes, macrophages), include an Fc receptor blocking reagent in this step [89].
- Antibody Incubation:
- Experimental Sample: Apply the optimized dilution of the primary antibody in dilution buffer.
- Secondary-Only Control: Apply dilution buffer only, omitting the primary antibody.
- Washing: Wash both samples thoroughly with a wash buffer (e.g., PBS with 0.1% Tween-20).
- Secondary Antibody Incubation: Apply the same dilution of fluorophore-conjugated secondary antibody to both samples. Incubate in the dark.
- Washing and Mounting: Wash thoroughly, apply counterstains (e.g., DAPI) if required, and mount.
- Image Acquisition and Analysis: Acquire images using identical microscope and camera settings for both samples. The signal in the secondary-only control should be negligible. Any significant signal in the control channel indicates non-specific secondary antibody binding or cellular autofluorescence, which must be accounted for when setting positivity gates or thresholds in the experimental sample [89].
The Scientist's Toolkit: Essential Research Reagent Solutions
Table 2: Key Reagents for Knockout/Knockdown and Control Experiments
| Reagent / Solution | Function / Purpose | Key Considerations |
|---|---|---|
| Validated Primary Antibodies | Binds specifically to the protein target of interest. | Critical to use antibodies validated for the specific application (e.g., WB, ICC/IF) [89]. Look for genetic validation data on the manufacturer's website [87] [88]. |
| CRISPR-Cas9 System | Enables precise gene knockout for creating negative control cell lines [87]. | Requires careful sgRNA design and validation of editing efficiency. |
| siRNA/shRNA | Knocks down target gene expression at the mRNA level [87] [88]. | Requires optimization of transfection efficiency and controls for off-target effects (use scrambled siRNA) [88]. |
| Fluorophore-Conjugated Secondary Antibodies | Detects the primary antibody for visualization. | Requires titration to achieve the optimal signal-to-noise ratio [89]. Must be matched to the host species of the primary antibody. |
| Fc Receptor Blocking Reagent | Blocks non-specific binding of antibodies to Fc receptors on immune cells [89]. | Essential when working with monocytes, macrophages, or related cell lines. |
| Cell Viability Dyes (e.g., 7-AAD, DRAQ7) | Distinguishes live from dead cells during flow cytometry [89]. | Dead cells exhibit high autofluorescence and non-specific antibody binding, which can lead to false positives. |
| Compensation Beads | Used for setting compensation in flow cytometry to correct for fluorophore spectral overlap [89]. | Provide a consistent and bright signal for single-color controls. |
| Isotype Controls | Antibodies of the same isotype and conjugation as the primary antibody but with no specific target. | Help assess the level of non-specific background staining from the antibody itself. Note: They should not be used to set positive/negative gates, for which FMO controls are more appropriate [89]. |
| Fluorescence Minus One (FMO) Controls | Samples stained with all antibodies in a panel except one. | Critical for accurately defining positive and negative populations in multicolor flow cytometry experiments by accounting for fluorescence spillover [89]. |
In the field of histopathology, the ability to accurately detect protein targets, especially those present in low abundance, is crucial for advancing biomedical research and therapeutic development. Traditional Immunohistochemistry (IHC) has long been the standard technique for visualizing protein localization in tissues. However, the advent of multiplex immunofluorescence (mIF) has introduced a powerful alternative capable of simultaneously detecting multiple markers on a single tissue section. This comparative analysis examines the technical capabilities, applications, and performance of these two platforms within the specific context of low-abundance protein target research, providing researchers with a framework for selecting the most appropriate methodology for their investigative needs.
The critical challenge in studying low-abundance targets lies in the fact that signals from scarce proteins are often masked by more abundant species, a phenomenon particularly prevalent in complex tissue matrices [90]. While traditional IHC provides a straightforward, accessible method for single-target detection, mIF offers a multiparametric approach that conserves precious tissue samples and reveals critical spatial relationships between cell populations—advantages that are particularly valuable when investigating subtle molecular changes in the tumor microenvironment or signaling pathways involving rare cell subtypes [46] [91].
Technical Comparison of Platforms
Core Principles and Detection Mechanisms
Traditional IHC relies on chromogenic detection, typically using enzymes such as horseradish peroxidase to catalyze the precipitation of colored substrates like 3,3'-Diaminobenzidine (DAB) at the site of antibody binding [92]. This signal is visible under standard brightfield microscopy and produces a permanent stain resistant to photobleaching. However, the limited color palette and semi-quantitative nature of chromogenic detection restrict traditional IHC primarily to single-plex applications [50].
In contrast, multiplex immunofluorescence utilizes antibodies conjugated to fluorophores with distinct emission spectra. By employing multiple filters during image acquisition, researchers can detect several markers simultaneously on the same tissue section [92] [93]. The linear dynamic range of fluorescent signals makes mIF particularly suitable for quantification, while advanced spectral imaging and unmixing algorithms allow for the separation of overlapping signals from multiple targets [47] [50].
Comparative Performance Metrics
Table 1: Direct comparison of technical specifications between Traditional IHC and Multiplex Immunofluorescence.
| Feature | Traditional IHC | Multiplex Immunofluorescence |
|---|---|---|
| Protein Detection Capacity | One protein per sample [91] | 6–8 proteins simultaneously on one sample; up to 40-60 with cyclic approaches [92] [47] |
| Quantitative Capability | Semi-quantitative; limited dynamic range [92] | Highly quantitative; large linear dynamic range [92] |
| Spatial Resolution | Localization of single target | Detailed co-localization and spatial relationships between multiple targets [46] |
| Signal Permanence | Permanent stains resistant to photobleaching [50] | Susceptible to photobleaching; requires careful storage [50] |
| Instrumentation Requirements | Standard brightfield microscopes [50] | Specialized fluorescence microscopes and spectral imaging systems [92] [50] |
| Data Output | Colorimetric images | Multichannel fluorescence images requiring spectral unmixing [47] |
Suitability for Low-Abundance Protein Detection
The success of detecting low-abundance proteins hinges on a method's sensitivity and dynamic range. Traditional IHC can be enhanced with tyramide signal amplification (TSA) systems to boost signals for challenging targets [92]. However, the limited dynamic range of chromogenic detection may still hinder accurate quantification of subtle expression differences.
Multiplex immunofluorescence offers superior performance for low-abundance targets due to its wider dynamic range and capacity for signal amplification without substrate competition [92]. The ability to simultaneously reference housekeeping proteins or structural markers within the same section provides an internal validation framework that enhances the reliability of low-abundance target detection [46].
Experimental Protocols for Low-Abundance Target Detection
Protocol: Traditional IHC with Signal Amplification
This optimized protocol enhances sensitivity for detecting low-abundance protein targets using traditional IHC.
Day 1: Sample Preparation and Primary Antibody Incubation
- Deparaffinization and Rehydration: Bake FFPE sections at 60°C for 30 minutes. Deparaffinize in xylene (3 changes, 5 minutes each) and hydrate through graded ethanol series (100%, 95%, 70%) to distilled water.
- Antigen Retrieval: Perform heat-induced epitope retrieval using citrate buffer (pH 6.0) or EDTA buffer (pH 9.0) in a decloaking chamber or microwave (20 minutes at 95-100°C). Cool slides for 30 minutes at room temperature.
- Blocking: Incubate sections with 2.5% normal horse serum and 1% bovine serum albumin in PBS for 1 hour at room temperature to reduce non-specific binding.
- Primary Antibody Incubation: Apply species-optimized primary antibody diluted in blocking buffer overnight at 4°C in a humidified chamber.
Day 2: Signal Development and Amplification
- Detection System: Apply HRP-conjugated secondary antibody for 1 hour at room temperature.
- Signal Amplification (TSA): Enhance sensitivity for low-abundance targets using tyramide signal amplification. Incubate with tyramide working solution (1:50-1:100 dilution) for 5-10 minutes [92].
- Chromogenic Development: Apply DAB substrate for 2-10 minutes, monitoring development under a microscope.
- Counterstaining and Mounting: Counterstain with hematoxylin, dehydrate through graded alcohols and xylene, and mount with permanent mounting medium.
Protocol: Multiplex Immunofluorescence with Spectral Imaging
This protocol outlines a standardized approach for simultaneous detection of multiple low-abundance targets using mIF.
Day 1: Sequential Staining and Antibody Removal
- Sample Preparation: Follow standard deparaffinization, rehydration, and antigen retrieval as described in Section 3.1.
- Blocking: Block with 3% BSA and 0.1% Triton X-100 in PBS for 1 hour.
- Primary Antibody Incubation (Round 1): Apply first primary antibody cocktail targeting 3-4 markers, including one high-abundance reference marker. Incubate overnight at 4°C.
- Fluorophore Conjugation: Apply species-specific fluorescently labeled secondary antibodies for 1 hour at room temperature. Protect from light.
Day 2: Imaging and Striping Cycle
- Image Acquisition: Scan slides using a multispectral microscope (e.g., Vectra or comparable system) to capture the first set of signals [47].
- Antibody Elution: Remove primary-secondary antibody complexes using a low-pH stripping buffer (e.g., glycine-HCl, pH 2.0) for 15-20 minutes.
- Validation Check: Image slides again to confirm complete removal of fluorescent signals before proceeding.
- Repeat Staining Cycles: Return to step 3 (Day 1) with the next panel of primary antibodies. Repeat cycles until all targets are detected [92].
Final Day: Image Processing and Analysis
- Spectral Unmixing: Process acquired images using specialized software (e.g., InForm or comparable platform) to separate overlapping fluorescence signals [47].
- Image Registration: Align images from multiple staining cycles using reference markers or structural features.
- Quantitative Analysis: Perform single-cell segmentation and phenotyping to quantify marker expression and spatial relationships.
Diagram 1: Multiplex immunofluorescence workflow with cyclic staining. This approach enables detection of multiple targets on a single tissue section through sequential staining, imaging, and antibody removal steps.
Data Analysis and Validation Approaches
Image Processing and Quantification
The analysis of traditional IHC relies primarily on color deconvolution algorithms to separate hematoxylin and chromogen signals in brightfield images [47]. This process generates separate channels for each stain, allowing for semi-quantitative assessment of marker expression. However, the limited dynamic range and potential for color blending present challenges for accurate quantification, particularly for low-abundance targets where signal intensity may be subtle.
Multiplex immunofluorescence data requires more sophisticated spectral unmixing to separate the overlapping emission spectra of multiple fluorophores [47]. This process is essential for accurately assigning signals to specific markers, especially when detecting co-expressed targets. Advanced image analysis platforms then perform single-cell segmentation and phenotyping, enabling precise quantification of marker expression levels and spatial relationships at the cellular level.
Validation Strategies for Low-Abundance Targets
Regardless of the platform used, rigorous validation is essential when working with low-abundance protein targets. Key considerations include:
- Antibody Validation: Confirm antibody specificity using relevant controls, including knockout tissues, isotype controls, and comparison with orthogonal methods [92] [47].
- Signal-to-Noise Optimization: Titrate antibodies to achieve optimal staining with minimal background, particularly important for detecting subtle signals.
- Reprodubility Assessment: Evaluate inter-assay and intra-assay variability using control tissues included in each experiment.
- Cross-Platform Correlation: When possible, correlate findings with alternative detection methods such as RNA in situ hybridization or mass spectrometry.
Diagram 2: Image analysis workflow for multiplex immunofluorescence. This standardized pipeline transforms raw images into quantitative data, with particular importance on spectral unmixing for accurate signal separation.
Research Reagent Solutions
The success of both traditional IHC and multiplex immunofluorescence, particularly for challenging low-abundance targets, depends on carefully selected reagents and detection systems.
Table 2: Essential research reagents and their applications in immunostaining.
| Reagent Category | Specific Examples | Function and Application |
|---|---|---|
| Signal Amplification Systems | Tyramide Signal Amplification (TSA) | Enhances detection sensitivity for low-abundance targets by enzyme-mediated deposition of multiple fluorophores or chromogens [92] |
| Antibody Validation Platforms | Knockout tissues, isotype controls | Verifies antibody specificity, crucial for accurately interpreting staining patterns, especially for rare targets [92] |
| Multiplex Detection Kits | Celnovte multicolor IHC kits, Ultivue InSituPlex | Provides optimized reagent combinations for simultaneous detection of multiple targets with minimal cross-reactivity [91] |
| Automated Staining Systems | Roche DISCOVERY ULTRA, Leica BOND | Standardizes staining conditions, improves reproducibility, and manages complex multiplex protocols [46] [50] |
| Image Analysis Software | InForm, HALO, Definiens Tissue Studio | Performs critical functions including spectral unmixing, cell segmentation, and quantitative phenotyping [46] [47] |
The comparative analysis of traditional IHC and multiplex immunofluorescence reveals distinct advantages and limitations for each platform in the context of low-abundance protein detection. Traditional IHC remains a valuable, accessible method for single-target detection with permanent record-keeping, while multiplex immunofluorescence offers superior quantitative capabilities and the unique ability to visualize complex cellular interactions within the tissue architecture.
For researchers focusing on low-abundance targets, the selection between these platforms should be guided by specific experimental needs. When investigating single biomarkers with established detection protocols, traditional IHC with signal amplification provides a straightforward solution. However, when studying complex biological systems requiring analysis of multiple targets or spatial relationships, multiplex immunofluorescence offers unparalleled insights despite requiring more specialized instrumentation and analytical expertise.
As both technologies continue to evolve, advancements in signal amplification, antibody validation, and image analysis will further enhance our ability to detect and quantify elusive protein targets, ultimately deepening our understanding of cellular processes in health and disease.
Digital Pathology and Computational Image Analysis for Quantitative Assessment
The research and clinical diagnosis of low abundance protein targets present a significant challenge, requiring techniques of high sensitivity and precision. Immunostaining, a foundational method for detecting protein localization and expression levels in tissues and cells, is central to this endeavor. When combined with digital pathology and computational image analysis, it transforms into a powerful, quantitative tool capable of extracting objective, high-dimensional data from biological samples. This integration is pivotal for advancing biomarker discovery, validating drug targets, and understanding disease mechanisms at a cellular level. This Application Note provides detailed protocols and frameworks for applying digital pathology and artificial intelligence (AI)-driven image analysis to the quantitative assessment of immunostaining, with a specific focus on the challenges inherent to detecting low abundance targets. The guidance is structured to assist researchers, scientists, and drug development professionals in implementing robust, reproducible computational pathology workflows.
Key Quantitative Findings from Recent Studies
Recent studies presented at major conferences like ASCO 2025 underscore the rapid maturation and clinical utility of AI in digital pathology. The table below summarizes key quantitative findings relevant to biomarker assessment and risk stratification.
Table 1: Key Quantitative Findings from Recent AI in Digital Pathology Studies
| Cancer Type | AI Application / Biomarker | Study Findings | Clinical / Research Impact |
|---|---|---|---|
| Breast Cancer [94] | AI-assisted HER2-low & ultralow scoring | Increased pathologist agreement to 86.4% (from 73.5%) for HER2-low and 80.6% (from 65.6%) for HER2-ultralow. Misclassification of HER2-null cases decreased by 65%. | Optimizes patient identification for targeted therapies. |
| Stage III Colon Cancer [94] | CAPAI (H&E-based AI biomarker) | In ctDNA-negative patients, the CAPAI high-risk group had a 35% 3-year recurrence rate vs. 9% for low/intermediate-risk. | Identifies high-risk patients missed by ctDNA alone; enables therapy de-escalation for >50% of patients who are ctDNA-negative and CAPAI low-risk. |
| Advanced NSCLC [94] | AI spatial biomarker for immunotherapy | A 5-feature model predicting ICI outcomes achieved a hazard ratio of 5.46 for progression-free survival, outperforming PD-L1 scoring alone (HR=1.67). | Paradigm shift from protein expression to quantifying complex cellular interactions in the tumor microenvironment. |
| Prostate Cancer [94] | Multimodal AI (MMAI) for post-prostatectomy outcomes | Patients classified as MMAI high-risk had a significantly higher 10-year risk of metastasis (18% vs. 3% for low-risk). | Combines H&E images with clinical data to improve prognostic tools and guide adjuvant therapy decisions. |
| Non-Muscle Invasive Bladder Cancer [94] | AI prediction of FGFR status from H&E | The MIA:BLC-FGFR algorithm predicted FGFR alterations with 80-86% AUC. | Overcomes tissue scarcity for molecular testing; enables rapid, low-cost identification of patients for FGFR-targeted therapies. |
Experimental Protocols for Digital Pathology Analysis
The following protocols detail the workflow from sample preparation to computational analysis, with particular emphasis on optimizing for low abundance targets.
Protocol 1: Immunostaining for Low Abundance Protein Targets
Principle: This protocol utilizes the indirect immunostaining method, which offers superior sensitivity for detecting low abundance targets through signal amplification [1].
Materials:
- Primary antibody specific to the low abundance protein target
- Labeled secondary antibody (conjugated to enzyme or fluorophore)
- Appropriate blocking buffer (e.g., serum from the host species of the secondary antibody)
- Antigen retrieval solution (e.g., citrate buffer, EDTA)
- Mounting medium (with antifade agents for fluorescence)
Method:
- Sample Preparation:
- For tissues: Use formalin-fixed, paraffin-embedded (FFPE) or cryopreserved sections. For cells: Culture on coverslips and fix with paraformaldehyde [1].
- Antigen Retrieval (for FFPE tissues): Perform heat-induced or enzymatic epitope retrieval to unmask antigens cross-linked by formalin fixation. This is a critical step for low abundance targets [1].
- Blocking: Incubate samples with a compatible blocking buffer for 1 hour at room temperature to minimize nonspecific binding [1].
- Primary Antibody Incubation: Apply the optimized concentration of the primary antibody and incubate overnight at 4°C. Optimization of concentration and incubation time is essential to maximize specific signal over background.
- Washing: Wash thoroughly with buffer (e.g., PBS-T) to remove unbound primary antibodies.
- Secondary Antibody Incubation: Apply the fluorophore- or enzyme-conjugated secondary antibody. Incubate for 1 hour at room temperature in the dark.
- Signal Detection & Mounting:
- For fluorescence: Apply an antifade mounting medium to reduce photobleaching [1].
- For chromogenic detection: Apply the enzyme substrate to develop the colorimetric signal, then mount with a permanent mounting medium.
Protocol 2: Computational Image Analysis with QuPath
Principle: This protocol uses QuPath, an open-source software for digital pathology image analysis, to quantitatively analyze whole slide images (WSIs) of immunostained samples [95].
Materials:
- QuPath software (https://qupath.github.io/)
- Whole Slide Image (WSI) file (e.g., .svs, .ndpi, .qptiff)
- High-performance computer (recommended)
Method:
- Image Import and Pre-processing:
- Open QuPath and import the WSI.
- If analyzing a Tissue Microarray (TMA), use the
TMA dearrayertool to grid and identify individual cores [95]. - Manually refine the grid and exclude non-representative or damaged cores.
- Stain Separation and Color Deconvolution:
- Use the
Color Deconvolutiontool to separate the staining vectors (e.g., DAB and Hematoxylin) [95]. This ensures quantitative measurements reflect specific chromogen signal.
- Use the
- Cell Detection and Segmentation:
- Run the
Cell Detectionalgorithm. Adjust parameters (e.g., nucleus/cell expansion, intensity thresholds) to accurately segment cells, particularly those with weak staining indicative of low abundance targets.
- Run the
- Cell Classification (Machine Learning):
- Interactively train a pixel or object classifier to distinguish different cell populations (e.g., tumor vs. stromal) or staining patterns (e.g., positive vs. negative) [95].
- For more complex analyses, train a
Random Treesclassifier using features from detected cells (morphology, intensity, texture) to classify cells with high accuracy, which is crucial for heterogeneous low abundance expression [95].
- Quantitative Analysis and Data Export:
- Use the
Measurementtools to extract data such as cell density (positive cells/mm²), H-Score, or percentage of positive cells within classified populations. - Export the quantitative results for statistical analysis and visualization.
- Use the
Workflow and Signaling Pathway Visualizations
Digital Pathology Analysis Workflow
This diagram illustrates the end-to-end workflow from sample preparation to quantitative insights, integrating both laboratory and computational steps.
Title: Digital Pathology Analysis Workflow
AI Model Development and Validation Pathway
This diagram outlines the logical process for developing and validating an AI model for computational pathology, from data curation to clinical implementation.
Title: AI Model Development Pathway
The Scientist's Toolkit: Research Reagent Solutions
The table below details essential materials and tools for conducting digital pathology and computational analysis of immunostained samples.
Table 2: Essential Research Reagents and Software for Digital Pathology Analysis
| Item Name | Type/Category | Function and Application Notes |
|---|---|---|
| Primary Antibody | Biological Reagent | Specifically binds to the target low abundance protein. Critical to validate specificity and optimize concentration to minimize background [1]. |
| Fluorophore-conjugated Secondary Antibody | Biological Reagent | Binds to the primary antibody, providing a detectable signal. Using secondary antibodies from a different host species than the primary prevents cross-reactivity. Signal amplification is key for low abundance targets [1]. |
| Antifade Mounting Medium | Laboratory Supply | Preserves fluorescence signal by reducing photobleaching during microscopy and slide storage, essential for reproducible quantitative analysis [1]. |
| QuPath | Open-Source Software | A comprehensive platform for whole slide image analysis. Used for cell detection, stain separation, object classification, and batch processing to generate quantitative data from tissue images [95]. |
| Foundation Models (e.g., for WSI) | AI/ML Tool | Pre-trained deep learning models (e.g., Vision Transformers) on vast datasets of whole slide images. They serve as a starting point for developing specific AI applications, reducing the need for massive, task-specific datasets and accelerating innovation [94]. |
| Whole Slide Scanner | Hardware | A high-resolution microscope that creates a digital image of an entire glass slide, enabling storage, sharing, and computational analysis of pathological samples. |
Cross-Validation with Orthogonal Methods (e.g., Western Blot, Mass Spectrometry)
The reproducibility crisis in life science research has highlighted an urgent need for rigorous validation of analytical methods, particularly when studying low abundance protein targets. Orthogonal validation, defined as the corroboration of experimental data using methodologically independent techniques, provides a powerful framework for verifying antibody specificity and assay reliability. This approach is fundamental for generating credible data in immunostaining and other antibody-based applications, especially for low-expression targets where nonspecific binding can easily lead to false conclusions. The International Working Group on Antibody Validation (IWGAV) has recognized orthogonal strategies as one of five conceptual pillars for antibody validation, emphasizing their importance in confirming biological findings [96].
For researchers investigating low abundance proteins, implementing orthogonal controls is not merely a best practice but a scientific necessity. Proteins present in minimal quantities often represent key signaling molecules, regulators, or biomarkers with disproportionate biological significance. However, their detection pushes the limits of conventional immunoassays, increasing vulnerability to experimental artifacts. Cross-validation with orthogonal methods such as mass spectrometry provides the compelling evidence needed to confirm that observed signals genuinely represent the target of interest rather than methodological artifacts or off-target binding [97] [98].
This application note details practical protocols and methodologies for implementing orthogonal validation strategies, specifically focusing on the correlation between Western blotting and mass spectrometry for verifying low abundance protein detection. By providing structured workflows, experimental parameters, and data interpretation guidelines, we aim to equip researchers with the tools necessary to enhance the rigor and reproducibility of their protein detection studies.
Conceptual Framework: Principles of Orthogonal Validation
Defining Orthogonal Validation
In analytical chemistry and biology, orthogonal validation refers to the process of verifying experimental results using a methodology that operates on different physical, chemical, or biological principles than the primary method. For antibody-based detection techniques like Western blotting or immunostaining, this entails confirmation using non-antibody-dependent methods such as mass spectrometry, in situ hybridization, or transcriptomic analysis [96]. The fundamental premise is that while any single method may have inherent limitations or systematic biases, the convergence of data from methodologically independent approaches provides substantially greater confidence in the results.
Katherine Crosby, Senior Director of Antibody Applications & Validation at Cell Signaling Technology, aptly compares this approach to using a reference standard: "Just as you need a different, calibrated weight to check if a scale is working correctly, you need antibody-independent data to cross-reference and verify the results of an antibody-driven experiment" [96]. This calibration principle is particularly crucial when working with low abundance targets where signal-to-noise ratios are inherently challenging.
Application to Low Abundance Protein Detection
The validation of low abundance protein detection presents unique technical challenges that orthogonal strategies are particularly well-suited to address:
- Increased vulnerability to cross-reactivity: With minimal target protein present, even low-affinity non-specific binding can generate significant false-positive signals
- Signal amplification limitations: The need for enhanced sensitivity often requires extended development times or amplified detection systems, which can simultaneously amplify background noise
- Epitope accessibility issues: For low abundance targets, minor variations in sample processing can differentially affect epitope availability, leading to inconsistent results
Orthogonal validation controls for these limitations by providing an independent measurement of protein presence and quantity. When mass spectrometry (an antibody-independent method based on mass-to-charge ratios) confirms patterns observed in Western blotting (an antibody-dependent method), researchers can exclude antibody-specific artifacts as the source of their observations [96] [97].
Table 1: Orthogonal Methods for Protein Detection Validation
| Method | Principle | Applications in Validation | Advantages | Limitations |
|---|---|---|---|---|
| Mass Spectrometry (LC-MS/MS) | Protein identification via mass-to-charge ratio measurement | Direct protein identification and quantitation; confirmation of Western blot bands [97] | High specificity; multiplex capability; absolute quantitation possible | Requires specialized equipment; complex sample preparation |
| Parallel Reaction Monitoring (PRM) | Targeted MS using high-resolution accurate mass measurements | Verification of low abundance proteins in complex mixtures [99] | High sensitivity and selectivity; excellent for low abundance targets | Requires prior knowledge of target peptides |
| Transcriptomics (RNA-seq/qPCR) | Measurement of RNA expression levels | Correlation with protein expression patterns across sample panels [97] | High sensitivity; established protocols; multiple public datasets available | Assumes correlation with protein levels; post-transcriptional regulation not detected |
| In Situ Hybridization | Nucleic acid probe-based detection of RNA/DNA | Spatial correlation of protein immunostaining with mRNA expression [96] | Provides spatial context; confirms localization | Technically challenging; does not confirm translation |
| Recombinant Protein Expression | Expression of tagged target protein | Confirmation of antibody binding to correct target [100] | Controlled system; unambiguous identification | Overexpression may not reflect endogenous context |
Orthogonal Validation Workflow: Integrating Western Blot and Mass Spectrometry
Diagram 1: Integrated workflow for orthogonal validation combining Western blot and mass spectrometry approaches.
Experimental Design Considerations
Successful orthogonal validation requires careful experimental planning to ensure methodological independence while maintaining biological relevance. Key design considerations include:
Sample Selection Strategy: For initial validation studies, select sample panels with known expression variation of the target protein. Publicly available resources such as the Cancer Cell Line Encyclopedia (CCLE) or Human Protein Atlas provide transcriptomic and proteomic data that can guide the selection of cell lines with high and low expression of your target [96] [98]. Ideally, choose 3-5 cell lines with varying expression levels to establish a correlation range. This binary experimental model (high vs. low expression) provides a clear framework for validation [96].
Replication and Statistical Power: For correlation-based validation, include sufficient biological replicates to achieve statistical significance. Proteomic studies typically require n=3-5 replicates for reliable quantitation, though this may vary based on the expected effect size and technical variability of the assays [101]. Power analysis should be conducted during the experimental design phase to determine appropriate sample sizes.
Control Samples: Include both positive and negative controls in your experimental design. Positive controls confirm that your methods are working correctly, while negative controls (such as genetic knockouts or knockdowns) help identify non-specific binding or background signals [98].
Western Blot Protocol for Low Abundance Proteins
The detection of low abundance proteins via Western blot requires optimized conditions to enhance sensitivity while maintaining specificity. The following protocol has been specifically adapted for challenging targets:
Stage 1: Sample Preparation
- Use optimized lysis buffers specific to your sample source and target protein localization. RIPA buffer is commonly used, but specialized buffers may be required for membrane proteins or nuclear targets [14]
- Include broad-spectrum protease inhibitors to prevent protein degradation, especially crucial for low abundance targets [12] [14]
- Implement ultrasonication (3-second pulses, 10-second intervals, 5-15 cycles at 40 kW) to ensure complete disruption of cellular structures and release of nuclear proteins [14]
- For membrane proteins, avoid high-temperature heating which can cause aggregation. Instead, incubate samples at room temperature for 15-20 minutes or at 70°C for 10-20 minutes [14]
- Determine protein concentration using Bradford or BCA assays, and use 5× loading buffer to minimize sample dilution [14]
Stage 2: Gel Electrophoresis and Transfer
- Increase sample load to 50-100 μg per lane to enhance detection of low abundance targets [14]
- Select appropriate gel chemistry based on protein size:
- For transfer, use PVDF membranes which have higher protein binding capacity than nitrocellulose [14]. Pre-wet membranes in methanol before transfer
- Consider dry electroblotting systems which offer high transfer efficiency with minimal handling inconsistencies [12]
Stage 3: Immunodetection
- Block membranes with 5% blocking buffer for 1 hour at room temperature. Reducing blocking concentration or time may help prevent signal masking [14]
- Use higher concentrations of primary antibody than recommended for abundant targets. Incubate overnight at 4°C with gentle shaking [14]
- Employ high-sensitivity chemiluminescent substrates such as SuperSignal West Atto, which can provide over 3× more sensitivity than conventional ECL substrates [12]
- Use HRP-conjugated secondary antibodies, which enable more molecules conjugated per IgG compared to alkaline phosphatase systems, providing greater sensitivity [12]
Mass Spectrometry Verification Protocols
Mass spectrometry provides the orthogonal verification needed to confirm Western blot results through antibody-independent protein identification and quantitation.
Liquid Chromatography-Mass Spectrometry (LC-MS) Workflow:
- Protein extraction and digestion using optimized protocols for your sample type
- Liquid chromatography separation of peptides
- Mass spectrometry analysis using either:
- Data-Dependent Acquisition (DDA): For discovery proteomics; automatically selects most abundant peptides for fragmentation
- Data-Independent Acquisition (DIA): Fragments all peptides in specific mass windows; better for reproducibility
- Parallel Reaction Monitoring (PRM): Targeted approach focusing on specific peptides; highest sensitivity for verification [99]
- Database searching and protein identification
Targeted Proteomics Using Parallel Reaction Monitoring (PRM): For verification of low abundance proteins, PRM offers superior sensitivity and selectivity:
- Proteotypic peptide selection: Identify unique peptides that represent the target protein, typically 2-3 peptides per protein
- Optimized chromatography: Use longer gradients or nano-flow systems to enhance peptide separation
- High-resolution mass spectrometry: Employ instruments with high resolution and fast sequencing capabilities
- Spike-in standards: Use synthetic heavy isotope-labeled peptides as internal standards for precise quantitation [102] [99]
Capture Mass Spectrometry for Western Blot Validation: A powerful orthogonal approach involves excising protein bands from Western blots and verifying identity by mass spectrometry:
- Separate proteins by SDS-PAGE and transfer to PVDF membrane
- Perform Western blotting with target antibody
- Excise membrane regions corresponding to bands of interest
- Digest proteins directly on membrane with trypsin
- Extract peptides and analyze by LC-MS/MS
- Compare identified proteins with expected target [97]
Data Interpretation and Correlation Analysis
Quantitative Correlation Framework
The core principle of orthogonal validation lies in demonstrating correlation between antibody-based detection and antibody-independent quantification across multiple samples. This typically involves:
Expression Correlation Analysis:
- Measure protein expression by Western blot (band intensity) and mass spectrometry (peptide counts or spectral counts) across a panel of cell lines with varying expression levels
- Calculate Pearson correlation coefficient to quantify the relationship between the two measurements
- Establish a correlation threshold (typically r > 0.5-0.7) for validation, depending on sample size and expression dynamic range [97]
Molecular Weight Verification:
- Compare the apparent molecular weight from Western blot with the theoretical molecular weight from protein sequence
- Account for potential post-translational modifications that may alter migration
Table 2: Case Study - Orthogonal Validation of Nectin-2/CD112 Antibody [96]
| Cell Line | RNA Expression (nTPM) | Western Blot Result | Validation Outcome |
|---|---|---|---|
| RT4 (bladder cancer) | 146.9 | Strong band at expected MW | High expression confirmed |
| MCF7 (breast cancer) | 69.2 | Strong band at expected MW | High expression confirmed |
| HDLM-2 (Hodgkin lymphoma) | 5.2 | Minimal to no detection | Low expression confirmed |
| MOLT-4 (acute lymphoblastic leukemia) | 3.8 | Minimal to no detection | Low expression confirmed |
Troubleshooting Discordant Results
When Western blot and mass spectrometry results show poor correlation, systematic investigation is required:
Western Blot Bands Not Verified by MS:
- If bands detected by Western blot are not confirmed by mass spectrometry, this suggests antibody cross-reactivity with non-target proteins
- Excise the band and identify the actual protein by MS to determine the source of cross-reactivity
- Consider alternative antibodies or additional validation methods such as genetic knockout controls
MS Detection Without Western Blot Signal:
- If proteins are detected by MS but not Western blot, possible explanations include:
- Epitope masking during sample preparation
- Protein modifications that affect antibody binding
- Insufficient sensitivity of the Western blot protocol
- Optimize sample preparation conditions and consider signal amplification methods
Molecular Weight Discrepancies:
- Differences between expected and observed molecular weights may indicate:
- Post-translational modifications (e.g., glycosylation, phosphorylation)
- Protein cleavage or processing
- Alternative splicing isoforms
- Use enzymatic treatments (e.g., PNGase F for glycosylation) to investigate modifications
Research Reagent Solutions
Table 3: Essential Reagents for Orthogonal Validation Studies
| Reagent Category | Specific Products/Options | Application Notes |
|---|---|---|
| Protein Extraction Buffers | RIPA buffer, 1% SDS hot lysis buffer | Choose based on protein localization; include protease inhibitors [14] |
| Protease Inhibitors | Broad-spectrum protease inhibitor cocktails | Essential for preserving low abundance targets during extraction [12] |
| Gel Chemistries | Bis-Tris (6-250 kDa), Tris-Acetate (40-500 kDa), Tricine (2.5-40 kDa) | Select based on target protein size; neutral pH gels preserve protein integrity [12] |
| Membranes | PVDF for high binding capacity, nitrocellulose as alternative | PVDF requires methanol activation; superior for low abundance targets [14] |
| Validation Antibodies | CST Validated Antibodies, Invitrogen Antibodies with application-specific validation | Select antibodies with orthogonal validation data provided [96] [12] |
| Mass Spectrometry Standards | Heavy isotope-labeled synthetic peptides (PRM), TMT/Isobaric tags (quantitation) | Enable precise quantitation in targeted proteomics [102] |
| High-Sensitivity Substrates | SuperSignal West Atto Ultimate Sensitivity Substrate | Provides >3× more sensitivity than conventional ECL [12] |
| Public Data Resources | Human Protein Atlas, Cancer Cell Line Encyclopedia (CCLE), DepMap Portal | Provide orthogonal transcriptomic and proteomic data for experimental design [96] [98] |
Orthogonal validation represents a critical paradigm shift from assuming antibody specificity to experimentally verifying it through methodologically independent approaches. For researchers investigating low abundance protein targets, integrating Western blot with mass spectrometry verification provides a robust framework for confirming experimental findings and avoiding erroneous conclusions based on methodological artifacts.
The protocols and guidelines presented here offer a practical roadmap for implementing these validation strategies in both academic and industrial settings. As the scientific community continues to address challenges with research reproducibility, the adoption of rigorous orthogonal validation practices will be essential for advancing our understanding of low abundance proteins and their roles in health and disease.
By establishing correlation between antibody-dependent and antibody-independent methods across biologically diverse sample sets, researchers can build the compelling evidence necessary to confidently report findings on even the most challenging low abundance protein targets. This rigorous approach ultimately strengthens research outcomes and accelerates the translation of basic discoveries to clinical applications.
The detection of low-abundance proteins represents a significant challenge in biomedical research, particularly in the context of discovering and validating novel biomarkers for disease. In the field of myocardial infarction research, this challenge is amplified by the complex nature of the blood proteome, where potential cardiac biomarkers circulate at minute concentrations amidst highly abundant proteins like albumin [103]. This case study examines successful strategies for detecting low-abundance protein biomarkers in acute myocardial infarction (AMI), focusing specifically on the identification and validation of fatty acid binding protein 3 (FABP3) as a promising biomarker candidate. The methodologies and principles outlined herein provide a framework for researchers investigating low-abundance targets across various disease contexts, with particular relevance to immunostaining and protein detection techniques.
Case Study: FABP3 Detection in AMI Plasma
Background and Experimental Design
A 2019 proteomic study sought to identify novel plasma protein biomarkers for AMI by addressing the critical challenge of detecting low-abundance proteins in plasma, where high-abundance proteins can constitute over 90% of the total protein content, obscuring the detection of less abundant species [104]. The research team implemented a dual-strategy approach: immunodepletion of high-abundance plasma proteins followed by an isobaric tagging for relative and absolute quantitation (iTRAQ)-based quantitative proteomic analysis [104]. This experimental design enabled comprehensive profiling of the plasma proteome in AMI patients (n=10) compared to control individuals (n=5).
The methodological rigor was enhanced through careful patient selection criteria. AMI diagnosis was confirmed based on prolonged ischemic chest pain history, elevation of troponin-I and creatine kinase to more than three times the normal value, and ST-segment elevations on electrocardiogram [104]. Patients with noncardiac diseases that could potentially affect results, such as inflammatory disorders, cancer, or infection, were excluded from the study to enhance specificity.
Key Findings and Identified Biomarkers
The proteomic analysis identified 468 proteins across the samples, with 33 proteins demonstrating statistically significant differential expression in AMI patients compared to controls [104]. Among these, 12 proteins showed a ≥1.5-fold increase in AMI samples, with FABP3 emerging as the most significantly upregulated biomarker at a remarkable 6.36-fold increase [104].
Table 1: Significantly Upregulated Proteins in AMI Plasma
| Protein Name | Abbreviation | Fold Change (AMI vs Control) | Protein Category |
|---|---|---|---|
| Fatty acid binding protein 3 | FABP3 | 6.36 | Lipid metabolism |
| Creatine kinase-MB | CK-MB | 4.89 | Energy metabolism |
| Adenylate kinase 1 | AK1 | 4.16 | Energy metabolism |
| Pro-platelet basic protein | PPBP | 3.29 | Blood coagulation |
| Creatine kinase | CK | 2.88 | Energy metabolism |
| Platelet factor 4 | PF4 | 2.62 | Blood coagulation |
| Peptidyl prolyl isomerase Cyclophilin A | PPIA | 2.05 | Immune protein |
| Cofilin-1 | CFL1 | 1.81 | Cytoskeleton |
| Coronin1A | CORO1A | 1.71 | Cytoskeleton |
| Protein kinase M | PKM | 1.63 | Energy metabolism |
| Ribonuclease inhibitor | RNH1 | 1.67 | Gene regulation |
| Triose phosphate isomerase | TPI1 | 1.56 | Energy metabolism |
Table 2: Significantly Downregulated Proteins in AMI Plasma
| Protein Name | Abbreviation | Fold Change (AMI vs Control) | Protein Category |
|---|---|---|---|
| Adiponectin | ADIPOQ | 0.70 | Adipokine |
| Insulin-like growth factor binding protein 6 | IGFBP6 | 0.70 | Binding protein |
| Dickkopf-related protein 3 | DKK3 | 0.70 | Signaling protein |
| Complement 4B | C4B | 0.68 | Immune protein |
Gene Ontology (GO) analysis revealed that the most over-represented functional term was "regulation of cell proliferation" in the cellular component category [104]. The top three biological process terms identified were regulation of cell proliferation, response to wounding, and wound healing, highlighting the pathophysiological processes active in AMI [104]. The dysregulated proteins represented multiple functional categories including immune proteins, blood coagulation proteins, lipid metabolism proteins, cytoskeleton proteins, energy metabolism proteins, gene regulation proteins, and myocardial remodeling proteins, indicating the complex, multifactorial nature of AMI pathogenesis.
Detailed Experimental Protocols
Plasma Sample Preparation and High-Abundance Protein Depletion
The protocol for processing plasma samples to enhance detection of low-abundance biomarkers involves critical steps to reduce dynamic range limitations:
Sample Collection and Initial Processing: Collect blood samples in appropriate anticoagulant tubes and centrifuge at 3,000 rpm for 10 minutes at room temperature to remove cells and debris [104]. Aliquot the resulting plasma and store at -80°C until analysis.
High-Abundance Protein Depletion: Utilize a Multiple Affinity Removal System (MARS) to remove high-abundance plasma proteins [104]. Specifically:
- Add 30-120 µL of equilibration buffer (Solution A) to plasma samples
- Use 0.22 µm ultrafiltration tubes and centrifuge at 16,000 × g for 3 minutes at 4°C
- Process samples using an Agilent 1100 high-performance liquid chromatography (HPLC) system with a MARS column
- Employ a 20-minute gradient: 0.00-9.00 min Solution A, 9.00-12.50 min Solution B, and 12.60-20.00 min Solution A
- Adjust flow rates: 0.250 mL/min for 0.00-9.00 min and 1 mL/min for 9.01-20.00 min
- Collect the low-abundance protein fraction between 1.8-5 minutes [104]
Protein Quantification and Preparation: Quantify protein concentration using a BCA Protein Quantitation Kit [104]. For optimal results, use at least 5× loading buffer instead of 2× loading buffer to avoid excessive dilution of the lysate [14].
Sample Preparation Workflow
Western Blot Protocol for Low-Abundance Proteins
Detecting low-abundance proteins like FABP3 via western blot requires enhanced sensitivity and optimized conditions beyond standard protocols:
Protein Extraction and Enrichment:
- Use optimized lysis buffers specific to your sample source and target protein location [12]
- Include broad-spectrum protease inhibitors to prevent target protein degradation [14]
- For membrane proteins, avoid high-temperature heating which can cause aggregation; instead incubate at room temperature for 15-20 minutes, on ice for 30 minutes, or at 70°C for 10-20 minutes [14]
- Utilize ultrasonication to break cell clusters (3 seconds ultrasound time, 10 seconds interval, 5-15 times at 40 kW) to facilitate protein release, especially for nuclear proteins [14]
Gel Electrophoresis and Transfer:
- Increase sample load to 50-100 μg per lane on SDS-polyacrylamide gels [14]
- Use gels with 1.5 mm combs to increase loading volume capacity [14]
- Select appropriate gel chemistry: Bis-Tris gels (6-250 kDa) for general use, Tris-Acetate gels (40-500 kDa) for high molecular weight proteins, or Tricine gels (2.5-40 kDa) for low molecular weight proteins [12]
- Transfer proteins to PVDF membranes (pre-wetted in methanol) using semi-dry or wet transfer methods [14]. PVDF membranes have stronger protein binding capacity compared to nitrocellulose membranes, making them more suitable for detecting low-abundance proteins [14]
Immunodetection Optimization:
- Block membrane for 1 hour at room temperature using 5% blocking buffer [14]. Reducing blocking concentration and time can avoid signal weakening caused by excessive blocking [14].
- Use higher concentrations of primary antibody and incubate overnight at 4°C on a shaker [14]. Check the recommended dilution and reduce the dilution ratio accordingly.
- Employ a higher concentration of HRP-conjugated secondary antibody and incubate for 1 hour at room temperature on a shaker [14].
- Use high-sensitivity chemiluminescent substrates such as SuperSignal West Atto Ultimate Sensitivity Substrate, which provides over 3x more sensitivity than conventional ECL substrates [12].
Enhanced Western Blot Workflow
Advanced Nanoproteomics for Serum Biomarkers
For exceptionally low-abundance proteins directly in serum, nanoproteomics offers an advanced antibody-free approach:
Nanoparticle Synthesis and Functionalization:
- Synthesize superparamagnetic iron-oxide nanoparticles (8.0 ± 0.3 nm average diameter) [103]
- Silanize with N-(3-(triethoxysilyl)propyl)buta-2,3-dienamide (BAPTES) to create a surface with terminal allene carboxamide functional groups [103]
- Conjugate with cysteine-modified affinity peptides (e.g., HWQIAYNEHQWQC for cTnI) that target specific low-abundance proteins [103]
- Achieve surface density of approximately 0.034 μmol peptide/mg nanoparticle [103]
Serum Protein Enrichment:
- Incubate peptide-functionalized nanoparticles with serum samples
- Utilize magnetic separation to isolate nanoparticle-bound proteins
- Elute enriched low-abundance proteins for downstream analysis
This approach has demonstrated sensitivity for detecting cardiac troponin I (cTnI) at concentrations below 1 ng/mL directly from serum, despite the presence of human serum albumin which is over 10^10 times more abundant [103].
The Scientist's Toolkit: Essential Research Reagents
Table 3: Essential Research Reagents for Low-Abundance Protein Detection
| Reagent/Category | Specific Examples | Function/Purpose |
|---|---|---|
| Protein Depletion Systems | Multiple Affinity Removal System (MARS) | Removes high-abundance proteins to enhance detection of low-abundance targets [104] |
| Protease Inhibitors | Broad-spectrum protease inhibitor cocktails | Prevents degradation of low-abundance target proteins during extraction [14] [12] |
| Specialized Gels | Bis-Tris, Tris-Acetate, Tricine gels | Optimizes protein separation based on molecular weight; preserves protein integrity [12] |
| Membranes | PVDF membranes | Higher protein-binding capacity compared to nitrocellulose for enhanced detection [14] |
| Detection Substrates | SuperSignal West Atto Ultimate Sensitivity Substrate | High-sensitivity chemiluminescent substrate for low-abundance targets [12] |
| Affinity Reagents | Peptide-functionalized nanoparticles | Antibody-free enrichment of specific low-abundance proteins from complex mixtures [103] |
| Quantification Methods | iTRAQ-based quantitative proteomics | Enables multiplexed quantification of protein expression changes [104] |
Discussion and Research Implications
The successful detection of FABP3 as a low-abundance biomarker in AMI research demonstrates the critical importance of optimized methodologies for studying low-abundance proteins. The 6.36-fold upregulation of FABP3 in AMI patients suggests its potential utility as a diagnostic biomarker, while the coordinated changes in multiple protein categories provide insights into the systemic pathophysiology of myocardial infarction [104].
The technical approaches outlined in this case study—from immunodepletion strategies to enhanced western blot protocols and innovative nanoproteomics—offer researchers a toolkit for investigating low-abundance targets in various disease contexts. The integration of multiple complementary techniques appears essential for comprehensive analysis of the low-abundance proteome, as no single method can address all challenges associated with dynamic range limitations in complex biological samples.
Future directions in low-abundance protein detection will likely involve increased implementation of antibody-free enrichment strategies like nanoproteomics, which offer advantages in reproducibility, stability, and scalability compared to traditional antibody-based approaches [103]. Additionally, the development of even more sensitive detection methods and integration with emerging single-cell proteomics platforms will further enhance our ability to characterize the low-abundance proteome in health and disease.
For researchers incorporating these methodologies into immunostaining and protein detection workflows, the consistent themes of sample preparation optimization, appropriate negative controls, and method validation remain paramount. The protocols and strategies detailed in this application note provide a foundation for advancing research on low-abundance protein targets across diverse biomedical research contexts.
Conclusion
Successful immunostaining of low abundance protein targets is achievable through a multifaceted strategy that integrates foundational knowledge with advanced methodologies. The key takeaways include the paramount importance of optimizing the signal-to-noise ratio, implementing robust sample preparation and protein enrichment techniques, and applying systematic troubleshooting to overcome background and sensitivity issues. Crucially, data integrity must be ensured through rigorous validation and the use of appropriate controls. As the field advances, the integration of highly multiplexed immunofluorescence, sophisticated digital image analysis, and novel enrichment technologies will continue to push the detection boundaries, unlocking the profound potential of low abundance proteins as clinical biomarkers and therapeutic targets in biomedical research.
References
- 1. Brief guide to immunostaining - PMC [https://pmc.ncbi.nlm.nih.gov/articles/PMC11699723/]
- 2. Detection of low-abundance membrane markers by ... [https://www.sciencedirect.com/science/article/abs/pii/S002217590400153X]
- 3. Ten Approaches That Improve Immunostaining: A Review of ... [https://pmc.ncbi.nlm.nih.gov/articles/PMC8836139/]
- 4. How to choose and use antibodies | Abcam [https://www.abcam.com/en-us/technical-resources/guides/antibody-basics/how-to-choose-and-use-antibodies]
- 5. Immunofluorescence Imaging | Thermo Fisher Scientific - US [https://www.thermofisher.com/us/en/home/life-science/cell-analysis/cellular-imaging/immunofluorescence.html]
- 6. Background Staining In IHC And IF [https://vectorlabs.com/blog/my-staining-didnt-work-part-1-background-staining-in-ihc-and-if/?srsltid=AfmBOopiigxE0onNYFuRP6u9IdVSSU6h3_tUnhROCsL7BQ8fclO0Ojdh]
- 7. Detecting low abundance proteins via Western Blot [https://www.ptglab.com/news/blog/detecting-low-abundance-proteins-via-western-blot/?srsltid=AfmBOoouMd8Exbf817aMW5zi_cQ4g98asFWOWozMommj4fVJdPwIXwe9]
- 8. Facing Current Quantification Challenges in Protein ... [https://pmc.ncbi.nlm.nih.gov/articles/PMC3348655/]
- 9. Low-Abundance Protein Enrichment for Medical Applications [https://pmc.ncbi.nlm.nih.gov/articles/PMC10299117/]
- 10. A Low Cost Antibody Signal Enhancer Improves ... [https://www.sciencedirect.com/science/article/abs/pii/S0306452220300221]
- 11. Detecting low abundance proteins via Western Blot [https://www.ptglab.com/news/blog/detecting-low-abundance-proteins-via-western-blot/?srsltid=AfmBOoqDmGGwuG9irYJgk2KLFDLBTCzfCKgO9r16oFX347y6P1Pq9rkT]
- 12. Detecting Low Abundance Proteins in Western Blotting [https://www.thermofisher.com/us/en/home/life-science/protein-biology/protein-biology-learning-center/protein-biology-resource-library/pierce-protein-methods/detecting-low-abundance-proteins-in-western-blotting.html]
- 13. Optimizing immunofluorescence with high-dynamic-range ... [https://www.nature.com/articles/s41598-024-65187-x]
- 14. Western blot protocol for low abundance proteins [https://www.abcam.com/en-us/technical-resources/protocols/western-blot-protocol-for-low-abundance-proteins]
- 15. Detecting low abundance proteins via Western Blot [https://www.ptglab.com/news/blog/detecting-low-abundance-proteins-via-western-blot/?srsltid=AfmBOor6QZMf_kZZEU06ycYAYNYzpv0cRy8jGIT-WJsoNJSzp3Z-qF3W]
- 16. Common Troubleshooting Tips for Western Blot Results [https://www.bosterbio.com/blog/post/common-troubleshooting-tips-for-western-blot-results-part-1?srsltid=AfmBOorexcPnjXOpy_-MHlLFY2WrN6foWK4CtjqQ5Ko_wbjmZkXTL2wE]
- 17. Learn: immunohistochemistry [https://www.proteinatlas.org/learn/method/immunohistochemistry]
- 18. Overview of Immunostaining [https://www.cellsignal.com/applications/immunofluorescence/overview-immunofluorescence-techniques?srsltid=AfmBOoox2DtooyUt_8QtNe89dIi7gojrGxSjmmgWXtiunJX1Yg146l0H]
- 19. Optimization, Design and Avoiding Pitfalls in Manual ... [https://pmc.ncbi.nlm.nih.gov/articles/PMC6786767/]
- 20. Immunoaffinity Depletion of High-Abundance Proteins from ... [https://pubmed.ncbi.nlm.nih.gov/39715993/]
- 21. A cross-species proteomic assessment of cost-effective ... [https://bmcmethods.biomedcentral.com/articles/10.1186/s44330-025-00042-7]
- 22. Detecting low abundance proteins via Western Blot [https://www.ptglab.com/news/blog/detecting-low-abundance-proteins-via-western-blot/?srsltid=AfmBOooLtiSKz5h4P3k2PsL155EYLBlygjqVeha0lSIUoLxiQypL-vt1]
- 23. Signal amplification by cyclic extension enables high ... [https://www.nature.com/articles/s41587-024-02316-x]
- 24. Toward universal immunofluorescence normalization for ... [https://pmc.ncbi.nlm.nih.gov/articles/PMC12539234/]
- 25. calibration of color and intensity variation in whole slide ... [https://appmicro.springeropen.com/articles/10.1186/s42649-023-00091-8]
- 26. Review of immunohistochemistry techniques: Applications, ... [https://www.sciencedirect.com/science/article/abs/pii/S0740257024000467]
- 27. IHC antigen retrieval protocol [https://www.abcam.com/en-us/technical-resources/protocols/ihc-antigen-retrieval]
- 28. Optimizing HIER Antigen Retrieval for IHC [https://www.bosterbio.com/blog/post/protocol-for-optimizing-hier-antigen-retrieval-conditions?srsltid=AfmBOornvko7Z6bE3e-GaRkqXjqiiEryOdlscMa-5T2Qgo30N7z72ICG]
- 29. Introduction to Signal Amplification—Section 6.1 [https://www.thermofisher.com/us/en/home/references/molecular-probes-the-handbook/ultrasensitive-detection-technology/introduction-to-detection-methods.html]
- 30. Tyramide Signal Amplification (TSA) Methodology [https://www.news-medical.net/life-sciences/Tyramide-Signal-Amplification-(TSA)-Methodology.aspx]
- 31. TSA and Other Peroxidase-Based Signal Amplification ... [https://www.thermofisher.com/us/en/home/references/molecular-probes-the-handbook/ultrasensitive-detection-technology/tyramide-signal-amplification-technology.html]
- 32. Optimization of a thermochemical antibody stripping ... [https://pmc.ncbi.nlm.nih.gov/articles/PMC12117710/]
- 33. What is Tyramide Signal Amplification (TSA)? [https://www.aatbio.com/resources/faq-frequently-asked-questions/What-is-Tyramide-Signal-Amplification-TSA]
- 34. Detecting low abundance proteins via Western Blot [https://www.ptglab.com/news/blog/detecting-low-abundance-proteins-via-western-blot/?srsltid=AfmBOooOaNB5mTnRdUK-4z_HKu1aCK_HgS96n9bvTusG_DjCW0LWXbQ4]
- 35. Analytical techniques for nucleic acid and protein detection ... [https://pmc.ncbi.nlm.nih.gov/articles/PMC12130535/]
- 36. Practical Immunoaffinity-Enrichment LC-MS for Measuring ... [https://pmc.ncbi.nlm.nih.gov/articles/PMC4955776/]
- 37. An Enhanced Immunoaffinity Enrichment Method for Mass ... [https://www.spectroscopyonline.com/view/enhanced-immunoaffinity-enrichment-method-mass-spectrometry-based-translational-proteomics]
- 38. Digging More Missing Proteins Using an Enrichment ... [https://pubmed.ncbi.nlm.nih.gov/28960076/]
- 39. Ni-modified magnetic nanoparticles for affinity purification ... [https://pmc.ncbi.nlm.nih.gov/articles/PMC7648358/]
- 40. State of the art on the separation and purification of proteins ... [https://jnanobiotechnology.biomedcentral.com/articles/10.1186/s12951-023-02123-7]
- 41. Tips and tricks for immunoprecipitation of low abundant ... [https://www.ptglab.com/news/blog/tips-and-tricks-for-immunoprecipitation-of-low-abundant-proteins/?srsltid=AfmBOoqM1DgrnvUDsjODoI8_R-yk2m3BY1GFJU8raDXI9LnB5d798Lk1]
- 42. Preparation of Fe 3 O 4 magnetic nanomaterials for the ... [https://www.sciencedirect.com/science/article/abs/pii/S2212429224003602]
- 43. Detection of low-abundance membrane markers by ... [https://pubmed.ncbi.nlm.nih.gov/15251422/]
- 44. How to Choose the Right Fluorophore for IHC [https://www.bosterbio.com/blog/post/how-to-choose-the-right-fluorophore-for-ihc?srsltid=AfmBOop0fYb6vzbfxYKu1dy6z3FOOdXSV0bsyN4KOYb7DA-MlVCPae00]
- 45. A rapid and highly sensitive biomarker detection platform ... [https://www.nature.com/articles/s41598-020-75011-x]
- 46. Overview of multiplex immunohistochemistry ... [https://pmc.ncbi.nlm.nih.gov/articles/PMC7170662/]
- 47. Society for Immunotherapy of Cancer - PubMed Central - NIH [https://pmc.ncbi.nlm.nih.gov/articles/PMC11749220/]
- 48. A multiplexed assay for quantifying immunomodulatory ... [https://www.frontiersin.org/journals/oncology/articles/10.3389/fonc.2023.1168710/full]
- 49. High-Throughput, High-Multiplex Digital Protein Detection ... [https://pmc.ncbi.nlm.nih.gov/articles/PMC9499451/]
- 50. Why Multiplex & Chromogenic vs Immunofluorescent ... [https://www.leicabiosystems.com/us/articles/ls-articles/tips-tricks-to-multiplexing-top-5-reasons-to-multiplex-and-chromogenic-versus/]
- 51. Spatial proteomics: unveiling the multidimensional landscape ... [https://pmc.ncbi.nlm.nih.gov/articles/PMC11416001/]
- 52. Quantitative, Multiplexed Assays for Low Abundance ... [https://pmc.ncbi.nlm.nih.gov/articles/PMC2435059/]
- 53. Multiplexed relative and absolute quantitative ... [https://www.nature.com/articles/s41467-020-16588-9]
- 54. IHC Troubleshooting Guide | Common Issues & Fixes [https://www.bosterbio.com/protocol-and-troubleshooting/ihc-troubleshooting?srsltid=AfmBOoooRUxYCv6_rlYPGtqwzbNccytk4bao2McPT-29AByPmdvkCfuo]
- 55. High background in immunohistochemistry [https://www.abcam.com/en-us/technical-resources/troubleshooting/high-background-in-immunohistochemistry]
- 56. Ultimate IHC Troubleshooting Guide: Fix Weak Staining & ... [https://www.atlasantibodies.com/knowledge-hub/blog/the-ultimate-ihc-troubleshooting-guide-from-weak-staining-to-high-background/]
- 57. How to Avoid or Reduce High Background in ... [https://www.linkedin.com/pulse/how-avoid-reduce-high-background-immunohistochemistry-huang-md-phd-xtvpe]
- 58. Background Staining In IHC And IF [https://vectorlabs.com/blog/my-staining-didnt-work-part-1-background-staining-in-ihc-and-if/?srsltid=AfmBOooKoTucpTsYKrWRBYVh3Wc6QLjnoO6xf3FGBhe7dzYZ-wRg00T9]
- 59. IHC Troubleshooting Guide [https://www.thermofisher.com/us/en/home/life-science/protein-biology/protein-biology-learning-center/protein-biology-resource-library/pierce-protein-methods/ihc-troubleshooting-guide.html]
- 60. Reduction of High Background Staining by Heating ... [https://pmc.ncbi.nlm.nih.gov/articles/PMC2569902/]
- 61. Comparison of multiple quantitative strategies for ... [https://pmc.ncbi.nlm.nih.gov/articles/PMC12456881/]
- 62. Comparisons of quantitative approaches for assessing ... [https://www.nature.com/articles/s41598-022-23091-2]
- 63. Antibody Titration | McGovern Medical School [https://med.uth.edu/imm/flow-cytometry-services/protocols-and-guidelines/antibody-titration/]
- 64. 7 Tips for Optimizing Your Flow Cytometry Experiments [https://www.bdbiosciences.com/en-us/learn/science-thought-leadership/blogs/optimizing-tips-flow-cytometry-experiments]
- 65. Proof of the Quantitative Potential of Immunofluorescence ... [https://pmc.ncbi.nlm.nih.gov/articles/PMC5334147/]
- 66. Sheet Protector Strategy for Western Blot to Reduce ... [https://pmc.ncbi.nlm.nih.gov/articles/PMC12462392/]
- 67. Western Blot: The Complete Guide [https://www.antibodies.com/applications/western-blotting]
- 68. Optimization of the Blocking and Signal Preservation ... [https://pubmed.ncbi.nlm.nih.gov/40996492/]
- 69. Quantitative differences among various proteins as ... [https://pubmed.ncbi.nlm.nih.gov/3611792/]
- 70. Reduction of non-specific adsorption in label-free assays ... [https://www.sciencedirect.com/science/article/pii/S0925400522002994]
- 71. Blocking with immunizing peptide protocol [https://www.abcam.com/en-us/technical-resources/protocols/blocking-with-immunizing-peptides]
- 72. Visualizing Low-Abundance Proteins and Post ... [https://pubmed.ncbi.nlm.nih.gov/38314809/]
- 73. Detecting low abundance proteins via Western Blot [https://www.ptglab.com/news/blog/detecting-low-abundance-proteins-via-western-blot/?srsltid=AfmBOoo2X0VV3UydsLN3mLRyqGfm8aawTChkq6smhCiVRFL1H-Lfb3MC]
- 74. Characterizing and Quenching Autofluorescence in Fixed ... [https://pmc.ncbi.nlm.nih.gov/articles/PMC9968082/]
- 75. A robust method for autofluorescence-free ... [https://www.nature.com/articles/s41598-025-89142-6]
- 76. How Quenching Tissue Autofluorescence Works [https://www.labmanager.com/how-quenching-tissue-autofluorescence-works-2094]
- 77. Guide To Selecting Fluorophores for ICC and IHC [https://fluorofinder.com/fluorophore-selection-icc-ihc/]
- 78. Selecting Fluorophores for Antibody-based Research [https://www.jacksonimmuno.com/secondary-antibody-resource/immuno-techniques/selecting-fluorophores/]
- 79. Anti fluorescence quenching sealing agent (including DAPI) [https://www.life-ilab.com/en/products/show-480.html]
- 80. Antigen Retrieval in IHC: Why It Matters and How to Get ... [https://www.atlasantibodies.com/knowledge-hub/blog/antigen-retrieval-in-ihc-why-it-matters-and-how-to-get-it-right/]
- 81. Comparison of Antigen Retrieval Methods for ... [https://www.mdpi.com/2409-9279/7/5/67]
- 82. Immunoelectron microscopy: a comprehensive guide from ... [https://pmc.ncbi.nlm.nih.gov/articles/PMC12420552/]
- 83. Exploring the Effects of Novel Food Processing Methods on ... [https://pmc.ncbi.nlm.nih.gov/articles/PMC12152504/]
- 84. Nutrient Stability and Degradation in Food Processing [https://www.labmanager.com/nutrient-stability-and-degradation-in-food-processing-34284]
- 85. Western Blot - StatPearls - NCBI Bookshelf - NIH [https://www.ncbi.nlm.nih.gov/books/NBK542290/]
- 86. Comprehensive Optimization of Western Blotting [https://www.mdpi.com/2310-2861/9/8/652]
- 87. and Knockout Antibody Knockdown Validation [https://www.thermofisher.com/cn/en/home/life-science/antibodies/invitrogen-antibody-validation/knockout-knockdown-antibody-validation.html]
- 88. siRNA Knockdown | Proteintech Group [https://www.ptglab.com/support/sirna-knockdown/]
- 89. Recommended controls for flow cytometry [https://www.abcam.com/en-us/technical-resources/guides/flow-cytometry-guide/recommended-controls-for-flow-cytometry]
- 90. Impact of Sample Preparation Strategies on the ... [https://pmc.ncbi.nlm.nih.gov/articles/PMC12418494/]
- 91. Multiplex Immunohistochemistry vs. Traditional IHC [https://www.celnovte.com/solution/multiplex-immunohistochemistry-vs-traditional-ihc-whats-the-difference/]
- 92. Multiplexing Techniques for IHC and IF | CST Blog [https://blog.cellsignal.com/pros-and-cons-of-different-multiplexing-techniques]
- 93. How Immunofluorescence Assay Works — In One Simple ... [https://www.linkedin.com/pulse/how-immunofluorescence-assay-works-one-simple-flow-dmmnf/]
- 94. Digital Pathology and AI Highlights from ASCO 2025 [https://proscia.com/digital-pathology-and-ai-highlights-from-asco-2025/]
- 95. QuPath: Open source software for digital pathology image ... [https://www.nature.com/articles/s41598-017-17204-5]
- 96. Antibody Validation Essentials: Orthogonal Strategy - CST Blog [https://blog.cellsignal.com/hallmarks-of-validation-orthogonal-strategy]
- 97. Enhanced validation of antibodies for research applications [https://pmc.ncbi.nlm.nih.gov/articles/PMC6175901/]
- 98. Antibody validation for Western blot: By the user, for the user [https://pmc.ncbi.nlm.nih.gov/articles/PMC6983856/]
- 99. Detection and Quantitation of Small Proteins Using Mass ... [https://www.sciencedirect.com/science/article/pii/S1535947625001513]
- 100. How and why you should validate your antibodies [https://azurebiosystems.com/blog/quantitative-western-blotting-how-and-why-you-should-validate-your-antibodies/]
- 101. Tutorial: best practices and considerations for mass ... [https://www.nature.com/articles/s41596-021-00566-6]
- 102. Mass spectrometry based biomarker discovery, verification ... [https://pmc.ncbi.nlm.nih.gov/articles/PMC5528535/]
- 103. Nanoproteomics enables proteoform-resolved analysis of ... [https://www.nature.com/articles/s41467-020-17643-1]
- 104. Discovery of potential plasma protein biomarkers for acute ... [https://pmc.ncbi.nlm.nih.gov/articles/PMC6790472/]