Antibody Validation for Immunohistochemistry: A Comprehensive Guide to Protocols, Pitfalls, and Best Practices
This article provides a comprehensive guide to antibody validation protocols for immunohistochemistry (IHC), tailored for researchers, scientists, and drug development professionals.
Antibody Validation for Immunohistochemistry: A Comprehensive Guide to Protocols, Pitfalls, and Best Practices
Abstract
This article provides a comprehensive guide to antibody validation protocols for immunohistochemistry (IHC), tailored for researchers, scientists, and drug development professionals. It covers the foundational principles of validation, including the critical distinction from verification and optimization. The guide details established methodological frameworks like the 'Five Pillars' and stepwise approaches for application-specific testing. It further addresses common troubleshooting scenarios and protocol optimization techniques to enhance specificity and sensitivity. Finally, it outlines the latest regulatory and comparative validation standards, including updates from the College of American Pathologists (CAP) and strategies for predictive marker assays. By synthesizing current guidelines and practical strategies, this resource aims to empower professionals to implement robust validation practices, ensuring the reliability and reproducibility of IHC data in both research and clinical contexts.
Laying the Groundwork: Core Principles and Definitions of IHC Antibody Validation
In the field of immunohistochemistry (IHC) research, the reliability of experimental results and the validity of diagnostic biomarkers are fundamentally dependent on rigorous antibody validation. As the research community continues to address challenges related to reproducibility, establishing standardized validation protocols has become increasingly critical. Antibody validation is a comprehensive process that demonstrates an antibody is specific for its target, sensitive enough to detect the target at biologically relevant levels, and capable of producing reproducible results across repeated experiments [1]. For researchers and drug development professionals, implementing systematic validation protocols ensures that IHC-based data accurately reflects biological reality, ultimately supporting robust scientific conclusions and informed clinical decisions.
This guide provides a comparative analysis of antibody validation approaches, focusing on the core pillars of specificity, sensitivity, and reproducibility within IHC applications. We examine experimental methodologies, present quantitative performance data, and outline structured frameworks adopted by leading organizations to establish standardized validation practices in histopathology research.
Core Principles of Antibody Validation
The Three Pillars of Validation
Antibody validation for IHC applications rests on three fundamental principles that collectively ensure reliable performance:
- Specificity: The ability of an antibody to bind exclusively to its intended target antigen, demonstrated through various experimental techniques that confirm absence of cross-reactivity with non-target proteins [1].
- Sensitivity: The lowest level at which an antibody can reliably detect its target antigen, reflecting the detection threshold and dynamic range appropriate for the biological context [1].
- Reproducibility: The consistency of antibody performance across different lots, experimental conditions, time points, and operators, ensuring that results are reliable and repeatable [2] [1].
Regulatory and Standards Framework
Recent updates to validation guidelines reflect the evolving landscape of IHC applications. The College of American Pathologists (CAP) released updated principles in 2024 that harmonize validation requirements for predictive markers, establish specific guidelines for cytology specimens, and standardize concordance rates at 90% for all IHC assays [3]. These evidence-based recommendations provide a framework for laboratories to enhance the quality and safety of clinically important assays, though adoption remains voluntary unless incorporated into specific accreditation requirements.
Comparative Analysis of Antibody Performance
The performance characteristics of antibodies vary significantly based on their production methodology and validation rigor. The table below summarizes key differences between major antibody classes:
Table 1: Performance Comparison of Antibody Types in IHC Applications
| Parameter | Recombinant Monoclonal Antibodies | Traditional Monoclonal Antibodies | Polyclonal Antibodies |
|---|---|---|---|
| Specificity | High (defined amino acid sequence) [2] | High (single epitope) [4] | Variable (multiple epitopes) [4] |
| Sensitivity | Consistent, optimized during development | Variable between clones | Generally high [4] |
| Reproducibility | Excellent (no lot-to-lot variation) [2] | Good (with proper hybridoma banking) | Poor (significant lot-to-lot variation) |
| Success Rate in FFPE | High (engineered for formalin-resistant epitopes) | ~50% success rate [4] | 60-75% success rate [4] |
| Cross-reactivity | Minimal (BLAST analysis of peptide sequence) [4] | Low | Higher potential [4] |
| Long-term Supply | Guaranteed (sequence preserved) | Conditionally guaranteed | Not guaranteed |
The move toward recombinant antibody technology represents a significant advancement in addressing reproducibility challenges. Recombinant antibodies are produced through gene cloning, which ensures precise amino acid sequences and eliminates the biological variability inherent in traditional hybridoma-based methods [2]. One leading provider reports that nearly 99% of their new antibodies are now produced using recombinant technology, reflecting the industry's commitment to overcoming the reproducibility crisis [2].
Experimental Protocols for Antibody Validation
Tiered Validation Framework
A consensus approach developed by academic and pharmaceutical histopathology researchers proposes a tiered system for antibody validation [1]. The degree of validation required is proportionate to an antibody's placement within this framework:
- Tier 1: Well-characterized antibodies with substantial high-quality literature evidence
- Tier 2: Established antibodies used in alternative species or unvalidated tissue types
- Tier 3: Unknown antibodies with inconsistent or no literature evidence
Stepwise Validation Methodology
A comprehensive validation protocol involves multiple experimental approaches to address specificity, sensitivity, and reproducibility:
1. Target Characterization A thorough literature review using databases such as OMIM, Uniprot, and Genecards establishes expected expression patterns, biological relevance, and subcellular localization [1]. This foundational knowledge informs validation design and helps identify non-specific interactions.
2. Control Material Identification Positive and negative control materials are critical for validation [1]. These may include:
- Cultured cell lines with known expression profiles
- FFPE cell blocks processed to mimic tissue samples
- Tissue microarrays (TMAs) containing multiple tissue types
- CRISPR-Cas9 engineered cells for target confirmation [5]
3. Specificity Validation
- Western Blot Analysis: Demonstrates specific bands at appropriate molecular weights with minimal cross-reactivity [6] [1].
- Cell Line Validation: Using transfected cell lines expressing different target levels or siRNA knockdown to confirm target specificity [1] [4].
- Blocking Peptides: Competition experiments with target peptides verify specificity and rule out Fc-mediated binding [6].
- BLAST Analysis: For peptide-targeting antibodies, sequence similarity searches confirm peptide uniqueness [4].
4. IHC Optimization and Validation
- Antigen Retrieval Optimization: Testing multiple retrieval conditions to maximize signal-to-noise ratio [1].
- Titration Studies: Determining optimal antibody concentration using a range of dilutions [4].
- Tissue Staining Pattern Assessment: Comparing results with expected architectural and subcellular localization [3] [1].
- Multi-tissue Validation: Testing antibody performance across a broad spectrum of tissue types [6] [4].
Table 2: Key Validation Experiments and Their Applications
| Validation Method | Primary Application | Data Output | Considerations |
|---|---|---|---|
| Western Blot | Specificity confirmation | Molecular weight confirmation | Poor predictor of IHC performance [4] |
| Cell Pellet Arrays | Specificity, optimal dilution | Staining pattern in defined systems | Must mimic tissue processing [1] |
| Tissue Microarrays | Broad tissue performance | Staining across multiple tissues | Efficient use of tissue resources [1] |
| Blocking Peptides | Specificity confirmation | Loss of staining with competitor | Rules out non-specific binding [6] |
| Xenograft Models | Performance in disease models | Staining in relevant pathology | Verifies target specificity [6] |
Analytical Techniques for Characterization
Advanced analytical techniques provide quantitative data on antibody performance:
High-Resolution Mass Spectrometry (HRMS) HRMS offers unparalleled precision in identifying post-translational modifications and determining molecular weights, ensuring batch-to-batch consistency of therapeutic antibodies [5].
Analytical Affinity Chromatography Optimized using design of experiments (DoE) approaches, this method enables accurate quantification of tagged products with high specificity, linearity, accuracy, and precision [7]. Validated according to International Conference on Harmonisation Q2(R2) guidelines, it achieves minimal analyte carryover (98.8 ± 0.1% product elution) and superior performance compared to traditional ELISA methods [7].
Pull-Down Assays As a form of affinity purification, pull-down assays confirm protein-protein interactions using tagged "bait" proteins captured on immobilized affinity ligands [8]. This technique is particularly valuable for investigating the activation status of specific proteins, such as GTPases cycling between GTP-bound (active) and GDP-bound (inactive) states [8].
Research Reagent Solutions
The following table outlines essential reagents and their functions in antibody validation workflows:
Table 3: Essential Research Reagents for Antibody Validation
| Reagent Category | Specific Examples | Primary Function |
|---|---|---|
| Control Materials | FFPE cell pellets, tissue arrays, xenografts [6] [1] | Provide known positive/negative samples for specificity testing |
| Detection Systems | HRP-DAB, alkaline phosphatase-Vector Red, fluorescent tags [9] [4] | Enable visualization of antibody-antigen binding |
| Affinity Matrices | Glutathione agarose, nickel/cobalt chelate, streptavidin beads [8] | Immobilize bait proteins for interaction studies |
| Validation Antibodies | Cytokeratin, vimentin, CD markers, phospho-tyrosine [1] [4] | Assess tissue quality and antigen preservation |
| Tagging Systems | GST, polyHis, biotin tags [8] | Facilitate purification and detection of recombinant proteins |
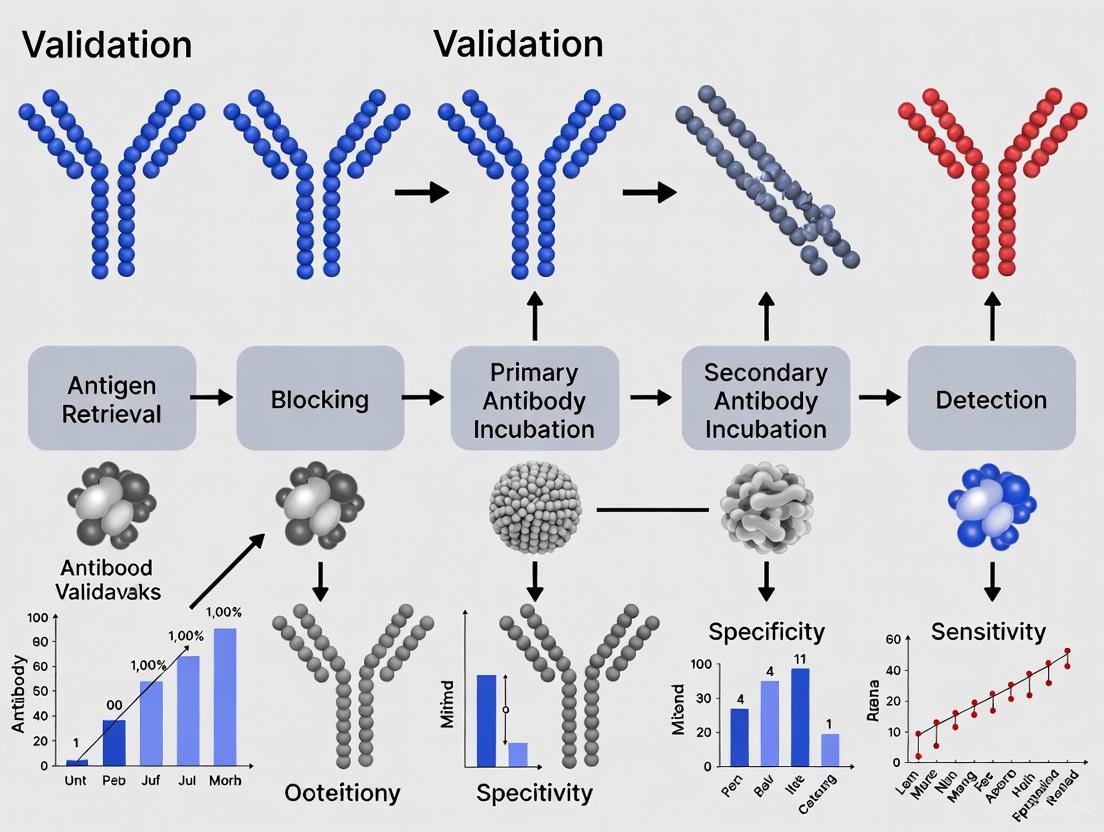
Validation Workflow and Decision Pathways
The antibody validation process follows a logical sequence from initial target characterization through final implementation. The diagram below illustrates this workflow, highlighting key decision points and methodological selections:
Validation Workflow Diagram: This flowchart illustrates the systematic approach to antibody validation, from initial target characterization through final implementation, including key methodological considerations and assessment criteria.
Emerging Technologies and Future Directions
The field of antibody validation continues to evolve with several emerging technologies shaping future practices:
Recombinant Antibody Technologies Recombinant antibodies represent the present and future of reliable antibody reagents, with their precise gene cloning enabling exceptional reproducibility and eliminating lot-to-lot variability [2]. Leading suppliers have committed to this technology, with nearly 99% of new antibodies now produced using recombinant methods [2].
Automation and Artificial Intelligence The integration of automation and AI is transforming characterization processes by enhancing efficiency, accuracy, and predictive capabilities [5]. Machine learning algorithms can predict chemical properties, binding affinities, and toxicity profiles from large datasets, while automated platforms improve reproducibility in high-throughput screening and sample preparation [5].
Advanced Characterization Platforms Next-generation platforms offer improved sensitivity and resolution for antibody characterization:
- Hydrogen-deuterium exchange mass spectrometry (HDX-MS): Provides insights into antibody stability and conformational dynamics [5].
- Cryo-electron microscopy (cryo-EM): Enables high-resolution structural imaging of antibody-antigen interactions [5].
- High-resolution mass spectrometry: Delivers unparalleled precision in identifying post-translational modifications [5].
Comprehensive antibody validation encompassing specificity, sensitivity, and reproducibility is fundamental to advancing IHC research and biomarker development. The comparative data and methodologies presented in this guide demonstrate that recombinant antibody technologies consistently outperform traditional alternatives in critical validation parameters, particularly in addressing the reproducibility challenges that have plagued historical research efforts.
As the field evolves, adherence to standardized validation frameworks—such as the tiered approach and CAP guidelines—provides a pathway toward more reliable research outcomes. The implementation of robust validation protocols, supported by emerging technologies in automation, AI, and advanced analytics, will continue to enhance the quality of IHC data, ultimately accelerating drug development and improving diagnostic accuracy for research and clinical applications.
In the rigorous field of immunohistochemistry (IHC) research, the reliability of experimental data is paramount. Inconsistent antibody performance is a major contributor to the scientific reproducibility crisis, potentially wasting billions of dollars annually and leading to erroneous conclusions [10]. A foundational step to mitigating this risk lies in understanding and implementing three distinct but often confused processes: validation, verification, and optimization. For researchers, scientists, and drug development professionals, applying these concepts correctly is not merely a matter of semantics but a critical component of robust experimental design and trustworthy antibody validation protocols. This guide provides a detailed, objective comparison of these processes, framed within the context of IHC research, to empower professionals in building a solid foundation for their scientific discoveries.
Definitive Meanings: A Comparative Framework
The terms validation, verification, and optimization describe different levels of assurance regarding an antibody's performance. Their specific definitions, triggers, and regulatory standing are distinct [11] [12].
The table below summarizes the core objectives and drivers for each process.
| Process | Core Objective | When It Is Required | Regulatory & Standard Drivers |
|---|---|---|---|
| Validation | To establish performance specifications for a new test through rigorous evidence [11]. | Introducing a new test, antibody, or clone; a new platform; a different fixative; or decalcification process [12]. | CLIA § 493.1253; CAP: ANP.22750, ANP.22978 [12]. |
| Verification | To confirm that a previously validated test performs as expected after a minor change [11]. | Changing antigen retrieval methods; switching manufacturers for an established clone; lot-to-lot checks [12]. | CLIA § 493.1253; CAP: ANP.22750, ANP.22978 [12]. |
| Optimization | A trial-and-error phase to fine-tuning protocols for the best staining results [12]. | Introducing a new antibody/clone; adjusting pre-analytical factors (fixation times); pathologist-requested stain changes [12]. | Considered a pre-validation/verification activity; governed by internal lab SOPs. |
Optimization is a trial-and-error phase where protocols are fine-tuned to achieve the best possible staining results in terms of specificity and signal strength. This process is a prerequisite before any formal validation or verification can begin and involves tweaking parameters like antibody dilution, incubation times, and antigen retrieval methods [12].
Validation is the comprehensive process of establishing performance specifications for a new test through the provision of objective evidence that it meets the requirements for its intended use [11]. In IHC, this is required for laboratory-developed tests (LDTs) and any modification to an FDA-cleared/approved assay. The updated CAP guidelines emphasize rigorous study design, often requiring a minimum of 20 positive and 20 negative cases for predictive markers and setting a 90% concordance threshold for all IHC assays [3] [11].
Verification is the process of confirming that a previously validated test or assay performs as expected in your laboratory after a minor change. It is generally less extensive than validation. For example, when using an unmodified FDA-cleared/approved assay, a laboratory performs verification to ensure the test performs as stated by the manufacturer. Similarly, checking a new lot of an established antibody or verifying a test on a new control block falls under verification [11] [12].
Diagram 1: Decision workflow for optimization, validation, and verification.
Experimental Protocols and Data Standards
The experimental design and required evidence for validation, verification, and optimization differ significantly in scope and stringency. Adherence to established guidelines is critical for assay acceptance.
Validation Protocols and Concordance Standards
For IHC assay validation, the College of American Pathologists (CAP) provides definitive guidelines. The process requires testing on cases with predetermined expected results. The nature and number of these cases depend on the assay type [11]:
- Predictive markers (e.g., HER2, PD-L1): A minimum of 20 positive and 20 negative cases is recommended.
- Non-predictive markers: A minimum of 10 positive and 10 negative cases is recommended.
The updated 2024 CAP guideline harmonizes the concordance requirement for all IHC assays to a minimum of 90% when compared to a predetermined standard [3]. The selection of an appropriate comparator is vital for validation study design. CAP guidelines list several options, ordered here from most to least stringent [3]:
- Comparison to IHC results from cell lines with known amounts of protein ("calibrators").
- Comparison with a non-immunohistochemical method (e.g., flow cytometry, FISH).
- Comparison with results from another laboratory using a validated assay.
- Comparison with prior testing of the same tissues in the same laboratory.
For assays on cytology specimens or tissues fixed in alternative fixatives, a separate validation with a minimum of 10 positive and 10 negative cases is required due to variable sensitivity compared to standard FFPE tissues [3].
Verification and Optimization Procedures
Verification of an FDA-cleared/approved assay should follow the manufacturer's instructions. If these are absent, the process often adopts the principles of validation, with the laboratory director determining the appropriate number of samples [11]. A typical verification for a new antibody lot might involve running a small set of known positive and negative controls alongside the old lot to ensure staining consistency.
Optimization is an iterative process without a fixed sample number. It begins with selecting an appropriate tissue known to express the target antigen and a negative control. The manufacturer's protocol is followed initially, and conditions are adjusted as needed. This includes varying antibody dilution, incubation time, and antigen retrieval parameters (e.g., pH of retrieval buffer, method of heat induction) until a specific staining pattern with minimal background is achieved [11] [13].
The Scientist's Toolkit: Essential Research Reagent Solutions
Successful IHC experiments rely on a suite of critical reagents and materials. The table below details key components and their functions in the experimental workflow.
| Tool/Reagent | Function & Role in IHC Workflow |
|---|---|
| Primary Antibodies | The core reagent that specifically binds to the target protein (antigen). Rigorous validation for IHC application is critical [13]. |
| Detection Kit | Contains secondary antibodies and detection enzymes (e.g., HRP) or fluorophores to visualize the primary antibody binding [13]. |
| FFPE Tissue Sections | Formalin-Fixed Paraffin-Embedded tissues are the most common sample type, preserving tissue architecture for analysis [13]. |
| Antigen Retrieval Buffers | Critical solutions (e.g., Citrate pH 6.0, EDTA pH 8.0) used to unmask epitopes cross-linked during fixation, making them accessible to antibodies [13]. |
| Blocking Serum | A protein solution used to cover non-specific binding sites on the tissue, reducing background noise and improving signal-to-noise ratio [13]. |
| Counterstains | Dyes like Hematoxylin that stain cell nuclei, providing histological context for the protein localization revealed by IHC [13]. |
| Mounting Medium | Aqueous or permanent media used to preserve the stain and optimize the refractive index for microscopy after applying a coverslip [13]. |
| CRISPR-Cas9 KO Cell Lines | Genetically engineered cells used as a gold-standard negative control to confirm antibody specificity by showing signal loss when the target gene is knocked out [10] [14]. |
Advanced Considerations and Future Directions
The field of antibody validation is evolving, with new guidelines and techniques enhancing reproducibility. A significant update in the 2024 CAP guideline is the requirement to separately validate each assay-scoring system combination for predictive markers like HER2 and PD-L1, which employ different scoring systems based on tumor site or type [3].
Furthermore, the distinction between immunohistochemistry (IHC) and immunocytochemistry (ICC) is crucial. IHC is performed on tissue sections, preserving extracellular architecture, while ICC is used on individual cells without a matrix. Experts increasingly recommend precise nomenclature: using "immunohistofluorescence" or "immunocytofluorescence" to clarify both the sample type and detection method, which is critical for validation and reproducibility [15].
Leading antibody manufacturers are now adopting multi-pillar validation strategies, such as knockout/knockdown controls, orthogonal methods, and immunoprecipitation followed by mass spectrometry (IP/MS), to provide higher confidence in antibody specificity [14] [16]. Community efforts and open science initiatives, which share large-scale antibody characterization data openly, are also pivotal for the future of reproducible research [10].
Navigating the critical distinctions between validation, verification, and optimization is a non-negotiable skill for researchers in immunohistochemistry. Validation provides the foundational evidence for a new test, verification ensures an established test works in a new context, and optimization fine-tunes the protocol for optimal results. By adhering to updated guidelines, employing rigorous experimental designs, and leveraging well-characterized reagents, the scientific community can significantly enhance the reliability of IHC data, thereby accelerating drug development and ensuring the integrity of research outcomes.
For antibodies used in immunohistochemistry (IHC), confirming that the antibody binds specifically to its intended target is paramount. This process, known as epitope characterization, lies at the core of antibody validation and ensures that the staining observed in tissue samples is accurate and biologically meaningful. An epitope is the specific region of an antigen recognized by an antibody [17]. Thorough epitope characterization is a critical step in developing reliable IHC biomarkers for both research and clinical decision-making, such as guiding targeted therapies for cancer [1].
This guide objectively compares the performance of various epitope characterization methods, from traditional experimental techniques to modern computational approaches, providing researchers with the data needed to select the right tools for their antibody validation protocols.
Comparative Analysis of Epitope Characterization Methods
The field of epitope characterization offers a diverse toolkit, each method with distinct strengths, limitations, and performance metrics. The table below provides a comparative overview of popular and emerging techniques.
Table 1: Performance Comparison of Epitope Characterization Methods
| Method | Key Principle | Typical Application in IHC Validation | Key Performance Metrics | Notable Tools/Examples |
|---|---|---|---|---|
| Blocking Peptides [18] | Competes with target epitope for antibody binding. | Verification of antibody specificity in IHC. | Qualitative (yes/no) specificity confirmation. | Peptide pre-incubation control [18]. |
| DECODE [19] | High-throughput epitope mapping via mRNA display. | Precise, single amino acid resolution epitope mapping for monoclonal/polyclonal antibodies. | Single amino acid resolution; predicts cross-reactivity. | Applied to develop improved 3D immunostaining [19]. |
| X-ray Crystallography [20] | Determines atomic structure of antibody-antigen complex. | Gold standard for definitive epitope mapping. | Atomic-level resolution. | Laborious and low-throughput [20]. |
| Deep Mutational Scanning (DMS) [20] | High-throughput experimental screening of all possible single-point mutations. | Fine-grained functional epitope mapping. | High-throughput; functional impact data. | Can yield false positives due to allostery or stability effects [20]. |
| AlphaFold 3 (AF3) + AbEMap [20] | AI-based co-folding of Ab-Ag complex and epitope prediction. | In silico epitope prediction when only sequences are known. | ROC AUC: 0.62; PR AUC: 0.22 [20]. | Superior performance among computational methods [20]. |
| AbEMap (Docking-based) [20] | Computational docking and template-based modeling. | In silico epitope prediction with known antigen and antibody structures. | ROC AUC: 0.55; PR AUC: 0.16 [20]. | Antibody-specific prediction [20]. |
| DiscoTope [20] | Machine learning on antigen structure features. | Antibody-agnostic conformational epitope prediction. | ROC AUC: ~0.60 (as reported in original publication) [20]. | Popular antibody-agnostic tool [20]. |
Performance Data and Experimental Validation
Quantitative Performance of Computational Tools
Computational methods for B-cell epitope prediction have evolved significantly, yet their accuracy varies. A recent evaluation on a benchmark set of antibody-antigen complexes revealed that a combined pipeline using AlphaFold 3 for complex structure prediction and AbEMap for epitope analysis achieved the highest accuracy among the methods tested, with a ROC AUC of 0.62 and a PR AUC of 0.22 [20]. This performance was substantially better than docking-based AbEMap (ROC AUC: 0.55) or standalone antibody-agnostic tools like DiscoTope [20]. It is important to note that while these tools provide valuable insights, their predictions still require experimental validation [20].
The Critical Role of Experimental Validation
For IHC, computational predictions are a starting point. Specificity must be confirmed experimentally. A key validation step is the use of blocking peptides, where pre-incubating the antibody with its target peptide should abolish or significantly reduce IHC staining, confirming that the signal is specific [18]. Furthermore, guidelines from the College of American Pathologists (CAP) recommend comparing IHC results with other non-immunohistochemical methods, such as flow cytometry or fluorescent in-situ hybridization, to build confidence in the antibody's performance [3].
Table 2: Key Experimental Validation Protocols for IHC Antibodies
| Validation Protocol | Detailed Methodology | Interpretation of Results for Specificity |
|---|---|---|
| Blocking Peptide Assay [18] | 1. Incubate the primary antibody with a molar excess of the target antigen peptide.\n2. Apply the peptide-antibody mixture to a tissue section alongside an untreated antibody control.\n3. Perform standard IHC staining and compare staining intensity. | A significant reduction or complete loss of staining in the peptide-blocked sample, compared to the control, confirms the antibody's binding is specific to the target epitope. |
| Cell Pellet Transfection [18] [1] | 1. Transfert cell lines (e.g., 293T) to express the target protein.\n2. Create formalin-fixed, paraffin-embedded (FFPE) cell pellets from transfected and non-transfected (negative control) cells.\n3. Perform IHC staining. | Specific staining in transfected cells, but not in non-transfected controls, validates target specificity. Weakly positive or negative cells in a partially efficient transfection can help differentiate signal from noise [1]. |
| Western Blot Analysis [18] | 1. Separate protein lysates from positive and negative control cell lines via gel electrophoresis.\n2. Transfer to a membrane and probe with the antibody.\n3. Develop to visualize bands. | Demonstration of a single band at the appropriate molecular weight, with minimal cross-reacting bands, supports specificity. Multiple bands may indicate splice variants or post-translational modifications, not necessarily non-specificity [1]. |
| Comparison with Orthogonal Methods [3] | 1. Test the same biological samples (e.g., cell lines, tissues) using IHC and another method like flow cytometry (for membrane targets) or mass spectrometry.\n2. Correlate the results from the different techniques. | A strong correlation between IHC staining and the results from the orthogonal method builds confidence in the IHC assay's accuracy and specificity. |
Workflow and Logical Framework for Epitope Characterization
The following diagram illustrates the logical decision process for integrating epitope characterization into a comprehensive antibody validation workflow for IHC.
Diagram 1: Epitope Characterization in IHC Validation Workflow
The Scientist's Toolkit: Essential Research Reagent Solutions
A robust epitope characterization and IHC validation pipeline relies on several key reagents and tools. The following table details these essential components.
Table 3: Key Research Reagent Solutions for Epitope Characterization and IHC Validation
| Item | Function in Validation | Specific Examples & Considerations |
|---|---|---|
| Validated Primary Antibodies | The key reagent that binds the target epitope in IHC. | Select antibodies validated for IHC in FFPE tissues. Look for vendors that provide detailed validation data (e.g., Cell Signaling Technology) [18]. |
| Control Cell Lines | Provide known positive and negative biological controls for specificity testing. | Can be naturally expressing or transfected with the target gene. FFPE cell pellets are ideal for mimicking tissue samples [1]. |
| Blocking Peptides | Synthetic peptides matching the target epitope used to confirm antibody specificity. | Critical for verifying that IHC staining is on-target. Used in peptide competition assays [18]. |
| Tissue Microarrays (TMAs) | Allow high-throughput IHC screening across multiple tissue types or pathologies. | Maximize IHC data while ensuring uniform technical application. Useful for demonstrating antibody performance across a spectrum of tissues [18] [1]. |
| Phospho-specific Antibodies | Detect post-translational modifications like phosphorylation. | Require special tissue handling to preserve labile epitopes. A pan-phospho antibody can help assess tissue sample quality [1]. |
| AI-Based Epitope Prediction Tools | Provide computational insights into epitope location and potential cross-reactivity. | Tools like AlphaFold 3 can predict Ab-Ag complex structures, while others like MUNIS excel at T-cell epitope prediction [17] [20]. |
| High-Throughput Epitope Mapping (DECODE) | Precisely maps epitopes for monoclonal or polyclonal antibodies at single-amino-acid resolution. | Identifies exact binding residues and predicts cross-reactivity against the entire protein database, greatly enhancing reproducibility [19]. |
In the field of diagnostic and research pathology, adherence to established regulatory standards is paramount for ensuring test accuracy, reliability, and patient safety. The Clinical Laboratory Improvement Amendments (CLIA) and the College of American Pathologists (CAP) accreditation represent two critical components of the quality management landscape for laboratories in the United States [21]. CLIA establishes the federal regulatory baseline for all clinical laboratory testing, while CAP accreditation signifies adherence to more stringent, specialty-specific standards that often exceed CLIA requirements [21]. For researchers and drug development professionals working with immunohistochemistry (IHC) assays, understanding the relationship between these frameworks is essential for developing compliant validation protocols that yield clinically actionable data.
CLIA regulations are overseen by three federal agencies: the Centers for Medicare & Medicaid Services (CMS), the Food and Drug Administration (FDA), and the Centers for Disease Control and Prevention (CDC) [21]. CMS enforces basic CLIA compliance, while CAP functions as an accreditation organization with "deeming authority," meaning CMS recognizes CAP standards as exceeding basic CLIA requirements [21]. This relationship creates a tiered system where all clinically reporting laboratories must comply with CLIA, but many seek additional CAP accreditation to demonstrate superior quality standards, particularly for complex assays like IHC used in biomarker detection and therapeutic decision-making.
CLIA Requirements and Updates
Fundamental CLIA Structure and Provisions
The Clinical Laboratory Improvement Amendments of 1988 established quality standards for all laboratory testing performed on humans in the United States, with regulations found in Part 493 of the Federal Register [21]. CLIA categorizes tests based on complexity (waived, moderate, or high complexity), with increasingly stringent requirements for more complex assays [21]. All IHC assays used for clinical decision-making fall under high-complexity testing, requiring laboratories to meet specific standards for personnel qualifications, quality control, proficiency testing, and validation procedures.
CLIA's fundamental requirement for test validation is outlined in §493.1253, which states that before introducing any new test system, laboratories must demonstrate that performance specifications for accuracy, precision, analytical sensitivity, and analytical specificity are met [22]. However, CLIA does not prescribe specific validation protocols, allowing laboratories flexibility in establishing validation procedures appropriate for their specific methodologies, including IHC.
Recent CLIA Proficiency Testing Updates
A significant update to CLIA proficiency testing requirements took effect on January 1, 2025, implementing new analytical performance (AP) criteria for numerous analytes across chemistry, immunology, endocrinology, toxicology, and hematology [23] [24]. These changes, which were fully implemented by proficiency testing organizations on January 1, 2025, impact many tests relevant to IHC and biomarker analysis.
Table: Select 2025 CLIA Proficiency Testing Acceptance Limits for Relevant Analytes
| Analyte or Test | NEW 2025 CLIA Criteria | Previous Criteria |
|---|---|---|
| Hemoglobin A1c | TV ± 8% | None (newly regulated) |
| High-sensitivity C-reactive protein | TV ± 1 mg/L or ± 30% (greater) | None (newly regulated) |
| Alpha-fetoprotein | TV ± 20% or positive/negative | TV ± 3 SD |
| Cancer antigen 125 | TV ± 20% | None (newly regulated) |
| Carcinoembryonic antigen | TV ± 15% or ± 1 ng/dL (greater) | None (newly regulated) |
| Prostate Specific Antigen | TV ± 0.2 ng/mL or 20% (greater) | None (newly regulated) |
| Cell identification | 80% or greater consensus | 90% or greater consensus |
| Estradiol | TV ± 30% | None (newly regulated) |
| Testosterone | TV ± 20 ng/dL or ±30% (greater) | None (newly regulated) |
These updated requirements reflect evolving analytical capabilities and clinical needs, with many analytes newly added to CLIA-regulated testing [23] [24]. Laboratories must ensure their proficiency testing programs align with these updated standards, as performance on these tests is a key component of CLIA compliance.
CAP Accreditation Standards
CAP Accreditation Process and Value
The College of American Pathologists offers a voluntary accreditation program that exceeds basic CLIA requirements through more detailed, specialty-specific standards [21]. CAP accreditation involves a rigorous process where qualified CAP inspectors (practicing laboratory professionals from other CAP-accredited labs) conduct on-site inspections every two years, with self-inspections in alternate years [21]. This peer-based inspection model ensures that assessors possess relevant technical expertise for the specialty areas they are evaluating.
CAP standards are documented in detailed checklists that include both general and specialty-specific requirements, with the Anatomic Pathology checklist containing particularly relevant guidance for IHC laboratories [22]. For drug development professionals and researchers, utilizing CAP-accredited laboratories provides assurance that testing meets the most comprehensive, scientifically-endorsed standards available, which can be particularly valuable for assays supporting regulatory submissions or clinical trial decisions [21].
CAP Guidelines for IHC Assay Validation
In February 2024, CAP updated its "Principles of Analytic Validation of Immunohistochemical Assays" guideline, which provides detailed recommendations for validating IHC assays [3] [25]. A key update includes harmonized validation requirements for all predictive markers, replacing previous variable concordance requirements with a uniform 90% overall concordance standard between the new assay and comparator methods [3] [25]. This streamlined approach applies to all IHC assays, including established biomarkers like estrogen receptor, progesterone receptor, and HER2.
The updated CAP guideline introduces several important new recommendations:
- Separate validation for each assay-scoring system combination for predictive markers with distinct scoring systems (e.g., PD-L1, HER2) [3]
- Enhanced validation requirements for cytology specimens fixed differently from standard FFPE tissues, requiring a minimum of 10 positive and 10 negative cases for specimens fixed in alternative fixatives [3]
- Explicit verification requirements for unmodified FDA-approved/cleared assays [3]
These recommendations reflect the evolving complexity of IHC testing, particularly for predictive biomarkers used to guide targeted therapies.
Comparative Analysis: CLIA versus CAP
Table: Key Differences Between CLIA and CAP Requirements
| Aspect | CLIA Regulations | CAP Accreditation |
|---|---|---|
| Legal Status | Federal law mandated for all clinical testing | Voluntary accreditation program |
| Governance | CMS, FDA, and CDC oversight | Professional society with deemed status |
| Specificity | General quality standards | Specialty-specific detailed requirements |
| Inspection Process | CMS or state agency surveyors | Peer-based inspections by practicing laboratory professionals |
| Proficiency Testing | Specified regulated analytes with defined performance criteria | Includes all CLIA-required PT plus additional analytes as specified in checklists |
| Test Validation | Requires demonstration of performance specifications | Provides detailed methodology for validation specific to test type |
| IHC Guidance | General validation requirements | Detailed protocols for IHC validation, including recent updates for predictive markers and cytology specimens |
While CLIA provides the regulatory floor for laboratory testing, CAP accreditation represents a more comprehensive quality framework with specific requirements tailored to different laboratory specialties [21]. For IHC laboratories, CAP guidelines offer crucial specificity for validation approaches that CLIA's general requirements lack. This distinction is particularly important for laboratories implementing complex IHC assays for predictive biomarkers, where CAP provides explicit guidance on validation methodologies, concordance thresholds, and specimen requirements [3] [22].
A critical distinction in terminology exists between "validation" and "verification" in these frameworks. CAP guidelines clarify that when an existing validated IHC assay undergoes specific changes (antibody dilution, vendor change with same clone, or incubation/retrieval times with same method), laboratories need only perform a streamlined "verification" with at least 2 known positive and 2 known negative cases, rather than full re-validation [22]. This distinction provides important efficiency for laboratories implementing minor modifications to established assays.
IHC Validation Protocols and Methodologies
Tiered Antibody Validation Approach
A consensus approach to antibody validation for IHC, proposed by a consortium of academic and pharmaceutical histopathology researchers, recommends a tiered validation system based on evidence of antibody usage [1]. This framework appropriately scales validation requirements based on prior characterization:
- Tier 1: Well-characterized antibodies with substantial high-quality literature evidence require standard validation.
- Tier 2: Established antibodies used in alternative species or unvalidated tissues need intermediate validation.
- Tier 3: Novel antibodies with inconsistent or no literature evidence demand comprehensive validation [1].
This risk-based approach efficiently allocates resources while ensuring sufficient evidence for analytical specificity.
Stepwise Validation Methodology
Comprehensive IHC antibody validation follows a systematic process to establish analytical specificity and sensitivity:
- Step 1: Target Understanding – Conduct comprehensive literature review of target biology, expected expression patterns, and subcellular localization using databases like OMIM, Uniprot, and Genecards [1].
- Step 2: Control Identification – Establish positive and negative control materials, including cell lines with known expression levels, transfected/knockdown systems, and relevant tissue specimens [1] [4].
- Step 3: Method Selection – Choose appropriate detection methods based on expected expression levels, employing commercially validated kits and systematic optimization of retrieval conditions [1].
- Step 4: Specificity Assessment – Demonstrate antibody specificity through Western blotting, cell pellet staining, peptide blocking, and comparison with alternative methods [26] [1].
- Step 5: Tissue Staining – Test antibody performance across a comprehensive panel of tissues (typically 20+ normal and pathologic tissues) at multiple concentrations [4].
- Step 6: Result Comparison – Compare staining patterns with literature expectations and results from antibodies targeting different epitopes of the same antigen [4].
- Step 7: Documentation – Thoroughly document all validation data, including staining protocols, control results, and interpretation criteria [1].
Experimental Design for Validation Studies
Proper experimental design is crucial for generating meaningful validation data. CAP guidelines recommend several comparator models for IHC validation study design, listed here from most to least stringent:
- Comparison with IHC results from cell lines containing known amounts of target protein ("calibrators")
- Comparison with non-immunohistochemical methods (flow cytometry, FISH)
- Comparison with testing results from another laboratory using a validated assay
- Comparison with prior testing of same tissues with validated assay in same laboratory
- Comparison with expected architectural and subcellular localization of antigen [3]
For initial validation of predictive marker assays, the updated CAP guidelines recommend testing a minimum of 10 positive and 10 negative cases for cytology specimens with alternative fixatives, while the overall concordance threshold for all IHC assays is now uniformly set at 90% [3] [25].
Essential Research Reagents and Materials
Table: Essential Research Reagents for IHC Validation
| Reagent Category | Specific Examples | Function in Validation |
|---|---|---|
| Primary Antibodies | Monoclonal and polyclonal antibodies targeting specific epitopes | Specific binding to target antigen of interest; monoclonal preferred for specificity |
| Control Cell Lines | Transfected cell lines, knockdown systems, xenografts | Provide known positive/negative controls for specificity assessment |
| Tissue Microarrays | Normal tissues, cancer arrays, multi-tissue panels | Enable comprehensive staining assessment across diverse tissues |
| Detection Systems | HRP-DAB, alkaline phosphatase-Vector Red, polymer systems | Visualize antibody binding with appropriate sensitivity and minimal background |
| Antigen Retrieval | pH-specific buffers, enzymatic retrieval solutions | Reverse formaldehyde-induced epitope masking in FFPE tissues |
| Blocking Reagents | Normal serum, BSA, proprietary blocking solutions | Reduce non-specific background staining |
| Validation Tools | Blocking peptides, isotype controls | Confirm antibody specificity through competition assays |
| Fixation Materials | Neutral buffered formalin, alternative fixatives | Standardize tissue processing conditions |
Successful IHC validation requires appropriate selection of biological materials. Formalin-fixed, paraffin-embedded (FFPE) cell pellets from lines with known expression levels provide excellent controlled specimens for initial validation [26] [1]. For tissue-based validation, comprehensive panels including both normal and pathologic tissues are essential, with attention to potential expression differences across tissue types [4]. The use of tissue microarrays enables efficient staining assessment across multiple tissue types while ensuring consistent technical parameters [1].
Antibody selection requires careful consideration of clone specificity, host species, and recognition of formalin-resistant epitopes. Monoclonal antibodies typically offer superior specificity but may underperform in formalin-fixed tissues, while polyclonal antibodies demonstrate higher success rates in FFPE specimens but may exhibit more non-specific background [4]. For critical applications, antibodies should be validated using multiple complementary methods, such as Western blotting, immunoprecipitation, or genetic approaches (overexpression/knockdown) to confirm target specificity [26] [1].
Practical Implementation Strategies
Navigating Regulatory Requirements
Implementing compliant IHC validation protocols requires understanding how CLIA and CAP requirements interact in practice. Laboratories should:
- Establish a validation master plan that addresses both CLIA's general performance specifications and CAP's IHC-specific guidelines
- Maintain comprehensive documentation for all validation studies, including protocol parameters, raw data, and interpretation criteria
- Implement appropriate quality controls for daily use, reflecting the conditions established during validation
- Participate in relevant proficiency testing programs for all regulated analytes and clinically reported tests
- Conduct regular method verification when modifying existing assays, following CAP's streamlined approach for minor changes [22]
For laboratories developing IHC assays for companion diagnostic applications, additional FDA requirements may apply, typically following Clinical Laboratory Standards Institute (CLSI) guidelines and potentially requiring Premarket Approval (PMA) submissions [27]. These regulatory pathways demand more extensive analytical validation than standard CLIA requirements, including multi-site reproducibility studies for IVD kits [27].
Special Considerations for Predictive Biomarkers
Validation of predictive IHC biomarkers (e.g., PD-L1, HER2) requires additional considerations:
- Separate validation for each indication when different scoring systems apply to different tumor types or clinical contexts [3]
- Harmonized concordance thresholds of 90% for all predictive markers, replacing previous variable standards [25]
- Rigorous pathologist training on scoring criteria to ensure consistent interpretation across readers
- Ongoing monitoring of assay performance through quality assurance programs
The updated CAP guidelines specifically address these requirements, emphasizing that laboratories must separately validate each assay-scoring system combination used for predictive markers [3]. This ensures that staining interpretation aligns with clinical decision thresholds established for specific therapeutic contexts.
By understanding and implementing these regulatory frameworks, researchers and drug development professionals can ensure their IHC assays generate reliable, clinically actionable data that meets current regulatory expectations while supporting advancements in personalized medicine.
The Impact of Poor Validation on Research Reproducibility
The reproducibility crisis represents one of the most significant challenges in modern biomedical research, with poorly validated antibodies identified as a major contributing factor. Antibodies are indispensable tools used to detect and characterize proteins across countless research applications, particularly in immunohistochemistry (IHC) where they serve diagnostic, prognostic, and therapeutic roles [1] [28]. However, substantial evidence reveals that a concerning percentage of commercial antibodies fail to recognize their intended targets specifically, generating unreliable data that undermines research validity and wastes valuable resources [29]. This comprehensive analysis examines the scope of the antibody validation problem, its financial and scientific consequences, and establishes rigorous validation frameworks essential for restoring research reproducibility.
The Scale of the Problem: Quantitative Evidence
Large-scale systematic studies have quantified the alarming rate of antibody failure, providing concrete evidence for what was previously largely anecdotal knowledge within the research community.
Table 1: Large-Scale Antibody Validation Studies
| Study Scope | Failure Rate | Financial Impact | Key Findings | Reference |
|---|---|---|---|---|
| 614 commercial antibodies for 65 neuroscience targets | >50% failed in one or more applications | $1 billion wasted annually on ineffective antibodies | ~50-75% of proteins covered by at least one high-performing antibody; recombinant antibodies outperformed monoclonal/polyclonal | [29] |
| 2,500+ commercial antibodies from Human Protein Atlas | >50% did not perform as expected in intended assays | Not quantified | Significant variability in antibody performance across different applications | [30] |
| Commercial antibody market analysis | Not specified | $0.375-$1.75 billion wasted yearly on non-specific antibodies | Hundreds of underperforming antibodies were found to have been used in numerous published articles | [29] |
The implications extend beyond financial waste, as these underperforming reagents have permeated the scientific literature. The study examining 614 neuroscience antibodies found that "hundreds of the underperforming antibodies identified in this study were found to have been used in a large number of published articles, which should raise alarm" [29]. This suggests that a substantial portion of published protein research may be based on unreliable antibody data, creating ripple effects through subsequent studies that build upon these flawed foundations.
Consequences of Poor Antibody Validation
Financial and Resource Impacts
The economic burden of poorly validated antibodies extends far beyond the initial purchase price of ineffective reagents. Researchers conservatively estimate that $1 billion is wasted annually on research involving ineffective antibodies, with other analyses suggesting the figure may range from $0.375 to $1.75 billion yearly [29]. These staggering amounts represent not only direct reagent costs but also the substantial investment of researcher time, laboratory materials, and institutional resources dedicated to experiments compromised by unreliable tools.
The resource waste compounds throughout the research pipeline. A single failed antibody can invalidate months of meticulous work, including sample preparation, data collection, and analysis. Perhaps more damaging is the opportunity cost—the potentially valid research questions that went unexplored due to resources being diverted to dead ends created by antibody failures. This misallocation of scarce research funding substantially slows the pace of scientific discovery across multiple fields, particularly in neuroscience and cancer research where antibody-based methods are foundational [29].
Scientific and Reproducibility Impacts
The scientific consequences of poor antibody validation extend beyond financial considerations to the very integrity of research findings. The fundamental requirement of scientific progress—the ability to reproduce and build upon published findings—is severely compromised when different research groups obtain conflicting results due to variable reagent performance rather than true biological differences.
The problem is particularly acute in immunohistochemistry research, where antibodies are used "as a decision making tool to ascertain those patients who are most likely to benefit from treatment" in clinical contexts [1]. When these critical tools are not properly validated, they can lead to misdiagnosis or inappropriate treatment selection. For example, IHC tests determine whether cancer patients receive specific targeted therapies, with PD-L1 IHC testing alone guiding treatment decisions that cost "on average $150,000 per year" per patient [30].
The reproducibility crisis fueled by poor antibody validation also erodes the scientific community's credibility and slows therapeutic development. As noted in one analysis, "the use of poor-quality antibodies is a major factor in the scientific reproducibility crisis" [29]. This crisis manifests when laboratories cannot replicate published findings, when animal studies fail to translate to human therapies, and when clinical trials proceed based on questionable preclinical data. The cumulative effect is a breakdown in the scientific process that depends on verification and sequential advancement of knowledge.
Antibody Validation Frameworks and Protocols
Tiered Validation Approach
A consortium of academic and pharmaceutical researchers has proposed a structured, tiered framework for antibody validation that categorizes antibodies based on existing evidence and dictates appropriate validation rigor [1].
Table 2: Tiered Antibody Validation System
| Tier | Antibody Characterization | Validation Requirements | Examples |
|---|---|---|---|
| Level 1 | Well-known antibody with high-quality literature evidence | Minimal additional validation required | Antibodies with extensive published data across multiple applications |
| Level 2 | Well-known antibody used in alternative species or unvalidated tissue | Moderate validation for new context | Antibodies validated for human tissue applied to mouse models |
| Level 3 | Unknown antibody with inconsistent or no literature evidence | Comprehensive validation required | Novel antibodies or those with limited characterization |
This risk-based approach allocates resources efficiently while ensuring appropriate rigor. As outlined in the guidelines, the validation process begins with a thorough understanding of the target through literature review and database mining (e.g., OMIM, Uniprot, Genecards), followed by identification of appropriate control cells and tissues, selection of optimal IHC methods, and determination of the required validation level [1].
Stepwise Validation Protocol
For rigorous immunohistochemistry applications, researchers have developed detailed stepwise validation protocols that integrate multiple complementary strategies [30]:
This structured approach ensures systematic assessment of antibody performance. The initial localization check provides early evidence of specificity, while quantitative titration establishes optimal assay conditions [30]. The critical third step employs one or more validation strategies to confirm specificity, with genetic approaches using CRISPR knockout cell lines representing particularly compelling evidence [29] [30]. Finally, reproducibility testing across technical and operational variables ensures robust performance in real-world conditions.
Multipillar Validation Strategies
Leading antibody manufacturers and research consortia have established comprehensive validation frameworks incorporating multiple evidentiary pillars. Cell Signaling Technology's "Hallmarks of Antibody Validation" exemplifies this approach, incorporating six complementary strategies [31]:
- Genetic Strategies: Using CRISPR/Cas9 knockout cell lines to confirm loss of signal
- Orthogonal Validation: Comparing results with non-antibody methods (e.g., in situ hybridization, mass spectrometry)
- Independent Antibodies: Correlating results from multiple antibodies targeting non-overlapping epitopes
- Biological Context: Ensuring expression patterns match expected biology across tissue types
- Recombinant Protein Expression: Testing with purified recombinant target protein
- Immunoprecipitation Followed by Mass Spectrometry: Identifying all proteins pulled down by the antibody
This multi-faceted approach is necessary because "no single assay is sufficient to validate an antibody, including knockout" [31]. Different applications may require different validation strategies, and performance in one application does not guarantee specificity in another.
Recommended Experimental Protocols
Knockout-Based Validation
Genetic knockout validation using CRISPR/Cas9 technology represents the current gold standard for establishing antibody specificity [29] [32]. This method provides compelling evidence by directly linking the genetic presence of the target protein to the antibody-derived signal.
Protocol Overview:
- Cell Line Selection: Identify parental cell lines expressing the target protein using RNA expression databases (e.g., DepMap) with a threshold of 2.5 log2(TPM+1) [29]
- CRISPR Engineering: Generate isogenic knockout cell lines using CRISPR/Cas9 gene editing
- Parallel Testing: Perform IHC on both parental and knockout cell lines under identical conditions
- Result Interpretation: Specific antibodies show signal loss in knockout lines while maintaining appropriate staining in parental lines
This approach effectively controls for non-specific binding and off-target effects, providing high-confidence validation when properly executed [29]. The scalability of this method has been demonstrated in studies validating hundreds of antibodies, establishing it as a robust and reproducible validation platform.
Orthogonal Validation Methods
Orthogonal validation employs non-antibody-dependent methods to verify protein expression patterns detected by IHC [30]. This approach provides independent confirmation of antibody specificity through alternative technological platforms.
Key Orthogonal Methods:
- mRNA In Situ Hybridization: Correlates protein detection with mRNA expression patterns in tissue sections
- Mass Spectrometry: Verifies protein identity and presence in sample types
- Western Blotting: Confirms target molecular weight and detects potential splice variants
- Flow Cytometry: Validates cell type-specific expression in suspension
The power of orthogonal validation lies in its technological independence from IHC, reducing the likelihood that both methods would share the same artifacts or failure modes. When antibody-based protein detection aligns with mRNA expression patterns or mass spectrometry results, confidence in antibody specificity increases substantially.
Quantitative Titration and Optimization
Proper antibody titration represents a fundamental but frequently overlooked aspect of validation [30]. Suboptimal concentration represents a common source of poor specificity and reproducibility in IHC.
Optimization Protocol:
- Serial Dilution: Test antibody concentrations spanning at least two full logs (e.g., 1:100 to 1:10,000)
- Tissue Microarray Screening: Use TMAs containing tissues with expected variable target expression
- Quantitative Analysis: Employ quantitative image analysis (e.g., AQUA, HALO, Visiomorph) rather than subjective scoring
- Dynamic Range Assessment: Identify the concentration providing maximal signal-to-noise ratio
- Condition Optimization: Systematically test antigen retrieval buffers and incubation conditions
This quantitative approach establishes optimal assay conditions that maximize sensitivity while minimizing background, ensuring the antibody operates within its linear dynamic range for subsequent validation steps and experimental use.
Research Reagent Solutions
Implementing rigorous antibody validation requires specific reagents and tools designed to address key challenges in specificity verification.
Table 3: Essential Research Reagents for Antibody Validation
| Reagent/Tool | Function in Validation | Key Applications | Considerations |
|---|---|---|---|
| CRISPR Knockout Cell Lines | Gold standard specificity control; confirms signal dependency on target protein | Western blot, IHC, immunofluorescence, flow cytometry | Requires specialized expertise; potential for compensatory mechanisms |
| Isogenic Control Cell Lines | Provide genetically matched positive controls for knockout validation | All antibody applications | Must be carefully characterized to ensure genetic stability |
| Tissue Microarrays (TMAs) | Enable high-throughput screening across multiple tissue types | IHC antibody optimization and validation | Tissue quality and antigen preservation must be verified |
| Recombinant Antibodies | Defined sequence eliminates batch variability; renewable resource | All applications; particularly valuable for long-term studies | Higher initial development cost; limited availability for some targets |
| Positive/Negative Control Tissues | Verify expected staining patterns and absence of non-specific binding | IHC assay development and quality control | Should represent biological contexts relevant to research questions |
| Automated Image Analysis Platforms | Provide objective, quantitative assessment of staining intensity | IHC validation and quantitative studies | Requires standardization and validation of analysis algorithms |
The future of antibody validation points toward increased standardization, transparency, and data sharing. Community-driven databases and open access to validation data will help researchers identify high-performing reagents and avoid problematic antibodies [33]. The growing adoption of recombinant antibodies with defined sequences addresses the batch-to-batch variability inherent in traditional monoclonal and polyclonal antibodies [29] [32].
Digital pathology and artificial intelligence represent promising technological advancements that will enhance validation rigor through automated, quantitative image analysis, reducing the subjectivity that plagues traditional IHC scoring [28]. Integration of these tools with standardized validation protocols will improve reproducibility across laboratories.
In conclusion, the impact of poor antibody validation on research reproducibility is profound and far-reaching, affecting scientific integrity, clinical decision-making, and resource allocation. The implementation of systematic, multi-tiered validation frameworks incorporating genetic, orthogonal, and independent verification strategies is essential to restore reliability to antibody-based research. As the field moves toward standardized validation requirements and increased data transparency, researchers must adopt these rigorous practices to ensure that their findings contribute meaningfully to scientific advancement rather than exacerbating the reproducibility crisis.
Procedural Frameworks: Implementing Rigorous Validation Methods for IHC
{# This guide explores the universal framework of the Five Pillars of Antibody Validation, providing objective performance data and detailed protocols to enhance reproducibility in immunohistochemistry research. #}
In biomedical research, antibodies are indispensable tools for detecting and visualizing proteins in various experimental contexts, including the critical application of immunohistochemistry (IHC). However, their reliability has been called into question by a well-documented reproducibility crisis, largely fueled by poorly validated antibody reagents [34]. Studies have revealed that a significant portion of commercially available antibodies lack sufficient specificity, with one analysis showing over 50% of antibodies for neuroscience-related proteins failing at least one validation test, and a quarter of antibodies used in epigenetic research proving non-specific [34]. The consequences are far-reaching, leading to irreproducible data, scientific retractions, and entire research fields being misdirected [34].
To address this challenge, the International Working Group for Antibody Validation (IWGAV) established a standardized scientific framework in 2016 [35]. This framework, universally known as the "Five Pillars of Antibody Validation," provides a robust set of strategies to confirm that an antibody binds specifically to its intended target [36] [37]. This guide details these five pillars, provides comparative data on their performance, and outlines specific experimental protocols to empower researchers in their IHC workflow.
The Five Pillars: A Detailed Comparative Analysis
The IWGAV's five pillars offer complementary approaches for demonstrating antibody specificity. Each method has distinct strengths, limitations, and ideal use cases, making them suited for different experimental scenarios [35]. The table below provides a comprehensive comparison.
| Validation Pillar | Core Principle | Key Advantages | Inherent Limitations | Suitability for IHC |
|---|---|---|---|---|
| 1. Genetic Strategies [35] [34] | Compare signal in wild-type vs. genetically modified (KO/KD) cells/tissues. | Considered a "gold-standard"; provides a true negative control [35]. | Not universal; lethal for essential genes; KD is transient [35] [34]. | High (if viable KO/KD tissue is available) |
| 2. Orthogonal Strategies [35] [38] | Correlate antibody-derived data with an antibody-independent method (e.g., transcriptomics, proteomics). | Can be high-throughput; leverages existing omics data [35]. | mRNA-Protein correlation can be weak; data interpretation can be challenging [35]. | Medium (depends on quality of orthogonal data for tissues) |
| 3. Independent Antibody Strategies [35] [36] | Compare staining patterns of ≥2 antibodies targeting different epitopes on the same protein. | Simple verification; straightforward results [35]. | Risk of correlated false-positives; requires multiple validated antibodies [35] [34]. | High (highly recommended for IHC) |
| 4. Expression of Tagged Proteins [35] [39] | Compare antibody signal against a tagged version of the target (e.g., GFP, c-Myc). | Selective for the target; good for overexpression studies. | Overexpression can cause artifactual localization; tag may alter protein function [35]. | Medium (can confirm specificity but not native context) |
| 5. Immunoprecipitation-Mass Spectrometry (IP-MS) [35] [40] | Identify all proteins bound by an antibody using IP followed by MS. | Identifies the true target and off-targets; can reveal protein complexes [40]. | Technically challenging; not all antibodies work for IP; data can be complex to interpret [35]. | Low (inherently non-spatial, but validates specificity) |
A Researcher's Toolkit: Essential Reagent Solutions
Successful implementation of the five pillars relies on key reagents. The table below lists essential tools referenced in this guide.
| Research Reagent / Tool | Primary Function in Validation | Key Considerations |
|---|---|---|
| KO Cell Lines [35] | Provide a true negative control for genetic validation (Pillar 1). | Ready-made lines accelerate workflow; ensure genetic modification is complete. |
| siRNA/shRNA [34] | Knock down target gene expression for genetic validation (Pillar 1). | Transient effect; incomplete knockdown can leave residual signal. |
| Recombinant Antibodies [35] [39] | Provide a defined, consistent reagent for independent antibody strategies (Pillar 3) and other pillars. | High batch-to-batch consistency; superior for long-term study reproducibility. |
| CRISPR/Cas9 Systems [34] | Create permanent knockout cell lines for the most robust genetic validation (Pillar 1). | Requires molecular biology expertise; potential for off-target genomic edits. |
| Tag-Specific Antibodies [35] | Detect expressed tagged proteins (e.g., GFP, c-Myc) for tagged protein validation (Pillar 4). | Crucial for confirming expression and localization of the tagged construct. |
Experimental Protocols for Pillar Implementation
Protocol 1: Genetic Validation (Knockout/Knockdown)
This protocol is widely considered the gold standard for establishing antibody specificity [35].
- Step 1: Cell Line Selection. Choose a cell line that endogenously expresses the target protein at a detectable level.
- Step 2: Genetic Modification.
- Step 3: Sample Preparation. Culture both wild-type and KO/KD cells. Prepare cell pellets for IHC embedding and sectioning, or generate lysates for Western blotting as an initial specificity check [41].
- Step 4: IHC Staining and Analysis. Perform IHC on paired tissue sections (wild-type vs. KO/KD) using standardized conditions. A specific antibody will show a clear and significant reduction in signal in the KO/KD sample compared to the wild-type control [39].
Protocol 2: Orthogonal Validation using Transcriptomics
This method validates antibody specificity by comparing its staining pattern with an antibody-independent measure of target presence [38].
- Step 1: Tissue Panel Selection. Assemble a panel of at least 3-5 tissue samples with known, variable expression levels of the target protein's mRNA, as determined by databases like NCBI Gene or the Human Protein Atlas [34] [38].
- Step 2: IHC Staining. Perform IHC on all tissue samples in the panel using the same protocol.
- Step 3: Quantitative Analysis.
- Quantify the IHC signal (e.g., using an H-score or percentage of positive cells) for each tissue.
- Obtain the corresponding mRNA expression values (e.g., TPM - Transcripts Per Million) for the target gene from transcriptomic databases for the same tissues.
- Step 4: Correlation Assessment. Plot the quantitative IHC scores against the mRNA expression values. A positive Pearson correlation coefficient (ideally >0.5) across the sample set supports the antibody's specificity [38].
Protocol 3: Independent Antibody Validation
This straightforward strategy uses multiple antibodies to build confidence in the observed staining pattern [36].
- Step 1: Antibody Selection. Source at least two independent antibodies that target non-overlapping epitopes on the same protein. Recombinant antibodies are ideal for this purpose due to their high consistency [35].
- Step 2: Parallel Staining. Perform IHC on serial sections of the same tissue sample(s) using each independent antibody under their respective optimized conditions.
- Step 3: Pattern Comparison. Analyze the stained slides for concordance in the cellular localization, sub-cellular distribution, and expression levels of the signal across different tissue structures. Consistent results from multiple antibodies strongly indicate specificity [34].
The logical relationship and application context of these three core validation protocols within an IHC research workflow can be summarized as follows:
Discussion & Best Practices for IHC
For IHC research, no single pillar is sufficient to claim universal validation. The IWGAV recommends using multiple strategies to build a compelling case for antibody specificity [40]. Based on the comparative analysis:
- Genetic strategies (Pillar 1) provide the most definitive evidence if a viable KO tissue model is available.
- Independent antibody validation (Pillar 3) is one of the most practical and highly recommended approaches for IHC, as it directly confirms the expected staining pattern.
- Always include appropriate positive and negative control tissues in every IHC experiment [36].
- Recognize that validation is application-specific. An antibody validated for Western blotting may not work in IHC due to differences in epitope accessibility resulting from formalin fixation and antigen retrieval [41].
The scientific community is increasingly prioritizing antibody validation, with many leading journals and funding agencies requiring detailed validation data. By adopting this universal framework, researchers can generate more reliable and reproducible data, ultimately accelerating the discovery of new biological mechanisms and therapeutic targets.
Antibody validation is a critical process in immunohistochemistry (IHC) research that ensures the accuracy, reproducibility, and reliability of experimental results. This process confirms that an antibody specifically binds to its intended target with minimal cross-reactivity, providing confidence in the data generated [34]. The fundamental principle of antibody validation involves demonstrating that you get a specific signal for your intended target in a given application, going beyond simple detection to provide evidence of minimal off-target binding [34].
The International Working Group on Antibody Validation (IWGAV) has established a framework of five conceptual pillars to guide researchers in thorough antibody characterization [40]. These pillars provide a structured approach to validation, emphasizing that multiple lines of evidence are often necessary to truly confirm antibody specificity for a particular application. The need for rigorous validation is underscored by documented cases where non-specific antibodies have led to paper retractions and have misdirected entire research fields, such as the early work on oestrogen receptor β where only one of thirteen tested antibodies proved specific for IHC [34].
Within clinical and diagnostic applications, organizations like the College of American Pathologists (CAP) provide specific guidelines for analytical validation of IHC assays. The 2024 guideline update affirms and expands on previous recommendations, providing specific requirements for validating predictive markers with distinct scoring systems and offering new guidance for IHC performed on cytology specimens [3]. These guidelines represent the evolving standards in the field, ensuring accuracy and reducing variation in IHC laboratory practices.
Comprehensive Comparison of Validation Strategies
The Five Pillars of Antibody Validation
The IWGAV's five pillars provide a comprehensive framework for antibody validation, each offering distinct advantages and limitations. Genetic strategies involve using knockout or knockdown controls to demonstrate signal loss when the target gene is absent [32]. Orthogonal strategies employ antibody-independent methods to quantify target expression across samples and correlate these findings with antibody-based detection [34]. Independent antibody strategies utilize multiple antibodies recognizing different epitopes on the same target to confirm specificity through consistent results [32]. Tagged protein expression involves modifying the endogenous target gene to include affinity or fluorescent tags, then comparing signals from anti-tag antibodies and the test antibody [40]. Immunoprecipitation with mass spectrometry (IP-MS) identifies proteins captured by the antibody through mass spectrometry, confirming the target and revealing potential off-target interactions [40].
Comparative Analysis of Validation Methods
Table 1: Comprehensive Comparison of Antibody Validation Strategies
| Validation Method | Key Principle | Specificity Confirmation | Best Applications | Technical Limitations |
|---|---|---|---|---|
| Genetic Strategies | Signal reduction in KO/KD systems | High - demonstrates dependency on target presence | Wide range including WB, IHC, ICC, flow cytometry [32] | Not suitable for essential genes; cell line-specific results [34] |
| Orthogonal Strategies | Correlation with antibody-independent quantification | Medium - supports but doesn't definitively prove specificity | Applications where orthogonal data exists (transcriptomics, proteomics) [34] | Protein/RNA expression may not correlate; requires existing data [34] |
| Independent Antibodies | Concordance between different epitope-targeting antibodies | Medium - consistent results increase confidence | All applications where multiple validated antibodies exist [32] | Risk of shared non-specificity; limited antibody availability [34] |
| Tagged Protein Expression | Matching signals between test and tag antibodies | Medium-high for overexpressed targets | WB, IHC, ICC, flow cytometry [32] | Overexpression may mask off-target binding; doesn't reflect endogenous levels [32] |
| IP-MS | Direct identification of antibody-bound proteins | Very high - identifies true target and off-targets | Target identification, complex interaction studies [40] | Technically challenging; requires specialized equipment [40] |
| Biological Models | Comparison with expected expression patterns | Medium - confirms expected biological patterns | Tissue staining where expression patterns are established [34] | Limited to well-characterized targets and systems [34] |
Each validation method provides different levels of evidence for antibody specificity, with the IWGAV recommending that researchers use multiple pillars to claim thorough validation for a specific application [40]. The choice of method depends on the intended application, available resources, and the existing knowledge about the target protein.
Experimental Protocols for Key Validation Methodologies
Genetic Validation Using CRISPR-Cas9
Genetic validation through CRISPR-Cas9 gene editing provides one of the most robust methods for confirming antibody specificity. The protocol begins with designing guide RNAs specific to the target gene of interest. These guides are transfected into an appropriate cell line along with Cas9 endonuclease to create knockout cells. After transfection, cells are screened for successful gene editing through DNA sequencing or functional assays. The knockout cells are then prepared alongside wild-type control cells using standard protocols appropriate for the intended application (e.g., formalin-fixed paraffin-embedded sections for IHC). Both knockout and control samples are processed simultaneously using the antibody being validated, with identical staining conditions. A specific antibody will show dramatically reduced or absent signal in the knockout cells compared to controls, while persistent signal indicates non-specific binding [32] [34].
For immunohistochemistry applications specifically, the CAP guidelines recommend establishing validation protocols that account for pre-analytical variables. This includes running validation sets on different instruments over multiple days and having different personnel perform the runs to ensure robustness [3]. When validating antibodies for use on cytology specimens fixed differently from standard FFPE tissues, separate validation with a minimum of 10 positive and 10 negative cases is recommended [3].
Immunoprecipitation with Mass Spectrometry (IP-MS)
The IP-MS protocol provides the unique advantage of directly identifying the proteins that an antibody binds to, offering definitive evidence of specificity while also revealing potential off-target interactions. The process begins with cell line selection based on target expression data, preferably choosing lines with mid-to-low expression levels to test antibody performance in relevant backgrounds. Cells are lysed using appropriate buffers, and cysteine residues are reduced and alkylated before tryptic digestion. Peptide samples are fractionated using high-pH reversed-phase chromatography and quantified [40].
The antibody being validated is then used for immunoprecipitation from the cell lysate, typically using magnetic protein A/G beads. As a critical control, parallel IP is performed with an antibody against an unrelated target. The immunoprecipitated proteins are analyzed by nanoLC-MS/MS, and identified peptides are quantified using software such as Proteome Discoverer or MaxQuant. Background proteins are filtered out by comparison with the negative control IP, and fold-enrichment is calculated for each identified protein using the formula: (Target protein abundance in IP sample/Total protein abundance in IP sample) divided by (Target protein abundance in cell lysate/Total protein abundance in cell lysate) [40].
The resulting list of enriched proteins is analyzed using interaction databases such as STRING to identify known protein-protein interactions, helping distinguish direct targets from co-immunoprecipitating partners. This method not only verifies the antibody's target but can also identify protein modifications, isoforms, and interacting complexes [40].
Figure 1: IP-MS Workflow for Antibody Validation
Visual Guide to Stepwise Validation
Comprehensive Validation Workflow
A robust antibody validation strategy typically progresses through multiple stages, beginning with literature review and moving through increasingly specific experimental validation. The process should be designed to build cumulative evidence for antibody specificity, with the understanding that different applications may require different levels of validation [3] [34].
Figure 2: Stepwise Antibody Validation Process
Control Selection Framework
Proper control selection is fundamental to rigorous antibody validation. The CAP guidelines emphasize the importance of using appropriate comparators in validation study designs, ordering them from most to least stringent [3]. The hierarchy begins with comparison to cell lines containing known amounts of target protein ("calibrators"), followed by non-immunohistochemical methods like flow cytometry or FISH. Other options include comparison with results from another laboratory using a validated assay, prior testing of the same tissues in the same laboratory, or comparison with expected architectural and subcellular localization patterns [3].
For IHC assays with distinct scoring systems used across different tumor sites or clinical indications, the 2024 CAP guideline update specifically recommends that laboratories separately validate each assay-scoring system combination [3]. This reflects the understanding that antibody performance can vary significantly depending on the specific pathological context and scoring methodology employed.
The Scientist's Toolkit: Essential Research Reagents
Table 2: Essential Research Reagents for Antibody Validation
| Reagent/Resource | Function in Validation | Specific Examples & Applications |
|---|---|---|
| CRISPR-Cas9 Systems | Creation of knockout cell lines for genetic validation | Confirm specificity through signal loss in target-deficient systems [32] |
| Validated Reference Antibodies | Independent antibody strategy comparisons | Provide concordance evidence when different epitopes show similar staining [34] |
| Tagging Systems (FLAG, GFP) | Expression of tagged proteins for localization comparison | Match test antibody signal with anti-tag antibody pattern [32] |
| Mass Spectrometry Platforms | IP-MS for definitive target identification | Identify true antibody targets and potential off-target interactions [40] |
| Cell Line Panels | Biological model validation across expression levels | Test antibody performance in multiple biological contexts [40] |
| Public Databases | Orthogonal data source and literature evidence | Antibodypedia, CiteAb, IHC antibody databases [42] |
| Positive/Negative Control Tissues | Application-specific performance assessment | Ensure expected staining patterns in relevant biological systems [3] |
| Standardized Buffers & Fixatives | Consistency across validation experiments | Particularly important for cytology specimens with alternative fixatives [3] |
This toolkit represents essential resources for implementing comprehensive antibody validation protocols. The specific reagents required will vary based on the validation strategies employed, but these core components support everything from basic specificity testing to advanced mass spectrometry-based confirmation.
Antibody validation represents a critical foundation for reproducible IHC research, requiring a systematic, multi-faceted approach that progresses from thorough literature review to appropriate control selection. The framework established by the IWGAV, complemented by specific guidelines from organizations like CAP, provides researchers with a robust methodology for demonstrating antibody specificity. While the validation process requires significant investment of time and resources, this investment is essential to ensure research quality and reliability. As the field continues to evolve, with emerging technologies like artificial intelligence and improved mass spectrometry methods, validation protocols will undoubtedly become more standardized and accessible. However, the fundamental principle remains unchanged: rigorous, application-specific validation is not optional but essential for generating trustworthy scientific data in immunohistochemistry and all antibody-based research.
Knockout/Knockdown Validation for Specificity
In immunohistochemistry (IHC) research, validating the specificity of an antibody-antigen interaction is fundamental to data integrity. Genetic strategies utilizing CRISPR-Cas9 knockout (KO) and knockdown (KD) cell lines provide a powerful experimental framework for this validation. By completely removing the target protein, researchers can definitively test whether antibody binding is specifically eliminated, thereby confirming antibody specificity. This guide objectively compares the leading experimental approaches and bioinformatics tools for CRISPR validation, providing researchers with current methodologies to ensure reliable IHC results.
Comparative Analysis of Validation Methods
The table below summarizes the performance characteristics of primary validation methodologies used to confirm genetic knockout specificity.
Table 1: Comparison of Key Knockout/Knockdown Validation Methods
| Method | Key Measured Output | Detection Capability | Throughput | Key Advantage | Notable Limitation |
|---|---|---|---|---|---|
| Sanger Sequencing | DNA sequence at target locus | Precise indel sequence | Low | Direct confirmation of genomic edit [43] | Limited scope; misses large, unanticipated transcriptional changes [43] |
| RNA Sequencing (RNA-seq) | Complete transcriptome profile | Unplanned exon skipping, inter-chromosomal fusions, large deletions [43] | Medium | Comprehensive view of transcriptional consequences; identifies changes invisible to DNA-based methods [43] | Higher cost and computational burden |
| Western Blot | Target protein presence/absence | Confirmation of protein-level knockout | Medium | Direct evidence of successful protein ablation [44] | Cannot detect in-frame indels that produce non-functional protein [45] |
| CelFi Assay | Proportion of out-of-frame (OoF) indels over time [46] | Cellular fitness defect caused by gene knockout | Medium-High | Functional validation linking gene loss to expected phenotype; robust across different sgRNAs and gene copy numbers [46] | Requires knowledge of expected cellular phenotype |
Detailed Experimental Protocols
Comprehensive RNA-seq Validation Workflow
RNA sequencing provides the most thorough assessment of on-target and unexpected off-target transcriptional events.
Methodology:
- Cell Line Creation: Generate KO cell lines via CRISPR-Cas9 using validated sgRNAs [43].
- RNA Extraction & Sequencing: Harvest RNA from control and KO cell pools or clones. Perform deep RNA sequencing (recommended depth >50 million reads per sample) to enable de novo transcript assembly [43].
- Data Analysis: Utilize the Trinity tool for de novo transcript assembly to characterize transcripts not present in reference genomes. This approach can identify anomalies such as inter-chromosomal fusion events, exon skipping, chromosomal truncation, and unintentional transcriptional modification of neighboring genes [43].
Interpretation: Successful knockout is confirmed by complete absence or dramatic reduction of target gene transcripts. Specificity is validated by ensuring minimal disruption to the expression of closely related genes or genes with high sequence similarity.
CelFi Assay for Functional Validation
The Cellular Fitness (CelFi) assay provides a robust method to validate gene essentiality by monitoring the persistence of knockout alleles over time.
Methodology:
- RNP Transfection: Transiently transfect cells with ribonucleoproteins (RNPs) composed of SpCas9 protein complexed with an sgRNA targeting the gene of interest [46].
- Longitudinal Sampling: Collect genomic DNA from the cell pool at multiple time points (e.g., days 3, 7, 14, and 21 post-transfection) [46].
- Targeted Deep Sequencing & Analysis: Perform targeted deep sequencing of the edited locus. Analyze sequence files using tools like CRIS.py to categorize indels into in-frame, out-of-frame (OoF), and 0-bp indels. Calculate the "fitness ratio" by normalizing the percentage of OoF indels at day 21 to day 3 [46].
Interpretation: A fitness ratio less than 1 indicates a selective growth disadvantage for cells with OoF indels, confirming the gene is essential for cellular fitness. A ratio of ~1 suggests no fitness defect. This assay correlates well with Chronos scores from the Cancer Dependency Map (DepMap) [46].
Integrated DNA/Protein Validation Approach
This multi-modal approach combines genomic and proteomic confirmation for comprehensive validation.
Methodology:
- Optimized Transfection: Use an inducible Cas9 system (iCas9) in human pluripotent stem cells (hPSCs) with systematically optimized parameters including nucleofection stress tolerance, sgRNA stability, and cell-to-sgRNA ratio [45].
- INDEL Efficiency Measurement: Assess insertion/deletion (INDEL) efficiency via Sanger sequencing analyzed with algorithms like ICE (Inference of CRISPR Edits). This optimized system can achieve INDEL efficiencies of 82-93% for single-gene knockouts [45].
- Western Blot Confirmation: Perform Western blotting on the edited cell pool to confirm ablation of the target protein, even when INDEL efficiency appears high [45].
Interpretation: Successful knockout is confirmed by high INDEL rates coupled with complete loss of protein signal on Western blot. This approach is particularly critical for identifying "ineffective sgRNAs" that generate high INDEL rates but fail to eliminate protein expression [45].
Visualizing the Validation Workflow
The following diagram illustrates the key decision points in selecting and applying the appropriate validation strategy.
Research Reagent Solutions
The table below outlines essential reagents and tools required for implementing robust knockout validation protocols.
Table 2: Key Research Reagents and Tools for CRISPR Validation
| Reagent/Tool | Function/Purpose | Examples & Notes |
|---|---|---|
| sgRNA Design Algorithms | Predicts sgRNA on-target efficiency and off-target risk | Benchling (most accurate per [45]), VBC scores [47], Rule Set 3 [47] |
| Validated Positive Control sgRNAs | Optimization and experimental control | Species-specific controls essential; e.g., target AAVS1 (PPP1R12C) safe harbor locus [46] [45] |
| Cas9 Expression System | Delivers nuclease function | Doxycycline-inducible SpCas9 (iCas9) for tunable expression [45]; SpCas9 RNP complexes for direct delivery [46] |
| Bioinformatics Analysis Tools | Analyzes editing outcomes from sequencing data | CRISPResso [48], CHOPCHOP [48], ICE (Inference of CRISPR Edits) [45], CRIS.py [46] |
| CRISPR Libraries | Provides pre-designed sgRNA sets for screening | Vienna-single (top 3 VBC guides/gene) [47], Yusa v3 [47], MiniLib-Cas9 [47] |
| NGS Platforms | Enables deep sequencing for comprehensive validation | Required for RNA-seq and CelFi assay; enables detection of complex structural variants [43] [46] |
Validating CRISPR-mediated knockouts with multiple orthogonal methods is essential for confirming antibody specificity in IHC research. While Sanger sequencing provides basic confirmation of genomic edits, RNA-seq reveals comprehensive transcriptional consequences, Western blot confirms protein ablation, and the CelFi assay offers functional validation. The integration of these approaches, supported by optimized sgRNA design and robust bioinformatics tools, provides a definitive framework for establishing the specificity of genetic perturbations and the antibodies used to detect their effects.
In the field of immunohistochemistry (IHC) research, antibody validation is not merely a recommended practice but a fundamental requirement for generating reliable, reproducible data. The complexity of tissue samples and the specialized preparation methods involved in IHC create numerous opportunities for artifacts and false results [49]. Orthogonal methods—defined as verification techniques based on different biological or technical principles—provide essential confirmation of IHC findings by offering independent lines of evidence. This approach is particularly crucial for biomarker development and companion diagnostic tests, where accurate target detection directly impacts patient treatment decisions [50] [49].
The College of American Pathologists (CAP) guidelines emphasize the importance of rigorous validation, recommending that IHC results be compared with non-immunohistochemical methods such as flow cytometry or fluorescent in-situ hybridization as part of a comprehensive validation strategy [3]. This multi-technique approach is vital because antibodies that perform well in one application may fail completely in others due to differences in sample processing, epitope accessibility, or detection systems [49]. For example, during the development of a Claudin-6 antibody for IHC, researchers found that clones which worked perfectly in Western blot (WB), immunoprecipitation (IP), and immunofluorescence (IF) failed during IHC validation due to non-specific nuclear signal in both positive and negative control cell pellets [49].
Key Orthogonal Methods for IHC Confirmation
Western Blotting
Western blotting serves as a fundamental orthogonal method for confirming antibody specificity by characterizing target proteins based on molecular weight. This technique is particularly valuable for identifying cross-reactivity with unrelated proteins or confirming detection of specific protein isoforms [1] [49].
During the development of a Claudin-6 antibody, researchers employed a binary model system using OVCAR-3 (+) and DU 145 (-) cell lines [49]. Western blotting of hundreds of antibody samples identified candidates that detected proteins at the correct molecular weight (23 kDa) in OVCAR-3 lysates while showing no signal in DU 145 lysates [49]. This step provided initial specificity validation before proceeding to more complex IHC testing.
The primary limitation of Western blotting is that it analyzes denatured proteins from solubilized tissues, which may not fully represent the native conformation of antigens in fixed tissue sections [50]. However, it remains an essential first step in comprehensive antibody validation workflows.
Mass Spectrometry-Based Proteomics
Liquid chromatography-mass spectrometry (LC-MS) proteomics has emerged as a powerful orthogonal method for definitive target identification, particularly for challenging targets where antibody specificity is difficult to establish [49]. This approach provides direct, unbiased protein identification without reliance on antibody recognition.
In the Claudin-6 antibody development case, researchers used LC-MS proteomics to analyze FFPE tumor blocks and identify tissues with high, medium, and low expression levels of Claudin-6 [49]. This mass spectrometry data provided an objective standard against which IHC staining patterns could be compared, enabling confirmation that antibody clones were specifically staining Claudin-6 rather than cross-reacting with similar proteins [49].
The major advantages of mass spectrometry include its ability to definitively identify proteins based on mass spectra rather than antibody binding and to detect potential cross-reactivities through identification of all proteins present in a sample [50]. The main limitations are requirements for specialized equipment, expertise, and the destructive nature of the analysis.
Flow Cytometry
Flow cytometry provides excellent orthogonal validation for cell surface markers, offering quantitative analysis of antigen expression at single-cell resolution [1]. This method is particularly valuable for confirming membrane localization and determining the percentage of positive cells in a heterogeneous population.
For targets expected to have membrane localization, such as Claudin-6, flow cytometry can be used to confirm positive or negative biomarker expression in control cell lines before their use in IHC validation [1]. This builds confidence in the expression profile of control materials and forms part of the comprehensive validation process.
A significant advantage of flow cytometry is its ability to provide quantitative data on the percentage of positive cells and antigen density, complementing the morphological context provided by IHC [1]. The technique requires cells in suspension rather than tissue sections, which may limit its application for some solid tumor markers.
Genetic Techniques
Genetic approaches, including siRNA knockdown and overexpression systems, provide powerful functional validation of antibody specificity by directly manipulating target protein levels [1]. These methods establish a causal relationship between target presence and antibody detection.
According to published validation guidelines, cell culture lines can be manipulated by transfection to introduce different 'dose' levels of the target in otherwise weakly positive or negative cell lines [1]. Similarly, siRNA silencing has been shown to be effective in 80% of cases in a recent confocal study screening 765 proteins using 75 antibodies [1]. These genetic manipulation techniques create controlled systems where expected staining patterns can be predicted based on known genetic perturbations.
The primary strength of genetic techniques is their ability to demonstrate specificity through dose-dependent changes in staining intensity corresponding to manipulated target expression levels [1]. These approaches require suitable cell culture models and validation of successful genetic manipulation.
Fluorescent In Situ Hybridization (FISH)
For gene amplification markers, FISH provides direct genetic confirmation of IHC results based on a completely different detection principle [3]. This method is particularly valuable for predictive markers like HER2, where discrepancies between IHC and FISH can occur.
The CAP guidelines specifically recommend comparing new IHC assay results with non-immunohistochemical methods such as fluorescent in-situ hybridization as a stringent comparator for validation study design [3]. This approach is ordered as one of the most stringent comparators available, behind only comparison to cell lines containing known amounts of protein [3].
FISH has the advantage of being performed on tissue sections similar to IHC, allowing direct correlation of genetic and protein expression data within morphological context. The technique is particularly resistant to effects of pre-analytical variables like fixation that can affect IHC results [51].
Comparative Analysis of Orthogonal Methods
Table 1: Comparison of Key Orthogonal Validation Methods for IHC
| Method | Key Principle | Information Provided | Throughput | Key Applications in IHC Validation |
|---|---|---|---|---|
| Western Blotting | Protein separation by size and immunodetection | Specificity based on molecular weight, isoform detection | Medium | Initial specificity screening, identifying cross-reactive proteins [49] |
| Mass Spectrometry | Protein identification by mass-to-charge ratio | Definitive target identification, detection of cross-reactivities | Low | Definitive validation for challenging targets, characterizing LDTs [49] |
| Flow Cytometry | Light scattering and fluorescence of cells in suspension | Quantitative cell surface expression, percentage of positive cells | High | Validating membrane markers, creating control cell lines [1] |
| Genetic Techniques | Target modulation via transfection/RNAi | Specificity through dose-dependent staining changes | Medium | Functional specificity confirmation, controlled system validation [1] |
| FISH | Fluorescent nucleic acid probe hybridization | Gene amplification status, genetic alteration correlation | Low | Resolving discrepant IHC, validating genetic alteration markers [3] |
Table 2: Method-Specific Experimental Requirements and Limitations
| Method | Sample Requirements | Specialized Equipment | Key Limitations | Data Output |
|---|---|---|---|---|
| Western Blotting | Cell or tissue lysates | Gel electrophoresis system, transfer apparatus, imaging | Denatured proteins, no morphological context | Band pattern, molecular weight confirmation [49] |
| Mass Spectrometry | FFPE tissue sections, cell pellets | LC-MS instrumentation | Destructive analysis, expertise required | Definitive protein identification, peptide sequences [49] |
| Flow Cytometry | Single-cell suspensions | Flow cytometer | Requires dissociated cells, no tissue architecture | Percentage positive cells, fluorescence intensity [1] |
| Genetic Techniques | Cultured cell lines | Transfection equipment | May not represent native tissue context | Dose-response relationship, specificity confirmation [1] |
| FISH | Tissue sections | Fluorescence microscope | Lower throughput, expertise required | Gene copy number, amplification status [3] |
Experimental Protocols for Key Orthogonal Methods
Western Blotting Validation Protocol
The Western blotting validation protocol begins with preparation of control cell lines with known expression status of the target protein [49]. For example, in Claudin-6 antibody validation, researchers used OVCAR-3 (+) and DU 145 (-) cell lines as positive and negative controls, respectively [49].
Key steps include:
- Prepare lysates from positive and negative control cell lines
- Separate proteins by SDS-PAGE (10-20 µg per lane)
- Transfer to PVDF or nitrocellulose membrane
- Block with 5% non-fat milk or BSA in TBST
- Incubate with primary antibody (typically 1:1000 dilution, 4°C overnight)
- Incubate with HRP-conjugated secondary antibody (1:2000-1:5000, room temperature, 1 hour)
- Detect using ECL or similar chemiluminescent substrate
- Compare band patterns with expected molecular weight
Validation criteria: Clear detection of bands at expected molecular weight in positive control with minimal to no signal in negative control [49]. Significant bands in negative control may indicate cross-reactivity.
Mass Spectrometry Validation Protocol
Liquid chromatography-mass spectrometry (LC-MS) proteomics provides definitive protein identification. The protocol for orthogonal validation of IHC antibodies includes:
Sample preparation:
- Select FFPE tissue blocks with characterized expression levels
- Process tissue sections for LC-MS analysis
- Perform protein extraction and digestion
- Analyze peptide mixtures by LC-MS
Data analysis:
- Identify Claudin-6 specific peptides
- Quantify expression levels across tissue samples
- Categorize tissues as high, medium, or low expressors
- Compare IHC staining patterns with mass spectrometry data
Validation criteria: Strong correlation between mass spectrometry quantification and IHC staining intensity across the tissue set [49]. This approach was used successfully to validate Claudin-6 (E7U2O) XP Rabbit mAb #18932 by confirming specific staining in mass-spectrometry-characterized tissues [49].
Flow Cytometry Validation Protocol
Flow cytometry provides quantitative validation for cell surface markers:
Cell preparation:
- Culture positive and negative control cell lines
- Harvest cells and prepare single-cell suspension
- Aliquot approximately 10^6 cells per tube
Staining procedure:
- Wash cells with PBS containing 1% BSA
- Incubate with primary antibody (typically 1:100-1:500 dilution, 30-60 minutes, 4°C)
- Wash to remove unbound antibody
- Incubate with fluorescent-conjugated secondary antibody (30 minutes, 4°C, protected from light)
- Wash and resuspend in buffer for analysis
- Analyze using flow cytometer
Validation criteria: Clear separation between positive and negative cell populations, with appropriate staining in known positive controls and minimal signal in negative controls [1].
Genetic Manipulation Protocol
Genetic techniques provide functional validation of antibody specificity:
Overexpression approach:
- Transfect target gene into low/negative expression cell line
- Include vector-only control
- Confirm expression by Western blot or RT-PCR
- Process transfected cells for IHC (cell pellets or cytospins)
- Compare staining between transfected and control cells
Knockdown approach:
- Transfect target-specific siRNA into high-expression cell line
- Include non-targeting siRNA control
- Confirm knockdown efficiency by Western blot
- Process cells for IHC analysis
- Compare staining between knockdown and control cells
Validation criteria: Dose-dependent staining intensity corresponding to manipulated target expression levels [1]. Transfected cells should show appropriate staining while a proportion of cells may remain negative or weakly stained, helping differentiate specific signal from background [1].
Integration of Orthogonal Methods in Comprehensive Workflow
A strategic orthogonal validation workflow incorporates multiple methods to build compelling evidence for antibody specificity. The following diagram illustrates a comprehensive approach:
This integrated workflow begins with standard techniques like Western blotting and flow cytometry, progresses to functional genetic validation, and employs advanced methods like mass spectrometry or FISH for challenging targets or specific applications.
Research Reagent Solutions for Orthogonal Validation
Table 3: Essential Research Reagents for Comprehensive Antibody Validation
| Reagent/Category | Specific Function | Application Examples | Considerations for Selection |
|---|---|---|---|
| Validated Cell Lines | Positive/negative controls for initial specificity testing | OVCAR-3 and DU 145 for Claudin-6 [49] | Expression should be confirmed by multiple methods [1] |
| LC-MS Proteomics | Definitive protein identification | Characterizing FFPE tumor blocks for target expression [49] | Requires specialized instrumentation and expertise |
| siRNA/Plasmids | Genetic manipulation of target expression | Target knockdown/overexpression for specificity confirmation [1] | Efficiency must be verified independently |
| FFPE Tissue Microarrays | High-throughput IHC validation across multiple tissues | Comparing staining patterns with mass spectrometry data [49] | Should include positive, negative, and borderline cases |
| Reference Standards | Calibrators with traceable units of measure | NIST SRM 1934 for quantitative IHC characterization [52] [53] | Emerging technology with limited availability |
Case Study: Comprehensive Claudin-6 Antibody Validation
The development of Claudin-6 (E7U2O) XP Rabbit mAb #18932 exemplifies the rigorous application of orthogonal methods [49]. Initial clones identified through Western blot screening failed during IHC validation, demonstrating non-specific nuclear signal in both positive (OVCAR-3) and negative (DU 145) cell pellets [49].
Researchers addressed this challenge through an integrated approach:
- LC-MS proteomics identified FFPE tumor blocks with high, medium, and low Claudin-6 expression
- Multiple antibody clones were screened on characterized tissues
- Staining patterns were compared with mass spectrometry data
- Cross-reactivity testing confirmed no reaction with closely related proteins like Claudin-9
This comprehensive validation strategy, incorporating both standard orthogonal methods and advanced proteomics, ultimately identified a clone (E7U2O) that demonstrated specific and sensitive staining in IHC applications on FFPE tissue [49]. The successful validation enabled researchers to provide a reliable research tool for studying this promising immuno-oncology target.
Orthogonal methods provide essential independent verification of IHC antibody specificity, forming the foundation of rigorous biomarker validation. While no single technique can address all potential validation challenges, a strategic combination of Western blotting, flow cytometry, genetic manipulation, mass spectrometry, and FISH can build compelling evidence for antibody reliability.
As IHC continues to play a critical role in both basic research and clinical diagnostics, particularly for companion diagnostic development [52] [53], the implementation of comprehensive orthogonal validation workflows becomes increasingly important. By employing these complementary techniques, researchers can ensure that their IHC results accurately reflect target biology rather than technical artifacts, ultimately advancing both scientific understanding and patient care.
In modern immunohistochemistry (IHC) research, particularly in clinical diagnostics and drug development, the assumption that an antibody validated for one specimen type will perform equally well on another is a dangerous misconception. Application-specific validation is a mandatory process that ensures analytical accuracy and reproducible results across diverse sample preparations. This necessity is especially critical for predictive biomarkers that directly influence therapeutic decisions, such as PD-L1, ALK, and ROS1, where false positives or negatives can directly impact patient care [54] [55].
The foundation of reliable IHC rests on demonstrating that an antibody specifically detects its intended target in the specific context of its use. This context encompasses the specimen type (e.g., formalin-fixed paraffin-embedded [FFPE] tissue versus cytology smears), fixation method, and pre-analytical processing [3] [56]. As the College of American Pathologists (CAP) emphasizes in its 2024 guideline update, laboratories must separately validate IHC assays for each unique application, including distinct scoring systems for different tumor types and specific specimen preparations [3]. This guide provides a structured comparison of validation requirements for FFPE tissues versus cytology specimens, supported by experimental data and detailed protocols essential for researchers and drug development professionals.
Comparative Validation Requirements Across Specimen Types
The validation process must be tailored to the unique challenges posed by different sample types. The table below summarizes the core considerations and requirements for FFPE tissues versus cytology specimens.
Table 1: Key Comparison of Validation Requirements for FFPE vs. Cytology Specimens
| Validation Aspect | FFPE Tissues | Cytology Specimens |
|---|---|---|
| Primary Fixative | 10% Neutral Buffered Formalin (NBF); fixation time 6-72 hours is critical for predictive markers [54] [57] | Variable; includes methanol, ethanol, proprietary liquid-based fixatives, with possible NBF post-fixation for cell blocks [56] [55] |
| Key Pre-Analytical Challenge | Standardized fixation time; avoidance of over-/under-fixation [54] | Lack of standardized processing protocols; variable antigenicity due to non-formalin fixatives [55] |
| CAP Validation Sample Minimum | Established during lab validation; 2024 guidelines harmonize requirements for predictive markers [3] | Minimum of 10 positive and 10 negative cases for specimens fixed in alternative (non-FFPE) fixatives [3] |
| Typical Control Material | FFPE tissue sections with known expression [58] | Commercially available cell lines or cytology samples with known antigen expression; FFPE controls are inadequate for non-FFPE cytology [55] |
| Major Consideration for Predictive Markers | Clone-specific validation and tumor-specific scoring systems are required (e.g., PD-L1 clones 22C3 and SP142) [54] [59] | Rigorous validation with possible optimization of FFPE protocols is mandatory; false negatives are a significant risk [56] [55] |
Experimental Data and Performance Comparison
Performance of Predictive Biomarkers in Cytology Specimens
Translating predictive biomarker tests from FFPE tissues to cytology samples requires demonstrating comparable analytical performance. The following table compiles real-world data on the sensitivity and specificity of key predictive immunocytochemistry (ICC) assays performed on cytology specimens.
Table 2: Analytical Performance of Predictive Biomarkers in NSCLC Cytology Specimens [55]
| Biomarker (Antibody Clone) | Cytology Preparation Type | Number of Samples (N) | Sensitivity (%) | Specificity (%) | Reference Method |
|---|---|---|---|---|---|
| ALK (5A4) | Cell Block (CB) | 97 | 100 | 100 | FISH |
| ALK (D5F3) | Cell Block (CB) | 66 | 100 | 83 | FISH |
| ALK (D5F3) | Smears, LBC, CB | 71 | 66 | 100 | FISH |
| ROS1 (D4D6) | Cell Block, Smears, Cytospin | 40 | 88-100 | 92-98 | FISH/NGS |
Inter-Assay Concordance for Critical Biomarkers
For biomarkers like PD-L1, where multiple antibody clones and scoring systems exist, understanding inter-assay concordance is vital for validation and clinical application.
Table 3: Comparison of PD-L1 Antibody Clones and Their Clinical Applications [54] [59]
| PD-L1 Antibody Clone | FDA-Approved as Companion Diagnostic For | Key Findings from Comparative Studies |
|---|---|---|
| 22C3 | Pembrolizumab (NSCLC, cervical SqCC, HNSCC, others) [54] | Clones 22C3, 28-8, SP263, and E1L3N showed positive correlation and comparable membrane staining patterns, though SP263 identified more positive cases in one study [59]. |
| SP142 | Atezolizumab (Urothelial Carcinoma, NSCLC) [54] | Passed Western blot and IHC validation, providing a staining pattern comparable to the reference clone 5H1 [59]. |
| SP263 | - | Often identifies more PD-L1-positive cases compared to other clones; requires careful pathologist evaluation [59]. |
| 28-8 | - | Comparable to other validated clones, but each clone and primary site must be separately validated [54] [59]. |
Essential Experimental Protocols for Validation
Protocol for IHC on FFPE Tissues
The following workflow outlines the standard protocol for IHC on FFPE tissues, highlighting critical steps that require optimization during validation [57].
Critical Steps for FFPE Validation [57]:
- Fixation: Immerse tissue in 10% Neutral Buffered Formalin (NBF) for 18-24 hours at 4°C. Under-fixation can cause edge staining artifacts, while over-fixation can mask epitopes.
- Antigen Retrieval: This is a crucial step for reversing methylene bridge cross-links formed during formalin fixation. Use Heat-Induced Epitope Retrieval (HIER) by placing sections in a appropriate buffer (e.g., citrate, EDTA) and heating in a microwave, pressure cooker, or steamer.
- Antibody Incubation: Use predetermined antibody concentrations and incubation conditions (time, temperature) established during validation. Include appropriate positive and negative controls.
Protocol for Validating Antibodies on Cytology Specimens
Validating an antibody for cytology specimens that have already been validated on FFPE tissues requires a comparative approach to ensure performance parity.
Key Considerations for Cytology Validation [3] [56] [55]:
- Sample Selection: Per CAP guidelines, a minimum of 10 positive and 10 negative cases for each cytology specimen type (e.g., smear, liquid-based cytology, cell block) fixed in alternative fixatives is required [3].
- Concordance Assessment: Compare immunoreactivity between the established FFPE cell block and the alternative cytology preparation. The staining should be concordant in expected positive and negative cells.
- Optimization: If the initial validation fails (e.g., false negatives), optimize the protocol by altering antibody dilution, incubation time, or antigen retrieval method specifically for the cytology fixative [56].
Protocol for Molecular Biomarker Validation on Cytology
Cytology specimens are increasingly used for next-generation sequencing (NGS). The following protocol, based on a prospective multicenter trial, ensures high-quality results [60].
- Specimen Collection: Collect specimens via brushing, needle aspiration washing, or pleural effusion. Immediately preserve the sample in a non-formalin, ammonium sulfate-based nucleic acid stabilizer to inhibit nuclease activity [60].
- Nucleic Acid Purification: Use dedicated kits for stabilized liquid samples (e.g., Maxwell RSC Blood DNA and simplyRNA Cells Kits). For FFPE cell blocks, use FFPE-specific kits [60].
- Quality Control (QC): Quantify nucleic acids using a fluorometer (e.g., Qubit). Assess DNA quality via the DNA Integrity Number (DIN) and the ratio of double-stranded to total DNA. For RNA, use metrics like DV200% [60] [61].
- Analysis: Proceed with library preparation and sequencing using a validated NGS panel. The success rate for gene panel analysis using properly stabilized cytology specimens can be very high (98.4%) [60].
The Scientist's Toolkit: Essential Research Reagent Solutions
The following table details key reagents and materials critical for successful IHC/ICC validation experiments.
Table 4: Essential Research Reagents and Materials for IHC/ICC Validation
| Reagent/Material | Function/Purpose | Examples & Notes |
|---|---|---|
| 10% Neutral Buffered Formalin (NBF) | Standard fixative for FFPE tissues; cross-links proteins to preserve morphology [57]. | Critical for predictive markers like breast biomarkers; requires controlled fixation time [54]. |
| Methanol/Acetone-Based Fixatives | Common fixatives for non-FFPE cytology preparations (smears, cytospins) [56]. | Can reduce antigenicity for some targets, requiring protocol optimization [56] [55]. |
| Antigen Retrieval Buffers | To break methylene cross-links from formalin fixation and expose epitopes [57]. | Citrate (pH 6.0) or EDTA (pH 9.0) buffers; used in Heat-Induced Epitope Retrieval (HIER). |
| Validated Primary Antibodies | To specifically bind the target protein of interest in fixed samples. | Clones must be validated for specific applications (e.g., PD-L1 22C3 for NSCLC) [54] [59]. |
| Detection Kit (HRP/DAB or AP/Vector Red) | To visualize the bound primary antibody via a colorimetric reaction [58]. | HRP/DAB is common; AP-Vector Red can be preferable for tissues with inherent brown pigment [58]. |
| Cell Lines (Transfected/Control) | Serve as positive and negative controls for antibody validation [62] [58]. | e.g., 293T cells transfected with target gene; essential for validating cytology specimens [55]. |
| Nucleic Acid Stabilizer | Preserves DNA/RNA in liquid cytology samples for molecular testing [60]. | Non-formalin, ammonium sulfate-based stabilizers allow room temp storage/transport [60]. |
| Tissue & Cell Pellet Arrays | Multiplexed tools for high-throughput antibody validation across many tissues/cell lines [59] [58]. | Include positive and negative controls; used by antibody manufacturers for validation [59]. |
The paradigm of "one antibody, one validation" is obsolete in modern IHC research. Robust, reproducible, and clinically actionable results demand a rigorous, application-specific validation framework. As demonstrated, the validation criteria, protocols, and performance characteristics differ significantly between FFPE tissues and cytology specimens, and are further complicated by the stringent requirements of predictive biomarkers. Adherence to updated professional guidelines [3], a thorough understanding of pre-analytical variables, and the implementation of the detailed experimental protocols and comparisons outlined in this guide are fundamental for researchers and drug development professionals to ensure the highest quality of tissue-based research and diagnostics.
Refining the Protocol: Troubleshooting Common Issues and Enhancing Performance
In immunohistochemistry (IHC) research, the accuracy of protein detection depends not only on the specificity of antibodies but also on the biological integrity of the tissue sample itself. Pre-analytical variables—those factors that affect the sample from the moment it is collected from the patient until the start of the IHC staining process—represent a critical and often underestimated source of variation. These variables, including tissue handling, fixation conditions, and ischemia time, directly impact protein preservation, epitope availability, and ultimately, the reliability of experimental data. For researchers and drug development professionals, controlling these factors is not merely a matter of protocol but a fundamental component of antibody validation and reproducible science. This guide examines the direct effects of these variables on IHC outcomes, providing comparative experimental data and methodologies to standardize these crucial initial steps.
The Impact of Pre-Analytical Variables on IHC Results
Tissue Ischemia and Its Consequences
Cold ischemia time, defined as the period between tissue resection and the initiation of fixation, can induce protein degradation and epitope alteration. During this time, the tissue, though removed from blood supply, remains metabolically active, leading to enzymatic degradation and autolysis.
Key Evidence:
- A study on breast cancer specimens found that estrogen receptor (ER) immunohistochemical staining remained relatively stable even with cold ischemia times up to 4 hours, showing a weighted Kappa statistic for concordance of 0.86 (95% CI, 0.74–0.99) between core biopsy and resection specimens. However, a trend of decreased ER staining was observed with ischemia times exceeding 2 hours [63].
- Research on non-small-cell lung cancer (NSCLC) demonstrated that impaired fixation, often a consequence of prolonged ischemia, resulted in significantly decreased IHC staining intensity for markers including KER-MNF116 and p40 [64].
- Proteins such as Ki-67 and phosphoproteins are particularly vulnerable to ischemic effects, making strict control of ischemia time critical for these targets [65].
Fixation Delay and Duration
The fixation process halts degradation and preserves tissue architecture. The type of fixative, the delay before its application, and the total fixation time are all critical.
Comparative Experimental Data: A systematic study on NSCLC resection specimens evaluated the impact of delayed and prolonged fixation on 20 different IHC antibodies. The following table summarizes the key findings [66]:
Table 1: Impact of Fixation Delay on IHC Staining in NSCLC
| Parameter Assessed | Findings with Delayed Fixation (vs. Standard) | Findings with Prolonged Fixation (vs. Standard) |
|---|---|---|
| TMA Core Integrity | Significant loss of cores (35% not available) | Minimal core loss (27% not available) |
| Tissue Quality | Deterioration leading to poor IHC quality | No significant impact on quality |
| Staining Intensity | Significant reduction for CK7, TTF-1, C-MET, Napsin A, PD-L1, and others | No significant negative impact |
| Key Conclusion | Delay negatively affects diagnostic and predictive markers | Prolonged fixation (up to 7 days) showed no major adverse effects |
This study conclusively demonstrates that a delay in fixation is far more detrimental to IHC results than prolonging the fixation time itself.
Fixation Quality and Heterogeneity
The quality of fixation is not always uniform, even within a single specimen. This heterogeneity can confound IHC interpretation.
Key Evidence:
- An analysis of NSCLC resections found that IHC staining intensity was significantly higher in microscopically defined adequately fixed tumor areas compared to inadequately fixed areas within the same tumor. This was observed for markers including KER-MNF116 and p40, and a trend was present for others like PD-L1 [64].
- All IHC stains showed significantly different staining intensities within tumors, indicating naturally heterogeneous immunoreactivity. This underscores the need for pathologists to be aware of fixation quality during interpretation [64].
Essential Experimental Protocols for Validation
Protocol 1: Assessing Ischemia Time Effects
This protocol is adapted from a retrospective study on ER in breast cancer [63].
Objective: To determine the impact of prolonged cold ischemia time on the stability of a specific protein target.
Materials:
- Paired tissue samples (e.g., core biopsy with minimal ischemia and resection specimen with recorded prolonged ischemia).
- Standard IHC equipment and validated antibodies for the target of interest.
Methodology:
- Cohort Selection: Identify pairs of core biopsy and resection specimens from the same patient. Record the precise cold ischemia time for the resection specimen (time from resection to fixation).
- IHC Staining: Perform IHC for the target protein on both samples using an identical, standardized protocol.
- Scoring and Analysis: Have pathologists score the staining (e.g., percentage of positive cells and intensity) in a blinded fashion. Compare the results between the paired samples using statistical tests like weighted Kappa statistics for categorical concordance and Spearman correlation for the relationship between staining difference and ischemia time.
Protocol 2: Systematic Evaluation of Fixation Delay
This protocol is based on a multi-institutional study on lung cancer [66].
Objective: To quantify the effects of deliberate fixation delay on a panel of IHC markers.
Materials:
- Fresh tumor tissue from a resection specimen >4 cm.
- 10% Neutral Buffered Formalin (NBF).
- Equipment for Tissue Microarray (TMA) construction.
Methodology:
- Sample Collection and Processing: Collect multiple samples (e.g., 10) of equal size from a single tumor.
- Fixation Protocol: Subject samples to different fixation schedules as shown in the workflow below. This includes immediate fixation for 24 hours (control), delayed fixation (e.g., 1, 6, 24, 48, 96 hours delay before 24-hour fixation), and prolonged fixation (e.g., 2, 4, 7 days).
- TMA Construction and Staining: Create TMAs containing cores from all samples. Stain TMA sections with a panel of antibodies relevant to the tissue and research question.
- Scoring and Analysis: Score staining for intensity, quality, and core integrity. Use statistical tests (e.g., McNemar, Wilcoxon signed-rank) to compare delayed/prolonged samples against the standard fixation control.
The following workflow diagrams the experimental design and the cascading effects of pre-analytical variables on IHC outcomes.
Research Reagent Solutions and Essential Materials
The following table details key reagents and materials critical for controlling pre-analytical variables, as derived from the cited experimental protocols.
Table 2: Essential Research Reagent Solutions for Pre-Analytical Control
| Item | Function/Description | Key Considerations |
|---|---|---|
| 10% Neutral Buffered Formalin (NBF) | Gold standard fixative that cross-links proteins to preserve tissue morphology. | Maintains a neutral pH (~7.0) to prevent artefact formation. Tissue-to-fixative ratio of 1:10 to 1:20 is critical [65] [67]. |
| Citrate or EDTA Buffer | Solution for Heat-Induced Epitope Retrieval (HIER) to unmask epitopes cross-linked by formalin. | The pH of the retrieval buffer (6-10) must be optimized for each antibody-antigen pair [65] [68]. |
| Proteinase K, Trypsin | Enzymes for Protease-Induced Epitope Retrieval (PIER), an alternative to HIER for certain sensitive epitopes. | Method is difficult to control; requires precise optimization of concentration and incubation time [65] [68]. |
| Validated Primary Antibodies | Monoclonal antibodies are preferred for specificity and lot-to-lot consistency in long-term studies. | Must be validated for IHC on FFPE tissue. Specificity should be confirmed via knockout controls or orthogonal methods [69] [30]. |
| Tissue Microarray (TMA) | Platform to compare IHC staining across hundreds of tissue samples under identical conditions. | Essential for high-throughput, standardized comparison of staining effects, as used in fixation delay studies [66] [30]. |
The experimental data unequivocally demonstrates that pre-analytical variables, particularly prolonged ischemia and delayed fixation, are significant confounders in IHC research, capable of diminishing staining intensity and compromising data reliability. To uphold the integrity of antibody validation protocols, researchers must implement and document stringent pre-analytical controls.
Essential recommendations include:
- Minimize Ischemia: Keep cold ischemia time as short as possible, ideally under 1 hour, recognizing that some targets (e.g., phosphoproteins) are exceptionally vulnerable [65].
- Prioritize Rapid Fixation: Ensure prompt and adequate fixation in a sufficient volume of 10% NBF. A delay in fixation is more detrimental than prolonged fixation itself [66].
- Standardize and Document: Implement standardized SOPs for tissue handling, fixation, and processing across all experiments. Meticulously record all pre-analytical times and conditions for each sample [70] [3].
- Monitor Fixation Quality: Be aware of intra-specimen fixation heterogeneity and annotate tissue quality during pathological assessment to inform IHC interpretation [64].
By systematically addressing these pre-analytical foundations, researchers can significantly enhance the accuracy, reproducibility, and translational value of their immunohistochemistry data.
Heat-Induced Epitope Retrieval (HIER) stands as a foundational technique in modern immunohistochemistry (IHC), fundamentally enabling robust antibody binding to formalin-fixed, paraffin-embedded (FFPE) tissues. The widespread adoption of formalin fixation in histopathology, while excellent for preserving cellular architecture, creates a significant challenge for IHC by inducing protein cross-links that obscure antigenic sites through methylene bridges [71] [72]. This masking effect necessitates a reversal process to re-establish immunoreactivity. The groundbreaking discovery in 1991 that high-temperature heating could effectively reverse these cross-links revolutionized IHC, effectively dividing its timeline into pre- and post-antigen retrieval eras [72]. Today, HIER represents the gold standard retrieval method, having largely superseded proteolytic-induced epitope retrieval (PIER) due to its broader applicability and reduced risk of morphological damage [73] [74].
The principle behind HIER involves using elevated temperatures to disrupt formaldehyde-induced crosslinks, thereby restoring epitopes to their native conformations for antibody binding [71]. Interestingly, while high temperatures typically denature proteins, IHC for clinical applications primarily requires intact primary protein structures for binding, making the potential denaturation of secondary and tertiary structures largely irrelevant to antigenicity restoration [71]. The efficiency of HIER is influenced by multiple critical factors, including the temperature achieved during retrieval, the precise composition and pH of the retrieval buffer, the volume of solution used, and the extent of original tissue fixation [71]. Understanding and systematically optimizing these variables forms the cornerstone of effective immunohistochemistry protocols, particularly within rigorous antibody validation frameworks where reproducibility and signal intensity are paramount.
Comparative Analysis of HIER Methods
Performance Evaluation of HIER Platforms
HIER can be performed using several heating platforms, each with distinct operational principles, advantages, and limitations. Table 1 provides a systematic comparison of the most commonly employed methods, highlighting key performance characteristics relevant for research and diagnostic applications.
Table 1: Comparative Performance of Common HIER Heating Methods
| Method | Typical Temperature & Conditions | Protocol Duration | Key Advantages | Major Limitations |
|---|---|---|---|---|
| Pressure Cooker | 110-120°C under pressure (5-7 psi) [71] | ~45 minutes total cycle [71] | Higher temperatures decrease retrieval time; ideal for large batches; relatively low equipment cost [71] | Potential for over-retrieval; requires careful timing once pressure is reached |
| Water Bath | 92-95°C [75] [76] | 5-10 minutes incubation [76] | Gentle heating; suitable for delicate tissues; temperature uniformity | Longer retrieval times often required; lower temperature may be insufficient for some antigens |
| Microwave | 98-100°C [77] | 20 minutes at temperature [77] | Rapid heating; common lab equipment | High risk of uneven heating ("hot/cold spots"); frequent evaporation requiring buffer replenishment [77] |
| Vegetable Steamer/Rice Cooker | 95-100°C [77] | 20 minutes at temperature [77] | Avoids vigorous boiling of microwave; consistent temperature | Less precise temperature control; requires pre-heating of buffer |
| Automated Platform (Online HIER) | Varies by protocol (Mild, Standard, Extended) [71] | Protocol-dependent (e.g., 30-90 min) [71] | Full automation; minimal staff interaction; standardized conditions | Limited flexibility; decreased user control; potential for lower efficiency per unit time [71] |
Online vs. Offline HIER: A Critical Comparison
A significant development in HIER technology involves its integration into fully automated staining systems, creating a distinction between "online" HIER (performed within the automated instrument) and "offline" HIER (performed separately using pressure cookers or other methods). Online HIER typically employs direct application of a heating element to the underside of the slide while dispensing a thin layer of retrieval solution over the tissue [71]. This design allows the same module to be used for subsequent staining steps, minimizing the instrument's footprint.
However, comparative studies have revealed notable performance differences. One systematic investigation found that 75% of graded experimental slides using online HIER did not exceed the staining scores achieved by offline HIER slides processed in a pressure cooker under identical staining conditions. Even more significantly, within this 75%, 50% of the online HIER slides scored lower than their offline counterparts, despite employing extended retrieval times of up to 90 minutes [71]. The study concluded that online HIER generally required increased retrieval times—often an hour or more—to potentially match the staining intensity produced by offline pressure cooker methods [71]. These findings highlight a trade-off between automation efficiency and retrieval effectiveness, suggesting that fully automated online HIER systems may have limitations for particularly challenging antigens or when maximum signal intensity is critical.
Optimizing Buffer Conditions for Enhanced HIER
Buffer Composition and pH Effects
The chemical environment during heating profoundly influences HIER success, with buffer pH and composition being among the most critical optimization parameters. Different buffers facilitate the unmasking of epitopes through varied mechanisms, including hydrolytic cleavage of crosslinks, calcium ion chelation, and overall effects on protein charge and conformation [77] [72]. Table 2 summarizes the properties and applications of the most widely used HIER buffers.
Table 2: Characteristics and Applications of Common HIER Buffers
| Buffer Solution | Typical pH Range | Key Chemical Components | Best Suited For | Considerations |
|---|---|---|---|---|
| Sodium Citrate | 6.0 [77] [74] | 10 mM Sodium citrate, 0.05% Tween 20 [77] | Many nuclear and cytoplasmic antigens; widely used as a standard starting point [74] | Lower pH may be less effective for some phosphorylation-dependent epitopes |
| Tris-EDTA | 8.0 - 9.9 [77] [74] | 10 mM Tris base, 1 mM EDTA, 0.05% Tween 20 [77] | A broad range of antigens; particularly effective for many transcription factors and membrane proteins [74] | High pH enhances calcium chelation by EDTA, promoting crosslink reversal [74] |
| EDTA | 8.0 [77] | 1 mM EDTA [77] | Antigens requiring strong chelation; often effective when citrate fails | May require optimization of concentration to prevent tissue damage |
| Sodium Citrate with Tween 20 | 6.0 [77] | 10 mM Sodium citrate, 0.05% Tween 20 [77] | Improving buffer contact with hydrophobic tissue sections | Detergent helps wetting and penetration but may increase background if overused |
The selection of appropriate buffer pH exhibits dramatic effects on staining outcomes. Experimental data demonstrates this pH dependence clearly. For instance, in IHC detection of p27 in prostate cancer sections, incubation in neutral (pH 7.0) and basic (pH 9.5) retrieval solutions significantly enhanced detection compared to no HIER treatment, while an acidic (pH 5.0) solution provided no improvement [76]. This underscores the antigen-specific nature of buffer optimization and the general trend that high-pH buffers successfully retrieve a wider spectrum of antigens [74].
Systematic Optimization Strategy
Achieving optimal HIER conditions requires a structured experimental approach. The most effective strategy involves creating a matrix that simultaneously tests multiple variables, particularly buffer pH and incubation time [73] [75]. A typical optimization experiment would test acidic, neutral, and basic buffers across a range of heating durations (e.g., 1, 5, 10, 15 minutes) using serial tissue sections [75]. This approach efficiently identifies the combination that delivers the strongest specific signal with minimal background.
The following workflow diagram illustrates a systematic approach to HIER optimization, integrating key decision points and experimental steps:
Experimental Protocols for HIER Optimization
Standardized Pressure Cooker HIER Protocol
The pressure cooker method remains one of the most effective and widely adopted HIER techniques due to its ability to achieve temperatures above the boiling point of water, significantly enhancing retrieval efficiency for many challenging antigens [71]. The following protocol provides a robust foundation for optimization:
Materials Required:
- Domestic stainless steel pressure cooker [77]
- Hot plate or equivalent heat source [77]
- Slide rack capable of holding 400-500 mL of buffer [77]
- Antigen retrieval buffer (e.g., Sodium Citrate pH 6.0 or Tris-EDTA pH 9.0) [77]
- Forceps for slide handling
Procedure:
- Add the appropriate antigen retrieval buffer to the pressure cooker, ensuring sufficient volume to completely cover slides [77].
- Place the pressure cooker on the hot plate and begin heating at full power without securing the lid [77].
- While waiting for the buffer to boil, complete deparaffinization and rehydration of tissue sections through xylene and graded alcohol series [77].
- Once boiling is achieved, carefully transfer slides from rinse water to the pressure cooker using forceps [77].
- Secure the pressure cooker lid according to the manufacturer's instructions and allow full pressure to develop (typically reaching 5-7 psi) [71].
- Once full pressure is reached, immediately begin timing for a 3-minute retrieval period [77].
- After 3 minutes, turn off the heat source and transfer the pressure cooker to an empty sink.
- Activate the pressure release valve and run cold water over the cooker to depressurize and cool [77].
- Once depressurized, open the lid and continue running cold water into the cooker for 10 minutes to cool slides sufficiently for handling [77].
- Continue with standard immunohistochemical staining protocols.
Water Bath HIER Protocol
For more delicate tissues or when using automated staining systems, water bath HIER provides a gentler alternative with more precise temperature control:
Materials Required:
- Temperature-controlled water bath (capable of maintaining 92-95°C) [75]
- Polypropylene Coplin staining jars or equivalent slide containers [75]
- Antigen retrieval buffer
- Forceps for slide handling
Procedure:
- Prepare working dilution of antigen retrieval buffer by mixing 1 part 10X concentrate with 9 parts deionized water [75].
- Preheat the retrieval solution to 92-95°C by placing a polypropylene Coplin jar filled with buffer into the water bath [75]. Note that glass staining dishes may crack under these conditions.
- Immerse slides into the preheated retrieval solution for 2-10 minutes, with optimal time determined empirically for each antibody [75].
- After incubation, remove the Coplin jar from the water bath and allow it to cool naturally to room temperature [75].
- Gently rinse slides with deionized water followed by PBS, taking care to avoid vigorous rinsing as tissues may be loosened after retrieval [75].
- Proceed with blocking and primary antibody incubation steps.
The Scientist's Toolkit: Essential HIER Reagents and Equipment
Successful implementation and optimization of HIER require specific laboratory reagents and equipment. Table 3 catalogues the essential components of a complete HIER workflow, along with their specific functions and selection considerations.
Table 3: Essential Research Reagents and Equipment for HIER Optimization
| Item Category | Specific Examples | Function in HIER Protocol | Selection Considerations |
|---|---|---|---|
| Retrieval Buffers | Sodium Citrate (pH 6.0), Tris-EDTA (pH 9.0), EDTA (pH 8.0) [77] | Creates chemical environment for crosslink reversal; pH critical for epitope unmasking | Keep multiple buffers available; high-pH buffers retrieve widest range of antigens [74] |
| Heating Equipment | Pressure cooker, water bath, scientific microwave, vegetable steamer [77] | Provides controlled heating to disrupt protein crosslinks | Pressure cookers achieve highest temperatures; water baths offer gentle, uniform heating [71] [75] |
| Slide Handling Tools | Metal or plastic slide racks, forceps, Coplin jars [77] | Secure slide placement during retrieval and staining | Metal racks withstand high heat; plastic prevents slide damage [77] |
| Detection Reagents | Primary antibodies, HRP detection systems, DAB chromogen [71] [78] | Visualizes successful antigen retrieval and antibody binding | Use validated antibody-detection system combinations for reliable results |
| Control Materials | Known positive tissue, negative control slides [73] [74] | Validates retrieval efficiency and antibody specificity | Essential for distinguishing retrieval failure from antibody issues |
Within comprehensive antibody validation protocols for immunohistochemistry research, systematic optimization of Heat-Induced Epitope Retrieval represents a non-negotiable prerequisite for generating reproducible, reliable data. The experimental evidence clearly demonstrates that no single HIER method or buffer condition universally suits all antigens and tissue types. The comparative data showing substantial performance differences between online and offline HIER methods underscores the importance of method selection in achieving optimal staining intensity [71]. Similarly, the profound influence of buffer pH on staining outcomes, as demonstrated in the p27 detection example, highlights the critical nature of chemical optimization [76].
A rigorous validation framework must incorporate a systematic matrix approach to HIER optimization, testing multiple buffer pH conditions across various heating durations and methods. This process should be guided by the experimental workflow presented in this review, with careful attention to appropriate controls and documentation. As IHC continues to evolve as a quantitative tool in both research and diagnostic settings, particularly with the growing importance of tissue proteomics and biomarker development [72], standardized and optimized HIER protocols will remain fundamental to ensuring antibody specificity, staining reproducibility, and ultimately, the scientific validity of immunohistochemical findings.
In immunohistochemistry (IHC) research, background staining remains a significant challenge that can compromise data interpretation and experimental reproducibility. Effective blocking and optimized antibody dilution are two critical procedural steps that work in tandem to reduce non-specific antibody binding and enhance signal-to-noise ratios. Background staining often arises from non-specific interactions between antibodies and tissue components, which can be mitigated through strategic application of blocking agents and precise optimization of antibody concentrations [79]. Within the broader context of antibody validation protocols, establishing robust methods for reducing background is not merely a technical exercise but a fundamental requirement for ensuring that staining patterns accurately represent true antigen-antibody interactions [80]. This guide objectively compares various blocking strategies and antibody dilution approaches, providing experimental data to help researchers select the most appropriate methods for their specific applications.
Comparative Analysis of Blocking and Dilution Strategies
The selection of appropriate blocking reagents and antibody dilution buffers significantly influences IHC outcomes. Different approaches offer distinct advantages and limitations in reducing background staining, as detailed in the comparative tables below.
Table 1: Comparison of Common Blocking Reagents for IHC
| Blocking Reagent | Mechanism of Action | Best For | Limitations | Impact on Background Reduction |
|---|---|---|---|---|
| Normal Serum | Occupies non-specific binding sites through species-matched proteins | General IHC; fluorescent detection | Potential interference if incompatible with detection system | Moderate to High (when properly matched) |
| BSA (Bovine Serum Albumin) | Blocks hydrophobic and charged sites; inert protein | Chromogenic and fluorescent IHC; preserving antigenicity | May not block all non-specific interactions effectively | Moderate |
| Non-Fat Dry Milk | Blocks through casein proteins; cost-effective | Western blotting; budget-conscious projects | May contain endogenous immunoglobulins; not ideal for all applications | Variable (application-dependent) |
| Commercial Blocking Buffers | Proprietary formulations with optimized components | Challenging antigens; multiplex IHC | Higher cost; variable composition | Consistently High (optimized specifically for IHC) |
Table 2: Performance Comparison of Antibody Diluent Formulations
| Diluent Type | Key Components | Optimal pH Range | Antibody Titer Improvement | Specificity Enhancement | Recommended Use Cases |
|---|---|---|---|---|---|
| PBS-Based | Phosphate buffer, saline | 7.0-7.4 | Baseline (reference) | Moderate | Routine IHC; standard antigens |
| Tris-Based | Tris buffer, additives | 7.0-8.0 | 1-2 fold | Moderate to High | Alkaline-sensitive antibodies |
| Commercial Specialty Formulations | Proprietary buffers, stabilizers | 7.0-7.4 | 2-4 fold | High | Sensitive detection; precious antibodies [81] |
Table 3: Quantitative Assessment of Background Staining Reduction Methods
| Method | Signal-to-Noise Ratio Improvement | Implementation Complexity | Cost Impact | Validation Requirements |
|---|---|---|---|---|
| Protein Blocking (BSA/Serum) | 2-3 fold | Low | Low | Minimal; standard practice |
| Peptide Blocking | 4-5 fold (for specific epitopes) | Medium | Medium to High | Essential for specificity confirmation [82] |
| Optimized Antibody Dilution | 3-4 fold | Medium | Low (saves antibody) | Required for each new antibody lot [81] |
| Combined Approach (Blocking + Optimized Dilution) | 5-8 fold | High | Variable | Comprehensive validation recommended [79] |
Experimental Protocols for Background Reduction
Immunizing Peptide Blocking Assay
Blocking with immunizing peptides serves as both a validation tool and background reduction method. This protocol confirms antibody specificity while eliminating non-specific staining [82].
Materials and Reagents:
- Blocking buffer (TBST plus either 5% non-fat dry milk or 3% BSA for western blot, or PBS plus 1% BSA for IHC)
- Antibody blocking (immunizing) peptide
- Primary antibody
- Two identical tissue sections or western blot membranes
Methodology:
- Determine the optimal concentration of antibody that consistently gives a positive result in your particular protocol.
- Dilute the necessary amount of antibody in blocking buffer to the final volume needed for two experiments.
- Divide this solution equally into two tubes.
- In the first tube, labeled "blocked", add five times excess blocking peptide to antibody by weight (5 µg total peptide per 1 µg antibody).
- In the second tube, labeled "control", add an equivalent amount of buffer without peptide.
- Incubate both tubes, with agitation, at room temperature for 30 minutes, or overnight at 4°C.
- Perform the staining protocol on two identical samples, using the blocked antibody for one and the control antibody for the other.
- Compare staining patterns. The staining that disappears when using the blocked antibody is specific to the antibody [82].
Interpretation: Effective blocking demonstrates specificity when the signal is abolished in the peptide-blocked sample but maintained in the control. If both samples show similar staining, the antibody may be binding non-specifically.
Antibody Dilution Optimization Protocol
Optimizing antibody dilution is crucial for balancing signal intensity with background reduction. The relationship between antibody concentration and background follows a predictable pattern where excessive antibody leads to increased non-specific binding [81].
Materials and Reagents:
- Primary antibody
- Selected diluent buffer (PBS-based, Tris-based, or commercial formulation)
- Tissue sections with known antigen expression patterns
Methodology:
- Prepare a series of antibody dilutions covering a broad range (e.g., 1:100, 1:500, 1:1000, 1:2000, 1:5000).
- Use a diluent with a relatively neutral pH (7.0-7.4) as a starting point, as antibody-antigen binding is pH-dependent and highly controlled by ionic interactions [81].
- Apply each dilution to matched tissue sections under identical staining conditions.
- Include appropriate positive and negative controls in each run.
- Evaluate staining intensity and background using standardized scoring systems.
- Select the dilution that provides optimal specific staining with minimal background.
Technical Considerations:
- The isoelectric point (pI) for immunoglobulins ranges from 5.8 to 8.5; avoid diluent pH too close to the antibody's pI to prevent reduced solubility [81].
- If low signal or high background is observed, adjust the pH by 0.5 units incrementally.
- Avoid diluents that contain serum unless necessary, as serum can bind to the primary antibody causing decreased sensitivity [81].
- Allow diluent/working antibody solution to reach room temperature before using, as temperature changes may affect pH-sensitive buffers [81].
Antibody Validation Framework
The International Working Group for Antibody Validation (IWGAV) emphasizes that antibodies for IHC must be specifically validated on formalin-fixed tissues, as traditional methods like Western blot are insufficient due to fixation-induced epitope alterations [80]. Within this framework, reducing background staining is integral to validation, as non-specific binding can lead to false interpretations.
Key Validation Strategies Relevant to Background Assessment:
Independent Antibody Strategy: Comparing two or more antibodies against distinct, non-overlapping epitopes on the same target provides confidence in specificity when staining patterns are concordant [83]. Discrepancies may indicate non-specific binding requiring additional optimization of blocking or dilution conditions.
Orthogonal Strategy: Comparing IHC results with non-antibody-based methods (e.g., RNA-seq data) across multiple tissue types confirms that staining patterns reflect true biological expression rather than background artifacts [80] [84].
Genetic Validation: Using siRNA or CRISPR-Cas9 to downregulate target protein expression should correspondingly reduce or eliminate antibody signal, confirming specificity and demonstrating that observed staining is not background [84].
Diagram: Antibody Validation and Background Assessment Workflow
The Scientist's Toolkit: Essential Research Reagents
Table 4: Key Reagents for Effective Blocking and Antibody Dilution
| Reagent Category | Specific Examples | Function in Background Reduction | Application Notes |
|---|---|---|---|
| Blocking Proteins | BSA, Normal serum, Non-fat dry milk | Occupies non-specific binding sites | Serum should be from same species as secondary antibody |
| Commercial Blocking Buffers | Biocare Medical background suppressor | Proprietary formulations for enhanced blocking | Often provide more consistent results than homemade buffers |
| Antibody Diluents | PBS-based, Tris-based, Commercial formulations | Maintains antibody stability and specificity | pH and ionic strength critically affect performance [81] |
| Blocking Peptides | Immunizing peptide antigens | Competitively inhibits specific binding | Essential for confirming antibody specificity [82] |
| Wash Buffers | TBST, PBST | Removes unbound antibodies | Increased stringency reduces background |
| Detection System Components | Enzyme substrates, Fluorophore-conjugated secondaries | Generates detectable signal | Higher quality reagents reduce non-specific precipitation |
Effective reduction of background staining in IHC requires a systematic approach combining appropriate blocking strategies with optimized antibody dilution protocols. The experimental data presented demonstrates that commercial specialty diluents can improve antibody titers 2-4 fold compared to standard PBS-based diluents, while peptide blocking approaches can enhance signal-to-noise ratios by 4-5 fold. These methods are most effective when implemented within a comprehensive antibody validation framework that includes independent antibody verification and orthogonal validation strategies.
Researchers should prioritize antibody validation using IWGAV guidelines, as formalin fixation significantly alters protein structure and epitope accessibility, making traditional validation methods insufficient [80]. The ongoing shift toward recombinant antibodies in the research community reflects increasing demand for consistent performance and minimized lot-to-lot variability [85], which directly impacts the reproducibility of background reduction strategies.
By implementing the compared methods and validation protocols detailed in this guide, researchers can significantly improve the quality and reliability of their IHC data, advancing both basic research and drug development efforts.
In immunohistochemistry (IHC) research, the reliability of experimental outcomes fundamentally depends on the meticulous optimization of key protocol variables. Incubation time, temperature, and detection system selection directly influence signal intensity, background noise, and ultimately, the validity of scientific conclusions. Within the broader context of antibody validation protocols, understanding how these variables interact provides researchers with a framework for producing reproducible, high-quality data essential for drug development and diagnostic applications. The strategic management of these parameters enables scientists to maximize target detection while maintaining tissue morphology and architectural context, which represents a cornerstone of effective IHC experimental design [86].
This guide objectively compares the performance of different approaches to these critical variables, presenting experimental data to inform evidence-based protocol selection. By examining comparative studies and their methodologies, researchers can make informed decisions that enhance the rigor of their IHC validation workflows, ultimately contributing to more reliable research outcomes in biomedical science.
Experimental Comparison of Detection Systems
IHC detection systems form the critical link between antibody binding and visualizable signal, with significant implications for sensitivity, specificity, and experimental workflow. The selection between chromogenic and fluorescent detection, as well as the choice between polymer-based and biotin-based systems, represents one of the most consequential decisions in IHC protocol design.
Direct vs. Indirect Detection Methods
Immunostaining can be performed using either direct or indirect detection methods, each with distinct advantages for specific applications. Direct detection conjugates the primary antibody directly with a fluorophore, simplifying the staining procedure and reducing potential background through fewer processing steps. This method is particularly valuable for multiplexing applications where multiple targets must be visualized simultaneously without antibody cross-reactivity [86].
In contrast, indirect labeling employs a secondary antibody that recognizes the primary antibody, often coupled with enzyme complexes or multiple fluorophores. This approach provides significant signal amplification, making it particularly valuable for detecting low-abundance targets where sensitivity is paramount. The preferred methodology for many IHC applications involves highly sensitive, one-step, polymer-based detection reagents specific for rabbit or mouse IgG, which offer enhanced sensitivity without the complications associated with biotin-based systems [86].
Polymer-Based vs. Biotin-Based Systems: Experimental Comparison
Polymer-based detection systems have demonstrated superior performance characteristics compared to traditional biotin-based methods across multiple experimental parameters. The following table summarizes quantitative comparisons between these systems based on experimental data:
Table 1: Performance Comparison of Detection Systems
| Detection System | Sensitivity Level | Signal-to-Noise Ratio | Experimental Applications | Key Advantages |
|---|---|---|---|---|
| Polymer-based | High | Superior | Ideal for low-abundance targets; Phospho-Stat3 detection | Enhanced sensitivity; avoids endogenous biotin interference |
| Biotin-based | Moderate | Variable | General applications where target expression is robust | Established methodology; cost-effective for some labs |
| Direct Fluorescent | Variable | High | Multiplexing applications; direct visualization | Simplified protocol; reduced potential for background |
Experimental evidence clearly demonstrates the sensitivity advantage of polymer-based systems. In one comparative study using Sox2 (D6D9) XP Rabbit mAb #3579 on paraffin-embedded human lung carcinoma, polymer-based detection (SignalStain Boost IHC Detection Reagent #8114) produced markedly more robust staining compared to biotin-based detection methods [86]. The signal intensity and target localization were significantly enhanced with the polymer system, enabling clearer interpretation of staining patterns, particularly for targets with heterogeneous expression.
Similarly, the quality of chromogenic substrates substantially impacts experimental outcomes. When detecting Phospho-Stat3 (Tyr705) on human breast carcinoma specimens, SignalStain DAB Substrate Kit #8059 generated superior signal intensity compared to competitor DAB formulations, with one competitor product producing a dramatically weaker signal that could lead to false-negative interpretations in validation protocols [86].
Comparative Analysis of Incubation Time and Temperature
The optimization of incubation parameters represents a critical factor in IHC protocol validation, directly influencing antibody binding efficiency, signal intensity, and the specificity of target detection. Both theoretical principles and experimental evidence inform optimal practices for these variables.
Fundamental Principles of Incubation Optimization
Incubation conditions must strike a delicate balance between sufficient antibody-antigen interaction and the preservation of tissue integrity. Longer incubation times typically enhance antibody binding, particularly for low-affinity antibodies or low-abundance targets, but simultaneously increase the risk of non-specific binding and tissue degradation. Similarly, temperature elevation generally accelerates antibody binding kinetics but may promote off-target interactions or epitope damage in sensitive samples [86].
The interaction between time and temperature follows predictable kinetic principles, with higher temperatures often enabling shorter incubation periods. However, this relationship is not universally linear, as excessively elevated temperatures can denature either the antibody or the target epitope, particularly for phospho-specific antibodies or labile protein modifications. Consequently, empirical testing remains essential for establishing optimal conditions for each antibody-epitope pair within a validation framework [86].
Experimental Evidence from Microbiological Studies
While direct IHC-specific incubation comparisons are limited in the available literature, insightful parallel evidence emerges from environmental monitoring studies in pharmaceutical manufacturing, where similar principles of biological detection apply. These studies employ rigorous methodological approaches to optimize microorganism recovery through incubation parameter manipulation, providing a valuable template for IHC protocol development.
Table 2: Incubation Conditions for Optimal Microbial Recovery
| Incubation Temperature | Optimal Duration | Target Microorganisms | Recovery Efficiency | Key Findings |
|---|---|---|---|---|
| 30-35°C | 2 days | Total aerobic bacteria | Highest recovery | Optimal for human-associated mesophiles |
| 20-25°C | 4 days | Moulds | Highest recovery | Lower temperatures essential for fungal detection |
| Dual incubation (20-25°C to 30-35°C) | 4 days + 2 days | Comprehensive spectrum | Reasonable for both | Practical compromise with some sensitivity trade-offs |
One comprehensive study designed to determine whether a dual-incubation regime could be shortened without significantly altering microorganism recovery employed both in vivo (laboratory) and in situ (environmental) experiments. The research compared a preexisting dual-incubation regime (20-25°C for five days followed by 30-35°C for two days) against a modified test regime (20-25°C for four days followed by 30-35°C for two days) across multiple cleanroom environments [87].
The experimental methodology involved typed cultures including Staphylococcus aureus, Bacillus subtilis, Micrococcus luteus, Pseudomonas aeruginosa, Aspergillus brasiliensis, and Candida albicans for in vitro testing, with each culture prepared using aliquots dispensed onto 25-cm² TSA plates with target inocula of 10-100 CFU. Environmental sampling employed contact plates from various cleanroom surfaces, with samples collected in triplicate to account for all incubation regimes compared [87].
Statistical analysis using Student's t-test (0.05 significance level, 95% confidence level) revealed that for most microorganisms, no significant differences emerged between daily colony counts after specific time thresholds. Specifically, most colonies were recovered by day two of incubation at 30-35°C and by day four at 20-25°C, informing the proposed shortened incubation regime without substantial compromise to recovery efficiency [87].
These findings demonstrate that strategic reduction of incubation times is feasible with proper empirical validation, potentially accelerating IHC workflow without sacrificing detection capability. The methodological approach exemplified in this study provides a template for similar systematic optimization of IHC incubation parameters.
The Scientist's Toolkit: Essential Research Reagent Solutions
Successful IHC experimentation requires access to specialized reagents and systems optimized for particular applications within the validation workflow. The following table details essential solutions referenced in the experimental data, with their specific functions in IHC protocols:
Table 3: Essential Research Reagents for IHC Validation
| Reagent/System | Primary Function | Application Context | Performance Characteristics |
|---|---|---|---|
| SignalStain Boost IHC Detection Reagents | Polymer-based detection | Enhanced sensitivity for low-abundance targets | Superior to biotin-based systems; minimal background |
| SignalStain DAB Substrate Kit #8059 | Chromogenic development | High-contrast visualisation of target localization | Consistent, precipitable signal; superior to competitor formulations |
| Hematoxylin #14166 | Nuclear counterstain | Tissue morphology context | Blue nuclear staining; compatible with DAB chromogen |
| Tryptone Soya Agar (TSA) | General recovery medium | Microbiological environmental monitoring | Supports growth of diverse microorganisms; neutralises disinfectants |
| Phospho-specific Antibodies | Detection of phosphorylation | Signaling pathway activation | Requires gentle fixation; often benefits from polymer detection |
These reagent solutions represent foundational components for implementing the optimized protocols discussed throughout this guide. Their performance characteristics directly influence the quality and reproducibility of IHC validation data, making informed selection critical for rigorous scientific practice.
Experimental Workflow for IHC Protocol Optimization
The following diagram illustrates the comprehensive workflow for IHC staining, integrating the critical variables of incubation time, temperature, and detection systems:
Decision Framework for Detection System Selection
The strategic selection of appropriate detection systems depends on multiple experimental factors, including target abundance, antibody characteristics, and research objectives. The following diagram provides a logical framework for this decision process:
The strategic management of incubation time, temperature, and detection systems represents a fundamental aspect of rigorous IHC antibody validation. Experimental evidence demonstrates that polymer-based detection systems consistently outperform biotin-based alternatives in sensitivity and signal-to-noise ratio, while studies of incubation parameters reveal that optimal conditions must balance detection efficiency with practical workflow considerations. By applying the comparative data and methodological frameworks presented in this guide, researchers can make evidence-based decisions that enhance the reproducibility, specificity, and analytical sensitivity of their IHC experiments, ultimately strengthening the scientific validity of their research conclusions in drug development and diagnostic applications.
Immunohistochemistry (IHC) stands as a cornerstone technique in diagnostic pathology and biomedical research, enabling the visualization of target molecule expressions within their native tissue microenvironment. However, the reliability of IHC results is potentially compromised by numerous artifacts and non-specific staining that can lead to erroneous interpretation. These pitfalls, arising from pre-analytical, analytical, and post-analytical variables, represent a critical challenge for researchers, scientists, and drug development professionals who depend on accurate data for biomarker exploration and therapeutic development. Within the broader context of antibody validation protocols, recognizing and mitigating these artifacts is not merely a technical consideration but a fundamental component of rigorous scientific practice. This guide objectively compares the impact of various artifacts and provides structured experimental approaches for their identification and prevention, ensuring that IHC findings remain a trustworthy source of biological insight.
The Critical Impact of Artifacts on IHC Interpretation
Artifacts in IHC are artificial structures or tissue alterations caused by extraneous factors rather than true biological signals. Their presence can severely compromise the accuracy of morphologic diagnosis and the validity of research data. In diagnostic settings, these artifacts may lead to complete uselessness of tissue samples or, worse, to misdiagnosis and inappropriate patient management. For instance, the misidentification of an artifact as a specific immunostain could falsely indicate the presence of a biomarker, potentially altering cancer subtyping or therapy selection [88]. Similarly, in drug development, non-specific staining can obscure true negative results or generate false positives, jeopardizing the accurate assessment of a drug's effect on target expression. The first step toward mitigation is recognizing that artifacts can originate at virtually every stage of the IHC process, from tissue collection to final mounting, and that systematic validation is the only safeguard against their deceptive influence.
Classification and Identification of Common IHC Artifacts
Pre-Analytical Artifacts
Pre-analytical variables, occurring before the staining procedure begins, are among the most common sources of artifacts. Proper control of these factors is fundamental to antibody validation.
- Squeeze and Crush Artifacts: Caused by compression of tissue with forceps or other surgical instruments during specimen retrieval. This results in darkly stained, distorted nuclei where cellular details are unrecognizable [88].
- Thermal Artifacts: Fulguration artifacts from electrosurgical or laser cutting produce a zone of thermal necrosis and tissue distortion, making epithelium and connective tissue appear amorphous with spindled, palisading nuclei [88].
- Fixation-Related Artifacts:
- Inadequate Fixation: Delays in fixation or the use of non-fixative solutions like normal saline lead to autolysis. Microscopically, this appears as increased eosinophilia, cytoplasmic vacuolization, and nuclear changes like pyknosis and karyorrhexis [88]. It can also cause separation of epithelium from connective tissue, mimicking vesiculobullous diseases [88].
- Overfixation: Prolonged fixation, particularly in formalin, can cause excessive cross-linking that masks epitopes, reducing antigen detection and intensity [65] [89].
- Formalin Pigment: Oxidation of formaldehyde produces formic acid, which binds with heme to form brown-black, crystalline deposits that can be mistaken for parasitic pigments [88].
- Ischemia Time: Variation in the time between surgical resection and fixation results in degradation of proteins, RNA, and DNA. Antigens like Ki-67 and phosphoproteins are particularly vulnerable to ischemic effects, which can alter the results of critical biomarkers [65].
Analytical and Staining Artifacts
Analytical artifacts arise during the IHC staining procedure itself and are often related to reagent interactions and protocol failures.
- Non-Specific Binding: This is a primary cause of high background staining and occurs due to:
- Hydrophobic/Ionic Interactions: Antibodies can stick to tissue via electrostatic forces or interactions with cell membranes, independent of the specific epitope [90] [91].
- Fc Receptor Binding: Endogenous Fc receptors, prevalent in lymphoid tissues, bone marrow, and frozen sections, can bind the Fc portion of antibodies, causing false-positive staining [65] [92].
- Endogenous Enzyme Activity:
- Endogenous Peroxidase: Present in erythrocytes, granulocytes, and tissues like liver and kidney, can catalyze the chromogen (e.g., DAB) in detection systems, creating false-positive signals [90].
- Endogenous Alkaline Phosphatase (AP): Found in intestine, kidney, and lymphoid tissues, can similarly interfere with AP-based detection systems [90].
- Endogenous Biotin: Tissues such as liver, kidney, and heart contain high levels of endogenous biotin. When using avidin-biotin complex (ABC) detection systems, this can lead to intense, widespread non-specific staining [93] [90].
- Desquamartifact: A common pitfall caused by individual anucleate squamous cells from the skin that desquamate and settle onto the adhesive slides during processing. These cells stain positively with many antibodies, creating small, isolated positive signals that can be mistaken for small tumor foci or specific cell types [93].
Post-Analytical and Interpretation Artifacts
These pitfalls occur during the final assessment of the stained slides.
- Misinterpretation of "Optically Clear" Nuclei: After certain antigen retrieval methods, nuclei can appear optically clear and may non-specifically bind immunoglobulins, potentially leading to a misdiagnosis of viral infection [93].
- Edge Artifact: Often seen at the periphery of tissue sections, where staining intensity is artificially enhanced due to better antibody penetration at the edges.
- Quantification Errors: Over-staining or weak staining can obscure cellular details or fail to highlight true positives, leading to inaccurate scoring of biomarker expression, which is critical for biomarkers like PD-L1 and HER2 [91].
The table below summarizes these common artifacts and their primary causes for quick reference.
Table 1: Common IHC Artifacts and Their Causes
| Artifact Type | Specific Example | Primary Cause |
|---|---|---|
| Pre-Analytical | Crush Artifact | Mechanical compression during tissue retrieval [88] |
| Autolysis | Delay in tissue fixation [88] | |
| Formalin Pigment | Oxidation of formaldehyde in unbuffered formalin [88] | |
| Analytical | Non-Specific Binding | Hydrophobic/ionic interactions or Fc receptor binding [65] [90] |
| Endogenous Peroxidase | Presence of endogenous enzymes in red blood cells/tissues [90] | |
| Endogenous Biotin | Binding of streptavidin to naturally occurring biotin [93] [90] | |
| Post-Analytical | Desquamartifact | Contamination by anucleate squamous cells during processing [93] |
Experimental Protocols for Validation and Troubleshooting
Robust antibody validation and troubleshooting protocols are essential to distinguish true specific staining from artifacts. The following experimental methodologies are critical for confirming antibody specificity and ensuring reproducible results.
Core Antibody Validation Protocols
- Western Blot Analysis: Used to demonstrate that the antibody binds to a single band of the appropriate molecular weight. This confirms specificity and reveals potential cross-reacting bands [94].
- Blocking Peptide Assay: The gold standard for specificity. Pre-adsorption of the primary antibody with an excess of the immunizing peptide should abolish or drastically reduce staining. The absence of this effect indicates non-specific binding [94].
- Cell Line Validation:
- Use of paraffin-embedded cell pellets from transfected cells expressing the target protein (positive control) and non-transfected or knockout cells (negative control) [94].
- Methodology: Culture positive and negative control cell lines. Create a cell pellet by centrifugation, fix in formalin, and process into a paraffin block. Section and stain alongside test tissues. Specific staining is confirmed by positivity in the expressing cell line and absence of signal in the negative control [94].
- Tissue Microarrays (TMAs) and Xenografts: Staining across a broad spectrum of tissues in a TMA or in xenografts generated from cells with known expression levels helps verify expected staining patterns and specificity in a complex tissue context [94].
- Comparison with an Orthogonal Method: Comparing IHC results with a different methodological approach, such as fluorescent in situ hybridization (FISH) for HER2 or flow cytometry for cell surface markers, provides independent confirmation of specificity [3].
Troubleshooting Protocols for Common Artifacts
- Protocol for Eliminating Non-Specific Binding:
- Protein Blocking: Incubate sections with 5-10% normal serum from the species of the secondary antibody or with protein buffers (BSA, gelatin) for 30 minutes to overnight. This blocks charge- and hydrophobic interaction-based binding sites [65] [90].
- Fc Receptor Blocking: For tissues rich in Fc receptors (e.g., lymphoid tissue, frozen sections), use specific Fc-blocking antibodies (e.g., anti-CD16/32 for mouse tissues) or incubate with unconjugated antibody from the same species and isotype to saturate Fc receptors [65] [92].
- Protocol for Quenching Endogenous Enzymes:
- Protocol for Blocking Endogenous Biotin:
- Sequentially incubate sections with an avidin solution followed by a biotin solution to saturate endogenous biotin binding sites before applying the biotinylated secondary antibody. This avidin/biotin blocking step is crucial when using ABC methods [90].
The following workflow diagram outlines a logical, step-by-step approach for diagnosing and resolving common IHC staining problems.
Research Reagent Solutions for Artifact Prevention
A well-equipped IHC laboratory must have a suite of reagents specifically dedicated to preventing and mitigating artifacts. The selection of these reagents is a critical component of the analytical phase.
Table 2: Essential Research Reagents for Preventing IHC Artifacts
| Reagent Category | Specific Examples | Function & Rationale |
|---|---|---|
| Blocking Reagents | Normal Serum (e.g., from secondary host), BSA, Non-fat Dry Milk | Reduces non-specific hydrophobic/ionic binding by occupying reactive sites on tissue [65] [90]. |
| Fc Receptor Blockers | Species-specific Fc Block (e.g., anti-CD16/32 for mouse), Unconjugated Isotype Control | Saturates Fc receptors to prevent false-positive binding of antibody Fc portions [65] [92]. |
| Endogenous Enzyme Blockers | 3% Hydrogen Peroxide (H₂O₂), 1 mM Levamisole | Quenches endogenous peroxidase and alkaline phosphatase activity to prevent false chromogen deposition [90]. |
| Biotin Blockers | Avidin, followed by Biotin | Blocks endogenous biotin in tissues when using avidin-biotin detection systems [90]. |
| Detection System Alternatives | Polymer-based systems (e.g., HRP- or AP-labeled polymer) | Eliminates the need for biotin-streptavidin reactions, avoiding endogenous biotin issues entirely [93]. |
| Validated Controls | Cell Pellets (transfected/knockout), Multi-Tissue Control Blocks (MTCB) | Provides consistent positive and negative controls for every run, essential for monitoring staining performance and specificity [94] [93]. |
Standardization and Quality Control in IHC
Adherence to standardized guidelines is paramount for reducing inter-laboratory variation and ensuring the reliability of IHC data, particularly in a research and drug development context. The College of American Pathologists (CAP) has established evidence-based principles for the analytic validation of IHC assays [3]. Key recommendations include:
- Validation of Each Assay-Scoring System: Laboratories should separately validate each IHC assay for every specific scoring system and tumor type (e.g., HER2 has different scoring systems for breast and gastric cancer) [3].
- Robust Validation Design: Using appropriate comparators such as cell line pellets with known protein expression, orthogonal methods (e.g., flow cytometry), or expected architectural staining patterns to confirm specificity [3].
- Cytology Specimen Validation: IHC performed on cytology specimens fixed differently from standard FFPE tissues requires separate validation with a minimum of 10 positive and 10 negative cases [3].
- Use of Multi-Tissue Control Blocks (MTCB): Incorporating MTCBs into daily runs is a powerful quality control tool, allowing for continuous monitoring of stain sensitivity and specificity across a variety of tissues [93].
The path to reliable immunohistochemistry is paved with a vigilant awareness of its many potential pitfalls. Artifacts and non-specific staining pose a constant threat to the integrity of IHC data, with ramifications that extend from flawed research conclusions to incorrect clinical diagnoses. However, by systematically understanding the sources of these artifacts—spanning pre-analytical, analytical, and post-analytical phases—and by implementing rigorous, multi-faceted antibody validation and troubleshooting protocols, researchers and scientists can confidently navigate these challenges. The consistent application of standardized guidelines, comprehensive controls, and targeted blocking strategies transforms IHC from a potentially error-prone technique into a powerful, reproducible tool. Ultimately, within the critical framework of antibody validation, recognizing and preventing artifacts is not just a technical skill but a fundamental prerequisite for generating the accurate, trustworthy data that drives scientific progress and drug development forward.
Ensuring Excellence: Adherence to Standards and Comparative Assay Analysis
In the field of immunohistochemistry (IHC) research, the analytical validation of antibody-based assays is a critical prerequisite for ensuring reliable and reproducible results. Validation protocols provide a framework for demonstrating that an assay consistently performs as intended, with benchmarking thresholds offering clear targets for performance acceptability. Among these, the 90% concordance rule has emerged as a key statistical requirement for validating predictive IHC assays, harmonizing standards across various markers to ensure accuracy and reduce laboratory variation.
The 90% Concordance Rule in IHC Validation
Concordance, in the context of IHC assay validation, refers to the percentage agreement between the results obtained from a new test and those from a validated comparator method. Recent guidelines have established a standardized performance benchmark for this metric.
Table 1: Key Recommendations from the 2024 CAP IHC Analytic Validation Guideline Update
| Guideline Aspect | Original Recommendation | 2024 Updated Recommendation |
|---|---|---|
| Predictive Markers Concordance | Variable concordance requirements for ER, PR, and HER2 IHC. | Harmonized requirement for 90% concordance for all IHC assays [3]. |
| Scope of Application | Specific requirements for a limited set of predictive markers. | Harmonized validation requirements now apply to all predictive markers, including newer ones with distinct scoring systems like PD-L1 [3]. |
| Cytology Specimens | Limited specific guidance. | Separate validation required for cytology specimens using alternative fixatives, with a minimum of 10 positive and 10 negative cases [3]. |
This harmonization to a 90% threshold simplifies validation protocols and ensures a consistent standard of accuracy across different laboratory settings and antibody targets [3].
Experimental Protocols for Establishing Concordance
Establishing concordance requires a structured experimental design where results from the test assay are compared against a reliable comparator. The following workflow outlines the core process, and subsequent sections detail the key components.
Validation Study Design and Case Selection
The foundation of a robust concordance study lies in careful planning and case selection.
Case Selection and Minimum Numbers: The validation set must include a sufficient number of cases to reliably estimate performance. The updated CAP guidelines stipulate a minimum of 10 positive and 10 negative cases for validating assays on cytology specimens fixed in alternative fixatives, a principle that can be extended to general validation studies to ensure adequate representation of both positive and negative results [3]. Cases should be selected to cover the entire range of expected staining intensities (e.g., weak, moderate, strong) and distribution patterns relevant to the antibody target.
Choice of Comparator: The selection of an appropriate comparator is critical. The CAP guideline lists several options, ordered here from most to least stringent [3]:
- Comparison to IHC results from cell lines with known amounts of protein ("calibrators").
- Comparison with a non-immunohistochemical method (e.g., flow cytometry, FISH).
- Comparison with results from testing the same tissues in another laboratory using a validated assay.
- Comparison with prior testing of the same tissues with a validated assay in the same laboratory.
Data Analysis and Concordance Calculation
Once data from both the test and comparator assays are collected, statistical analysis determines the level of agreement.
- Calculating Percent Concordance: The overall percent agreement is calculated as the number of cases where the test and comparator results agree, divided by the total number of cases, multiplied by 100. For predictive markers, this calculation must demonstrate at least 90% agreement [3].
- Statistical Measures of Agreement: While percent concordance is a primary metric, additional statistical measures provide a more nuanced view of assay performance.
- Sensitivity and Specificity: These measure the assay's ability to correctly identify positive cases (sensitivity) and negative cases (specificity) compared to the comparator.
- Cohen's Kappa (κ): This statistic measures the agreement between two raters (or methods) while accounting for the possibility of agreement occurring by chance. The Fleiss classification system interprets Kappa values as follows: κ < 0.40 (Poor to Fair), 0.40 – 0.60 (Moderate), 0.60 – 0.80 (Substantial), and 0.80 – 1.00 (Almost Perfect) [95]. A well-validated assay should typically target "Almost Perfect" agreement.
Table 2: Key Statistical Measures for IHC Assay Validation
| Statistical Measure | Calculation / Definition | Interpretation in IHC Context |
|---|---|---|
| Percent Concordance | (Number of Agreeing Cases / Total Cases) × 100 | Primary benchmark; ≥90% for predictive markers [3]. |
| Sensitivity | True Positives / (True Positives + False Negatives) | Measures ability to detect true positive cases; should be high. |
| Specificity | True Negatives / (True Negatives + False Positives) | Measures ability to detect true negative cases; should be high. |
| Cohen's Kappa (κ) | Measures inter-rater agreement beyond chance. | κ > 0.80 indicates "Almost Perfect" agreement [95]. |
The Scientist's Toolkit: Essential Research Reagent Solutions
A successful IHC validation study relies on a suite of high-quality reagents and materials. The following table details key components and their critical functions in the experimental protocol.
Table 3: Essential Reagents and Materials for IHC Validation Studies
| Item | Function in Validation |
|---|---|
| Validated Primary Antibodies | The core reagent for detecting the target antigen; specificity and lot-to-lot consistency are paramount. |
| Control Cell Lines/Tissue Microarrays (TMAs) | Provide samples with known antigen expression levels; essential for establishing staining baselines and as internal controls [3]. |
| Reference Standards | Well-characterized specimens used as a benchmark for comparing the performance of the new test assay. |
| Detection Kits (e.g., HRP-based) | Amplify the primary antibody signal for visualization; sensitivity and low background are crucial. |
| Automated Staining Platforms | Provide standardized, reproducible staining conditions, reducing technical variation and improving assay reliability. |
The establishment of a harmonized 90% concordance rule for IHC assays provides a clear and essential performance benchmark for researchers and laboratories. Adherence to structured experimental protocols—including appropriate case selection, use of validated reagents, and rigorous statistical analysis—is fundamental for demonstrating that an antibody assay meets the required standards for clinical and research applications. This rigorous approach to benchmarking ensures the accuracy, reliability, and reproducibility of IHC data, which is the cornerstone of valid research findings and successful drug development.
Analytic validation of immunohistochemistry (IHC) assays ensures that these tests accurately and reliably detect their intended targets, a fundamental requirement for predictive biomarker testing in oncology. The College of American Pathologists (CAP) has established comprehensive guidelines titled "Principles of Analytic Validation of Immunohistochemical Assays," which received a significant update in February 2024. This guideline affirms and expands upon the 2014 publication with the goal of ensuring accuracy and reducing variation in IHC laboratory practices. The updated recommendations provide harmonized validation requirements for all predictive markers, including HER2, PD-L1, and estrogen/progesterone receptors (ER/PR), setting a uniform concordance requirement of 90% for all IHC assays [3].
The evolution of clinical immunotherapy and targeted therapies has driven the need for universally accepted standardized criteria for IHC-based testing of immune checkpoint proteins and other biomarkers. This is particularly relevant for predictive markers like PD-L1, where multiple assays and scoring criteria have evolved alongside individual therapies, creating confusion among pathologists and clinicians regarding optimal approaches to biomarker testing for treatment selection [96]. Similarly, updates to ER/PR testing guidelines address the clinical challenges of low-positive cases (1-10% expression) and provide new recommendations for reporting and validation [97]. The harmonization of validation requirements across these markers represents a significant advancement in standardizing practices across laboratories and ensuring consistent, reliable patient results.
Comparative Analysis of Validation Requirements
Unified Validation Standards for Predictive Markers
The 2024 CAP guideline update establishes harmonized validation requirements for all predictive IHC markers, moving away from the previous approach of marker-specific validation protocols. This harmonization creates a consistent framework for laboratories while maintaining the technical specificities required for different biomarkers and their clinical applications [3].
Table 1: Harmonized Analytic Validation Requirements for Predictive IHC Markers
| Validation Parameter | CAP Guideline Requirement | Application Across Markers |
|---|---|---|
| Minimum Concordance | 90% for all IHC assays [3] | Applies uniformly to HER2, PD-L1, ER, PR, and other predictive markers |
| Sample Size | Minimum of 20 positive and 20 negative cases for initial validation; 10 positive and 10 negative cases for cytology specimens [3] | Consistent across marker types with additional requirements for alternative fixatives |
| Assay-Scoring System Validation | Separate validation required for each assay-scoring system combination [3] | Critical for markers like HER2 (different scoring by tumor site) and PD-L1 (different scoring by tumor type/site) |
| Cytology Specimens | Separate validation required when fixatives differ from original validation [3] | Applicable to all markers when tested on cytology specimens with alternative fixatives |
| Comparator Options | Tiered approach from most to least stringent comparator [3] | Uniform hierarchy of comparators applicable across all marker types |
Marker-Specific Technical Considerations
While validation requirements have been harmonized, technical considerations remain specific to each biomarker due to differences in scoring systems, clinical implications, and biological characteristics.
Table 2: Marker-Specific Technical Considerations and Scoring Systems
| Biomarker | Scoring System Specificity | Key Clinical Cut-offs | Special Validation Considerations |
|---|---|---|---|
| HER2 | Different scoring systems by tumor site (e.g., gastric criteria for NSCLC) [98] | IHC 3+ for protein overexpression; distinct from ERBB2 mutations [98] | HER2-low and HER2-ultralow categories require precise detection and reporting [99] |
| PD-L1 | Different scoring systems based on tumor site and/or type [3] [96] | TPS ≥1% and ≥50% for NSCLC treatment selection [96] [100] | LDTs should be validated against approved companion diagnostic assays [96] |
| ER/PR | Percentage of nuclear staining with specific reporting for low-positive cases (1-10%) [97] | ≥1% defines positivity; 1-10% reported as "ER Low Positive" with comment [97] | Internal controls must be reported for cases with 0-10% staining [97] |
Experimental Protocols for Validation Studies
Validation Study Design and Comparator Selection
The CAP guidelines provide a structured approach for designing validation studies, with particular emphasis on selecting appropriate comparators. The guideline outlines a tiered hierarchy of comparator options, ordered from most to least stringent [3]:
- Comparison to protein calibrators: Comparing the new assay's results to IHC results from cell lines that contain known amounts of protein ("calibrators")
- Non-IHC method comparison: Comparing the new assay's results with results of a non-immunohistochemical method, such as flow cytometry or fluorescent in-situ hybridization
- Inter-laboratory comparison: Comparing the new assay's results with the results of testing the same tissues in another laboratory using a validated/verified assay
- Intra-laboratory comparison: Comparing the new assay's results with the results of prior testing of the same tissues with a validated/verified assay in the same laboratory
- Clinical trial reference: Comparing the new assay's results with the results from testing the same tissues in a laboratory that performed testing for a clinical trial
- Cellular localization verification: Comparing the new assay's results with the expected architectural and subcellular localization of the antigen
- Literature comparison: Comparing the new assay's results against percent positive rates documented in published clinical trials
- Proficiency testing reference: Comparing previously graded tissue challenges from a formal proficiency testing program with the graded responses
This hierarchical approach provides laboratories with flexibility while maintaining scientific rigor, allowing them to select the most appropriate comparator based on availability and feasibility while understanding the relative stringency of each option [3].
Protocol for PD-L1 Assay Validation
For PD-L1 testing specifically, the CAP guideline emphasizes that pathologists should use a validated PD-L1 IHC expression assay and ensure appropriate validation has been performed on all specimen types and fixatives [96]. The validation protocol for a novel PD-L1 CAL10 assay demonstrates a comprehensive approach:
Feasibility Study Design:
- Objective: Determine concordance with comparator assay (SP263) at TPS cutoffs of ≥1% and ≥50% [100]
- Sample Characteristics: 136 FFPE NSCLC tissue samples including both resection and biopsy cases, with 60-70% adenocarcinomas and 30-40% squamous cell carcinomas [100]
- Staining Platforms: Test assay (CAL10) processed on BOND-III system; comparator (SP263) processed on Benchmark Ultra system [100]
- Statistical Analysis: One-sided, exact, non-inferiority test for a single proportion with 0.05 type 1 error rate; target of minimum 85% lower bound of OPA 95% CI [100]
Validation Metrics:
- Overall Percent Agreement (OPA): Primary metric for concordance assessment
- Case Selection: Inclusion of borderline cases (40-60% TPS ranges) to ensure rigorous validation [100]
- Digital Pathology Integration: Additional validation of whole slide imaging compared to manual reading [100]
Figure 1: PD-L1 Assay Validation Workflow - This diagram illustrates the key steps in a comparative validation study for a novel PD-L1 IHC assay against an established comparator, following the methodology used in the CAL10 assay feasibility study [100].
Advanced Methodologies and Emerging Approaches
Quantitative Continuous Scoring for PD-L1
Traditional visual scoring of PD-L1 expression is semi-quantitative and subjective, with measurable variation among pathologists. Quantitative Continuous Scoring (QCS) represents an emerging methodology that uses computer vision systems for granular cell-level quantification of PD-L1 staining intensity in digitized whole slide images [101].
The PD-L1 QCS methodology involves:
- Cell-level quantification: Digital analysis of PD-L1 staining intensity at individual cell level
- Intensity thresholding: Definition of positive cells based on membrane staining intensity thresholds (e.g., SI ≥40)
- Novel biomarkers: Derivation of biomarkers such as PD-L1 QCS-PMSTC (percentage of medium to strongly stained tumor cells)
- Optimized cut-points: Data-driven determination of optimal classification thresholds (e.g., >0.575% for PMSTC)
Validation in the MYSTIC trial demonstrated that PD-L1 QCS identified patient subgroups with enhanced treatment benefit from durvalumab, with similar hazard ratios (0.62 vs. 0.69) but significantly increased biomarker-positive population (54.3% vs. 29.7%) compared to visual scoring at ≥50% TPS [101].
Machine Learning Approaches for Biomarker Prediction
Advanced computational methods are being applied to optimize the use of traditional biomarkers for clinical decision-making. Machine learning models incorporating quantitative ER/PR and Ki-67 status have been developed to predict Oncotype DX recurrence scores, potentially reducing the need for expensive genomic testing [102].
Model Development Protocol:
- Training Cohort: 53,346 patients from National Cancer Database with HR+/HER2- Stage I-III breast cancer [102]
- Feature Selection: Sequential forward feature selection identifying grade, PR status/percentage, and Ki-67% as most contributory [102]
- Model Validation: External validation on diverse cohort of 970 patients with 55-month median follow-up [102]
- Performance Metrics: Quantitative ER/PR/Ki-67 model achieved AUROC of 0.87 (95% CI 0.81-0.93), significantly outperforming non-quantitative models [102]
The Scientist's Toolkit: Research Reagent Solutions
Table 3: Essential Research Reagents and Platforms for IHC Validation Studies
| Reagent/Platform | Function | Application Examples |
|---|---|---|
| PD-L1 CAL10 Assay (Leica Biosystems) | Novel PD-L1 IHC assay for NSCLC | Feasibility study demonstrating concordance with SP263 assay [100] |
| BOND-III Staining System | Automated IHC staining platform | Processing of CAL10 assay in validation studies [100] |
| SP263 Assay (Ventana) | FDA-approved companion diagnostic PD-L1 assay | Comparator assay in validation studies [100] |
| Benchmark Ultra Staining System | Automated IHC staining platform | Processing of SP263 comparator assay [100] |
| Aperio GT 450 Scanner | Whole slide imaging system | Digital pathology validation and computational analysis [100] [101] |
| Quantitative Digital Pathology Algorithms | Computational scoring of biomarker expression | PD-L1 QCS system for continuous scoring of staining intensity [101] |
Figure 2: Traditional vs. Digital Scoring Paradigms - This diagram contrasts the traditional visual scoring approach with emerging digital quantitative scoring methodologies, highlighting how computational approaches address limitations of semi-quantitative assessment and enable more precise patient stratification [101].
The harmonization of validation requirements for predictive IHC markers represents a significant advancement in standardizing biomarker testing across laboratories. The 2024 CAP guideline update establishes a consistent framework with 90% concordance requirements for all predictive markers, including HER2, PD-L1, and ER/PR, while recognizing the need for specific validation of distinct assay-scoring system combinations [3]. Emerging methodologies such as quantitative continuous scoring and machine learning approaches are enhancing the precision and clinical utility of traditional biomarkers, enabling more refined patient stratification and treatment selection [102] [101]. As biomarker testing continues to evolve with the recognition of novel categories such as HER2-low and HER2-ultralow [99] and the clinical implementation of complex biomarkers like PD-L1, adherence to standardized validation protocols remains essential for ensuring accurate, reproducible results that reliably guide therapeutic decisions.
In the field of immunohistochemistry (IHC), the accuracy and reproducibility of research and diagnostic outcomes hinge on the rigorous validation of antibodies and assays. As laboratories increasingly transition between testing platforms and antibody manufacturers, a clear understanding of validation and verification protocols becomes paramount. The College of American Pathologists (CAP) emphasizes that laboratories must validate/verify the performance characteristics of all assays before issuing patient results, with lack of documentation risking citation by accrediting agencies [3]. This guide objectively compares the performance characteristics of platform-wide versus clone-specific validation approaches, providing the experimental data and methodologies needed to ensure reliable IHC outcomes during method transfer or reagent changes.
Understanding Validation Tiers: Platform-Wide vs. Clone-Specific Approaches
Antibody validation strategies can be systematically categorized into tiers based on the scope and application of the validation data. Understanding these categories is fundamental to selecting the appropriate validation pathway.
Platform-Wide Validation applies to assays that use a standardized method across multiple targets or products, such as a laboratory's established IHC protocol for a class of monoclonal antibodies. This approach leverages the laboratory's cumulative experience with a particular testing platform (e.g., a specific automated stainer and detection system). The CAP guidelines acknowledge that for unmodified US Food and Drug Administration (FDA) approved/cleared assays, explicit verification requirements may be sufficient [3]. Similarly, in biomanufacturing, a "generic validation" approach can be used for platform assays that are not product-specific, such as those commonly used for monoclonal antibodies, speeding up the implementation of new products [103].
Clone-Specific Validation is required when the validation data for one antibody clone or one manufacturer's product cannot be extrapolated to another, even if they target the same protein. This is often the case because different antibody clones recognize distinct epitopes on the target protein, which can be differentially affected by tissue fixation and processing [1]. The 2024 CAP guideline update harmonizes validation requirements for all predictive markers, stipulating that laboratories should separately validate/verify each assay-scoring system combination [3].
Table 1: Tiered Validation Requirements Based on Antibody Knowledge and History
| Tier Level | Description | Validation Requirements |
|---|---|---|
| Tier 1 | Well-known antibody with high-quality literature evidence. | Limited verification, often confirming established performance characteristics on in-house equipment. |
| Tier 2 | Well-known antibody used in an alternative species or unvalidated tissue. | More extensive validation to demonstrate specificity and sensitivity in the new context. |
| Tier 3 | Unknown antibody with inconsistent or no literature evidence. | Full validation is required, including the use of multiple complementary techniques to confirm specificity. |
The decision to employ a platform or clone-specific approach is not mutually exclusive. A hybrid model is often most effective, where a laboratory's standardized platform protocols form a baseline, and clone-specific validation is performed to address particularities of new antibodies or critical biomarkers [1].
Comparative Performance Data: Failure Rates and Success Metrics
Empirical data on antibody performance provides critical insights for planning validation strategies. A large-scale study by YCharOS, which tested 614 commercial antibodies for 65 neuroscience-related proteins, offers a stark view of the validation landscape. The study, which used standardized protocols in wild-type versus CRISPR knockout (KO) cell lines, found that more than 50% of all antibodies failed in one or more applications (Western Blot, Immunoprecipitation, or Immunofluorescence) [10].
Table 2: Antibody Performance Success Rates by Application and Type
| Performance Category | Western Blot (WB) | Immunoprecipitation (IP) | Immunofluorescence (IF) |
|---|---|---|---|
| Targets with ≥1 well-performing recombinant antibody | 50 out of 65 targets | 49 out of 65 targets | 30 out of 65 targets |
| Targets with ≥1 well-performing monoclonal antibody | Data not specified in study | Data not specified in study | Data not specified in study |
| Targets with ≥1 well-performing polyclonal antibody | Data not specified in study | Data not specified in study | Data not specified in study |
| Overall Commentary | Recombinant antibodies demonstrated superior performance compared to monoclonal and polyclonal antibodies. |
This research highlights several key trends: First, recombinant antibodies, defined by their sequence and offering superior renewability, generally performed better than traditional monoclonal or polyclonal antibodies [10]. Second, for the proteins studied, coverage by at least one high-performing antibody was significant, suggesting that successful validation is possible with careful reagent selection. These findings underscore the necessity of rigorous, application-specific testing, especially when changing manufacturers or antibody clones.
Experimental Protocols for Validation and Transfer
Implementing a robust validation protocol is essential when moving an assay to a new platform or adopting a new antibody clone. The following methodologies, drawn from guidelines and peer-reviewed literature, provide a framework for generating reliable performance data.
Protocol for Initial Clone-Specific Antibody Validation
This protocol is recommended for Tier 3 antibodies or when a new clone is introduced for a critical biomarker [1].
- Understand the Target: Conduct a comprehensive literature review using databases like Uniprot or GeneCards to determine expected expression patterns, sub-cellular localization, and potential splice variants [1].
- Identify Control Materials:
- Cell Lines: Use positive and negative control cultured cells. Confidence is increased by confirming expression profiles with multiple assay formats (e.g., flow cytometry or Western blot) before using them for IHC controls. Create formalin-fixed, paraffin-embedded (FFPE) cell blocks from these lines, processing them identically to tissue samples to mimic the test matrix. Cell line microarrays (CLAs) can be constructed for efficient testing [1].
- Tissues: Select positive and negative control tissues identified from the literature. For disease biomarkers, include a range of pathologies and matched normal tissue. Validate the quality of all tissue controls with characterized generic antibodies (e.g., cytokeratin for epithelium) [1]. For phosphoproteins, minimize ischemia time and use a pan-phosphotyrosine antibody to assess tissue suitability [1].
- Optimize IHC Method: Systematically test multiple antigen retrieval conditions (e.g., heat-induced epitope retrieval at varying pH levels) and antibody titrations to determine the optimal protocol. The use of automated stainers is encouraged for improved reproducibility [1] [65].
- Confirm Specificity with Orthogonal Methods: The CAP guidelines list several comparator options, ordered from most to least stringent [3]:
- Comparison to IHC results from cell lines with known protein amounts ("calibrators").
- Comparison with a non-IHC method (e.g., flow cytometry, fluorescent in-situ hybridization).
- Genetic knockout or knockdown of the target protein.
- Use of a blocking peptide to compete for antibody binding.
- Comparison against expected architectural and subcellular localization.
- Establish Concordance: For quantitative assays, the updated CAP guidelines recommend a minimum concordance of 90% when comparing the new assay's results to a validated comparator [3].
Protocol for Platform Assay Transfer and Revalidation
This protocol applies when moving a validated assay to a new instrument within the same lab or transferring it to a different laboratory site.
- Risk Assessment: Based on the assay's performance history and criticality, determine the extent of revalidation required. For a reliable platform assay, the transfer process can be simplified [103].
- Plate Uniformity and Variability Assessment: As outlined in the Assay Guidance Manual, a plate uniformity study should be conducted on the new platform. This involves running assays over multiple days to assess the uniformity and separation of signals, typically using "Max," "Min," and "Mid" signal controls [104].
- Comparative Testing (Side-by-Side Study): The most common approach for quantitative methods is to perform side-by-side testing of a set of patient samples (including positive, negative, and borderline cases) on both the original and new platforms. The results must pass pre-established acceptance criteria, such as the 90% concordance rule [3] [103].
- Documentation: Thoroughly document the reason for the transfer, the validation protocol, all data collected, and the conclusion that the assay performs acceptably on the new platform [105].
Diagram 1: Validation Pathway Decision Tree
The Scientist's Toolkit: Essential Reagents and Materials
A successful validation study requires carefully selected control materials and reagents. The following table details key components for a robust IHC validation toolkit.
Table 3: Essential Research Reagent Solutions for IHC Validation
| Reagent/Material | Function in Validation | Key Considerations |
|---|---|---|
| CRISPR Knockout (KO) Cell Lines | The gold standard for confirming antibody specificity by providing an isogenic negative control. The target protein signal should be absent in the KO line [10]. | Can be costly to generate. RNAi knockdown is an alternative but may not achieve complete protein loss. |
| FFPE Cell Pellets (Positive/Negative) | Provide a controlled cellular substrate with known expression levels, processed identically to patient tissues. Used for initial optimization and as ongoing run controls [106] [1]. | Should be lightly spun to retain cytology and fixed using the same protocol as tissue samples. |
| Tissue Microarrays (TMAs) | Allow high-throughput validation across a spectrum of tissues and tumors on a single slide, maximizing data while ensuring uniform technical parameters [1]. | Must include cores from both positive and negative control tissues. Section storage time should be standardized to prevent epitope degradation. |
| Blocking Peptides | Peptides corresponding to the antibody's epitope. Their ability to abolish specific staining confirms antibody specificity [106]. | Rules out Fc-mediated or other non-specific binding. An essential control for custom or poorly characterized antibodies. |
| Phospho-specific Antibody Controls | For validating antibodies targeting phosphorylated epitopes, which are highly susceptible to pre-analytical variables like ischemia [1]. | A pan-phosphotyrosine antibody can help assess overall tissue phospho-preservation. Fixation delays must be minimized. |
| Reference Antibodies | Well-characterized antibodies for standard markers (e.g., Cytokeratin AE1/3, Desmin) used to validate the quality and morphology of control tissues [1]. | Ensure that negative results are due to a true absence of the target and not poor tissue quality or over-fixation. |
Navigating the complexities of platform and clone-specific validation is a fundamental requirement for generating reliable IHC data. The empirical evidence clearly shows that a one-size-fits-all approach is inadequate, with over half of commercial antibodies failing rigorous application-specific testing. A risk-based, tiered strategy that leverages platform efficiencies where possible, while mandating thorough clone-specific validation for new critical reagents, provides a pragmatic and robust path forward. By adhering to structured experimental protocols, utilizing essential control materials like KO cell lines and TMAs, and meticulously documenting all processes, researchers and drug developers can confidently move assays and change manufacturers without compromising data integrity, thereby accelerating the pace of reproducible scientific discovery.
Robust antibody validation is a critical foundation for reliable immunohistochemistry (IHC) research and biomarker discovery. The College of American Pathologists (CAP) emphasizes that before issuing patient results, laboratories must validate or verify the performance characteristics of all assays, ensuring accuracy and reducing variation in IHC practices [3]. Control strategies form the backbone of this validation process, providing standardized materials to confirm antibody specificity, sensitivity, and reproducibility across experimental conditions. Among the most valuable tools for this purpose are cell pellets, tissue microarrays (TMAs), and well-characterized positive/negative tissue controls. These materials enable researchers to systematically assess antibody performance against known expression patterns, providing critical evidence of assay reliability. The evolving landscape of precision medicine demands increasingly stringent validation standards, particularly for predictive markers with distinct scoring systems such as PD-L1 and HER2 [3] [25]. This guide objectively compares the performance characteristics of these primary control strategies, providing experimental data and methodologies to inform selection criteria for research and diagnostic applications.
Comparative Analysis of Control Strategies
The following table summarizes the key characteristics, applications, and performance data of the three primary control strategies used in IHC antibody validation.
Table 1: Performance Comparison of Control Strategies in IHC Validation
| Control Type | Primary Applications | Key Advantages | Limitations | Validation Performance Data |
|---|---|---|---|---|
| Cell Pellets | - Target specificity verification- Assessing cross-reactivity- Protocol optimization [107] | - Controlled expression levels- High reproducibility- Suitable for knockout validation [32] | - Lacks native tissue architecture- May not reflect in vivo conditions | - Western blot confirmation of appropriate molecular weight [107]- 100% concordance with transfection status in transfected 293T cells [107] |
| Tissue Microarrays (TMAs) | - High-throughput biomarker screening- Assessing staining across multiple tissues [108] | - Parallel analysis of numerous samples- Conservation of precious samples- Cost-effective [108] | - Intra-tumor heterogeneity may not be fully represented- Technical challenges in construction [108] | - Validation over a broad spectrum of tissue types [107]- Enables analysis of hundreds to thousands of samples simultaneously [109] |
| Positive/Negative Tissues | - Analytical sensitivity/specificity determination- Clinical correlation studies [3] | - Preservation of native tissue context- Includes relevant internal controls | - Limited availability of well-characterized tissues- Variable pre-analytical conditions | - CAP requires ≥90% overall concordance with expected results [3] [25]- 10 positive and 10 negative cases recommended for alternative fixatives [3] |
Experimental Protocols for Control Implementation
Cell Pellet Preparation and Validation Protocol
Cell pellets provide an essential platform for initial antibody validation, particularly for establishing target specificity. The following protocol outlines the standard methodology for creating and utilizing formalin-fixed, paraffin-embedded (FFPE) cell pellets:
- Cell Culture and Collection: Culture cells under appropriate conditions. For validation, include both positive control cells (endogenously expressing the target protein or transfected with the target gene) and negative controls (lacking the target protein or using CRISPR-Cas9 knockout cells) [32]. Collect cells by gentle scraping (to preserve cell surface proteins) rather than trypsinization. Centrifuge at 1200 rpm for 5 minutes at room temperature [108].
- Fixation and Processing: Resuspend the cell pellet in 10% neutral buffered formalin for 1 hour with gentle agitation to ensure uniform fixation [108]. Following fixation, centrifuge at 2800 rpm for 5 minutes, discard the supernatant, and embed the pellet in liquefied Histogel according to the manufacturer's instructions [108].
- Paraffin Embedding: Place the Histogel-embedded cell pellet into a histological cassette and process through a standard histological dehydration series: 70%, 95%, and 100% alcohol, followed by clearing with xylene substitute and paraffin infiltration [108]. Embed in liquefied paraffin at 60°C.
- Validation Staining: Section the resulting FFPE cell pellet block at 2-4 µm thickness. Use the antibody in development alongside verified control antibodies for comparison. For phospho-specific antibodies, include phosphatase-treated sections to confirm loss of signal [107]. Use peptide blocking experiments to verify specificity, where pre-incubation of the antibody with its target peptide should abolish staining [107].
Table 2: Essential Research Reagents for Cell Pellet Validation
| Reagent/Cell Line | Function in Validation | Specific Example |
|---|---|---|
| 293T Transfected Cells | Verify antibody specificity for target protein by engineering expression [107] | HER3, EGFR, HER2, HER4 transfection to test erbB family antibodies [107] |
| CRISPR-Cas9 KO Cells | Confirm absence of non-specific binding by removing the target gene [32] | D556 medulloblastoma cells knocked out for AZIN1 [110] |
| Lipofectamine 3000 | Transfection reagent for introducing target genes into cell lines [110] | Transient transfection of pcDNA3.1-Clover-AZIN1 [110] |
| Phosphatase Enzymes | Treatment of cell/tissue sections to verify phospho-antibody specificity [107] | Confirmation of phospho-specific antibody binding |
| Blocking Peptides | Compete with antigen binding to confirm antibody specificity [107] | Vimentin antibody staining abolished with antigen-specific peptide [107] |
Tissue Microarray Construction and Application
TMAs represent a powerful high-throughput tool for validating antibody performance across a wide spectrum of tissues simultaneously. The streamlined workflow involves:
- Design and Donor Block Preparation: Select a recipient block mold based on the required core number (e.g., 35 cores with 3mm diameter) [108]. From donor FFPE tissue blocks, section at 2-4 µm and stain with H&E to identify representative areas for coring. For cell line CMAs, ensure a cell concentration between 1×10^6 and 5×10^7 cells per condition to form a compact pellet [108].
- Core Extraction and Assembly: Using a manual tissue microarrayer and dermal biopsy punch needles (diameter 0.6-4.0 mm), extract cylindrical cores from the identified regions of each donor block [108]. Insert them into the pre-formed holes in the recipient paraffin block at defined array coordinates.
- Block Homogenization and Sectioning: To ensure core adherence, place the finished TMA block upside down on a glass slide and incubate at 37°C overnight. Perform a series of heating (37°C and 60°C) and cooling cycles to fuse the cores with the recipient block paraffin [108]. Section the block at 2-4 µm thickness, collecting ribbons on coated glass slides. Stain every 10th section with H&E for morphological control.
- Validation Application: Use TMA sections for IHC with the antibody under validation. The design should include positive and negative control tissues, as well as "orientation cores" (e.g., from liver or spleen) that are macroscopically visible to maintain correct orientation during analysis [108]. This allows for the simultaneous assessment of antibody performance across dozens to hundreds of tissue samples on a single slide.
Positive and Negative Tissue Selection and Use
The use of well-characterized positive and negative tissues represents the gold standard for establishing clinical relevance and analytical specificity. The CAP guidelines provide a clear framework for their use [3]:
- Tissue Selection Criteria: Select positive tissues with known expression of the target antigen, covering a range of expression levels (weak, moderate, strong). Negative tissues should lack the target antigen or show known loss of expression (e.g., SDH-mutated tumors for Succinate Dehydrogenase subunit B (SDHB) IHC) [111]. Include tissues with known potential cross-reactants to challenge antibody specificity.
- Validation Study Design: For a complete validation, the CAP update recommends testing a minimum of 10 positive and 10 negative cases, especially when applying an assay to cytology specimens or alternative fixatives that differ from the original validation [3]. The overall concordance between the new assay and the expected results should meet or exceed 90% [3] [25].
- Scoring and Interpretation: For predictive markers like PD-L1 and HER2 that employ distinct scoring systems, each assay-scoring system combination must be validated separately [3] [25]. Pathologist review is essential to account for staining patterns (membranous, cytoplasmic, nuclear), heterogeneity, and appropriate internal controls.
Integrated Validation Pathway
A comprehensive antibody validation strategy integrates all three control types in a tiered approach. The following pathway visualizes the logical sequence for implementation, from initial specificity checks to clinical relevance assessment.
The objective comparison of control strategies reveals that cell pellets, TMAs, and positive/negative tissues offer complementary rather than competing value in antibody validation pipelines. Cell pellets provide the fundamental proof of specificity through genetic and biochemical interventions. TMAs enable efficient, high-throughput assessment of antibody performance across a wide biological landscape, conserving precious samples and reagents. Finally, well-characterized positive and negative tissues establish the clinical validity and scoring criteria essential for translational research and diagnostic application. Adherence to updated CAP guidelines, which require a minimum of 90% concordance and separate validation for distinct scoring systems, ensures rigorous standards [3] [25]. The integration of all three strategies, as detailed in the experimental protocols, creates a robust framework that maximizes antibody reliability, reduces irreproducible results, and ultimately strengthens the foundation of IHC-based research and biomarker discovery.
Immunohistochemistry (IHC) is a powerful technique that enables researchers and drug development professionals to visualize protein expression within intact tissue architectures. This capability makes it indispensable for both basic research and diagnostic applications. However, the complexity of IHC, involving multiple steps from tissue fixation to antibody binding, introduces significant variability that can compromise result reproducibility. Antibody validation represents the critical process of demonstrating that an antibody specifically binds to its intended target antigen in IHC applications, ensuring that observed staining patterns accurately reflect biological reality rather than technical artifacts.
The fundamental challenge in IHC validation stems from several factors: the effects of tissue fixation and processing on antigen accessibility, the potential for antibody cross-reactivity with similar epitopes or unrelated proteins, and the absence of a universal "gold standard" for comparison in many cases. Formalin fixation, a standard tissue preservation method, creates methylene bridges that can alter protein conformations and mask antibody binding sites, while antigen retrieval techniques only partially restore antigen reactivity [49]. These technical variables necessitate rigorous, application-specific validation, as an antibody proven specific in western blotting may perform unpredictably in IHC due to these differing conditions [49].
Within the regulated environments of drug development and clinical diagnostics, proper documentation of validation procedures becomes paramount. Maintaining comprehensive audit trails of antibody performance characteristics, lot-to-lot consistency data, and protocol parameters ensures not only scientific rigor but also regulatory compliance. This article examines current validation methodologies, compares their stringency and applications, and provides a framework for implementing robust quality assurance practices in IHC workflows.
Core Validation Methodologies: A Comparative Analysis
The International Working Group on Antibody Validation (IWGAV) has established five "conceptual pillars" to guide antibody validation strategies. These pillars provide a standardized framework for demonstrating antibody specificity across different research contexts [40].
Genetic Validation Strategies
Genetic strategies involve modifying the target gene expression in biological systems and assessing antibody binding in controlled conditions. The most definitive approach utilizes CRISPR-Cas or RNAi technologies to knock out or knock down the target gene in cell lines, then compares antibody reactivity between wild-type and modified cells [40] [10]. A clear reduction or elimination of signal in the knockout cells provides strong evidence of target specificity.
This method's strength lies in its direct manipulation of the putative target, creating a definitive negative control. However, compensatory upregulation of related proteins or incomplete knockout can complicate interpretation. Additionally, generating validated knockout cell lines for each target requires significant resources and expertise, making this approach more feasible for core facilities or large-scale initiatives like YCharOS, which has characterized hundreds of antibodies using this methodology [10].
Orthogonal Validation Strategies
Orthogonal strategies employ antibody-independent methods to quantify target expression across multiple samples, then examine the correlation with IHC results [40]. Mass spectrometry-based proteomics represents a powerful orthogonal method, particularly when using liquid chromatography-mass spectrometry (LC-MS) to directly measure target protein levels in tissues characterized by IHC [49].
The major advantage of orthogonal approaches is their independence from antibody-based detection, providing an unbiased measurement for comparison. LC-MS proteomics can definitively identify the presence and quantity of the target protein in validation tissues, creating a robust reference standard [49]. Limitations include the technical expertise and equipment required, potential differences in sensitivity between methods, and the challenge of mapping bulk protein measurements to specific cellular localizations observed in IHC.
Independent Antibody Validation
This strategy requires two or more independent antibodies recognizing distinct epitopes on the same target protein to demonstrate concordant staining patterns [40]. The statistical likelihood of multiple antibodies sharing the same non-specific binding characteristics is low, so reproducible patterns across antibodies strongly support specificity.
This approach is particularly valuable for clinically validated biomarkers where multiple antibody clones exist, such as HER2 testing in breast cancer. The limitation arises when only one antibody is available for a novel target, or when different antibodies yield conflicting results without a clear reference standard for adjudication.
Tagged Protein Expression
This method modifies the endogenous target gene to include sequences for an affinity tag (e.g., HIS, FLAG) or fluorescent protein (e.g., GFP). The correlation between signal from the tagged protein and antibody-based detection then validates specificity [40].
This approach allows precise spatial correlation when using fluorescent tags and can be implemented with endogenous gene editing for physiologically relevant expression levels. However, tags can potentially alter protein folding, localization, or function, and the genetic manipulation required may not be feasible for all model systems.
Immunocapture with Mass Spectrometry
Immunocapture followed by mass spectrometry (IP-MS) couples immunoprecipitation with MS analysis to directly identify proteins that interact with the antibody [40]. This method uniquely verifies the true antibody target and can identify protein modifications, isoforms, off-targets, and interacting partners.
IP-MS provides the most comprehensive characterization of antibody specificity available, as it directly identifies all proteins captured by the antibody rather than inferring specificity through binding patterns. Thermo Fisher Scientific has implemented IP-MS as a core validation method, enabling them to verify target engagement and identify potential off-target interactions [40]. The main limitations are the requirement for soluble, native protein conformations and the technical complexity of the methodology.
Table 1: Comparison of Antibody Validation Methods
| Validation Method | Key Principle | Applications Supported | Stringency | Limitations |
|---|---|---|---|---|
| Genetic Strategies | Target knockout/knockdown followed by signal loss verification | WB, IHC, IF, IP | High | Resource-intensive; potential compensatory mechanisms |
| Orthogonal Strategies | Correlation with antibody-independent quantification | IHC, IF | Medium-High | Method sensitivity differences; mapping challenges |
| Independent Antibodies | Concordance across different epitopes | All applications | Medium | Requires multiple well-characterized antibodies |
| Tagged Protein Expression | Correlation with tag signal | IF, ICC, IHC | Medium | Tag may alter protein properties |
| IP-MS | Direct identification of captured proteins | IP, co-IP | Very High | Requires soluble protein; technical complexity |
Quantitative Comparison of Antibody Performance
Large-scale validation initiatives provide crucial data on antibody performance trends across the commercial landscape. The YCharOS initiative, which systematically characterized 614 commercial antibodies for 65 neuroscience-related proteins, offers revealing insights into success rates across applications and antibody types [10].
Performance Across Applications
The YCharOS study found significant variation in antibody success rates across different applications. When testing antibodies against the same 65 protein targets, researchers identified well-performing antibodies for 55 targets (85%) in western blot, 49 targets (75%) in immunoprecipitation, and 30 targets (46%) in immunofluorescence [10]. This application-dependent performance highlights the critical importance of validating antibodies specifically for IHC, even when they perform well in other techniques.
The lower success rate in immunofluorescence applications, which share similarities with IHC in detecting proteins in their cellular context, underscores the particular challenges of immunostaining complex samples. Factors such as epitope accessibility after fixation, antibody penetration through cellular structures, and target abundance all contribute to these application-specific performance differences.
Renewable vs. Traditional Antibodies
Renewable antibodies, particularly recombinant antibodies, demonstrated superior performance compared to traditional monoclonal and polyclonal antibodies in large-scale assessments. Recombinant antibodies are produced from defined gene sequences, ensuring perpetual consistency, while traditional monoclonals come from hybridomas that can suffer from drift or loss, and polyclonals show inherent batch-to-batch variability [10].
The YCharOS study found that recombinant antibodies consistently outperformed other types across applications. This performance advantage, combined with their renewable nature, makes them particularly valuable for regulated environments where consistency and documentation are paramount. Despite these advantages, the study noted that approximately 50% of all commercial antibodies failed in one or more application tests, highlighting the ongoing need for rigorous validation [10].
Table 2: Antibody Performance Metrics Across Validation Studies
| Performance Category | Western Blot Success Rate | Immunoprecipitation Success Rate | Immunofluorescence Success Rate | Key Findings |
|---|---|---|---|---|
| All Antibodies (YCharOS) | 85% (55/65 targets) | 75% (49/65 targets) | 46% (30/65 targets) | >50% of antibodies failed in ≥1 test [10] |
| Renewable Antibodies | 77% (50/65 targets) | 75% (49/65 targets) | 46% (30/65 targets) | Recombinant antibodies outperformed other types [10] |
| Clinical IHC Assays | N/A | N/A | ≥90% concordance required | CAP guidelines mandate 90% concordance for validated IHC assays [3] |
Experimental Protocols for IHC Validation
Standardized IHC Validation Workflow
The College of American Pathologists (CAP) has established evidence-based guidelines for analytical validation of IHC assays, recently updated in 2024 to address emerging challenges [3]. These guidelines provide a framework for establishing and documenting antibody performance before clinical use.
IHC Validation Workflow
Cell Line-Based Specificity Testing
Cell line models provide controlled systems for initial antibody specificity assessment. The process involves creating binary systems with known positive and negative expression cell lines, as demonstrated in the development of Claudin-6 antibodies [49].
Protocol Details:
- Cell Line Selection: Identify cell lines with naturally high and low/absent target expression through RNA expression data (e.g., DepMap database) or proteomic analysis [10].
- Cell Pellet Preparation: Culture positive (OVCAR-3 for Claudin-6) and negative (DU 145 for Claudin-6) cell lines, harvest, and fix in formalin.
- Paraffin Embedding: Process fixed cells into paraffin blocks using standard histological protocols.
- IHC Staining: Perform IHC on sectioned cell pellets using the candidate antibody across a range of concentrations.
- Specificity Assessment: Evaluate for appropriate staining in positive cells and absence of signal in negative cells, noting any non-specific nuclear or cytoplasmic staining [49].
This approach enabled CST scientists to identify problematic antibodies showing non-specific nuclear staining in both positive and negative cell pellets, despite working well in other applications [49].
Tissue-Based Validation with Reference Standards
Comprehensive tissue-based validation establishes antibody performance in biologically relevant contexts and requires appropriate comparator samples.
Protocol Details:
- Tissue Selection: Procure human tissue samples with known expression patterns, including both normal and diseased tissues. CAP guidelines recommend minimum 10 positive and 10 negative cases for validation [3].
- Reference Standard Establishment: Use mass spectrometry-based proteomics (LC-MS) to quantitatively verify target expression levels in validation tissues [49].
- Staining Optimization: Titrate antibody concentrations using tissues with medium expression levels to establish optimal signal-to-noise ratio.
- Specificity Verification: Employ blocking peptides where available to compete away specific binding, or demonstrate appropriate cellular and subcellular localization patterns consistent with known biology.
- Cross-reactivity Assessment: Test against tissues expressing related proteins (e.g., Claudin-9 for Claudin-6 antibodies) to rule out cross-reactivity [49].
Documentation Requirements for Compliance
Comprehensive documentation creates the audit trail necessary for both scientific reproducibility and regulatory compliance.
Essential Documentation Elements:
- Antibody Information: Clone name, host species, immunoglobulin type, concentration, lot number, and storage conditions.
- Tissue Details: Tissue types, fixation conditions (fixative, duration), processing parameters, and ethical approvals.
- Staining Protocol: Complete reagent list, antigen retrieval method, incubation times and temperatures, detection system, and counterstaining.
- Validation Results: Raw data, scoring criteria, interpreter qualifications, concordance statistics, and outlier analysis.
- Quality Controls: Daily run controls, equipment maintenance records, reagent qualification data, and personnel training documentation.
Quality Assurance and Compliance Framework
Regulatory and Accreditation Standards
The College of American Pathologists (CAP) provides comprehensive guidelines for IHC validation, recently updated in 2024 to address emerging challenges including predictive markers with distinct scoring systems and validation on cytology specimens [3]. These guidelines represent the current standard for clinical IHC laboratories.
Key CAP recommendations include:
- Harmonized Concordance Requirements: All predictive IHC markers must demonstrate ≥90% concordance with reference methods, replacing previous variable requirements for different markers [3].
- Site-Specific Validation: Assays with separate scoring systems for different tumor sites (e.g., HER2 in breast vs. gastric cancer) require separate validation for each application [3].
- Alternative Fixative Validation: IHC assays performed on specimens fixed in alternatives to formalin (e.g., cytology fixatives) require separate validation with minimum 10 positive and 10 negative cases [3].
Clinical Laboratory Improvement Amendments (CLIA) regulations further mandate that laboratories validate/verify performance characteristics of all assays before reporting patient results, regardless of FDA-clearance status [3].
Audit Trail Implementation
Robust audit trails for IHC validation should capture the decision-making process and quality control metrics throughout the antibody selection and validation workflow.
Audit Trail Documentation
The Scientist's Toolkit: Essential Research Reagent Solutions
Table 3: Essential Reagents for IHC Antibody Validation
| Reagent Category | Specific Examples | Function in Validation | Quality Assurance Considerations |
|---|---|---|---|
| Validated Primary Antibodies | Claudin-6 (E7U2O) XP Rabbit mAb #18932 [49] | Target-specific binding in IHC | Application-specific validation; lot-to-lot consistency documentation |
| Control Materials | Paraffin-embedded cell pellets (positive/negative) [112] | Specificity controls for each staining run | Consistent preparation; expression verification by orthogonal methods |
| Detection Systems | HRP-based detection with DAB chromogen | Amplification of specific signal | Sensitivity optimization; minimization of background staining |
| Tissue Microarrays | Human cancer tissue arrays [112] | Broad performance assessment across tissue types | Annotation completeness; expression verification |
| Blocking Reagents | Species-specific sera, IgG fractions | Reduce non-specific background binding | Compatibility with primary antibody host species |
| Antigen Retrieval Reagents | Citrate buffer, EDTA, Tris-EDTA | Epitope unmasking after fixation | pH monitoring; optimization for specific epitopes |
| Specificity Verification Tools | Blocking peptides [112], CRISPR knockout cell lines [10] | Confirm target specificity | Peptide purity documentation; knockout validation data |
Implementing comprehensive antibody validation protocols with meticulous documentation is no longer optional but essential for producing reproducible IHC data in both research and clinical settings. The convergence of standardized validation methodologies like the IWGAV pillars, large-scale characterization initiatives, and updated accreditation guidelines provides a robust framework for quality assurance. By adopting these practices and maintaining complete audit trails, researchers and drug development professionals can significantly enhance the reliability of their IHC data, ultimately accelerating the development of more effective therapeutics while maintaining regulatory compliance.
Conclusion
Robust antibody validation is not a single event but an integral, continuous process essential for the integrity of IHC data. By adhering to structured frameworks like the 'Five Pillars' and stepwise validation protocols, laboratories can ensure antibody specificity, sensitivity, and reproducibility. Mastering pre-analytical variables and troubleshooting common pitfalls are crucial for achieving reliable staining. Furthermore, compliance with evolving standards, such as the 2024 CAP guideline update which harmonizes validation requirements for predictive markers and sets a 90% concordance threshold, is fundamental for clinical translation and drug development. The future of IHC validation lies in the increased adoption of digital pathology and artificial intelligence for objective quantification, alongside greater community collaboration and data sharing to elevate universal standards. Embracing these comprehensive validation principles is paramount for generating trustworthy biological insights and advancing precision medicine.
References
- 1. Antibody validation of immunohistochemistry for biomarker ... [https://pmc.ncbi.nlm.nih.gov/articles/PMC4240800/]
- 2. CST Named 2025 Recombinant Antibody Supplier of the ... [https://www.cellsignal.com/news/23094/cst-wins-citeab-2025-award?srsltid=AfmBOoqjIbrWDd7YSmh9p9Sq3PZ5cutaJlvwVyirOGKnIcScY9sy3XSm]
- 3. Principles of Analytic Validation of Immunohistochemical ... [https://www.cap.org/protocols-and-guidelines/cap-guidelines/current-cap-guidelines/principles-of-analytic-validation-of-immunohistochemical-assays]
- 4. 7 Steps to Immunohistochemistry Validation [https://www.lsbio.com/media/blog/7-steps-to-immunohistochemistry-validation]
- 5. 5 Critical Insights You Need to Know About Antibody ... [https://precisionantibody.com/insights-about-antibody-characterization/]
- 6. Antibody Validation for Immunohistochemistry [https://www.cellsignal.com/about-us/our-approach-process/antibody-validation-immunohistochemistry?srsltid=AfmBOoorR-MVlKkcekvxxPAvrLiK6QKnnNElBfpfWgNnR0cs1W92xEO3]
- 7. Optimization and validation of analytical affinity ... [https://pubmed.ncbi.nlm.nih.gov/37783047/]
- 8. Pull-Down Assays | Thermo Fisher Scientific - ES [https://www.thermofisher.com/us/en/home/life-science/protein-biology/protein-biology-learning-center/protein-biology-resource-library/pierce-protein-methods/pull-down-assays.html]
- 9. When IHC is the application choice [https://www.cellsignal.com/applications/immunohistochemistry/when-use-immunohistochemistry?srsltid=AfmBOopTZ-eoPHgikYWRfG_Vhw5jHytZYBqscjHusMV_m-1WlyMW-g_C]
- 10. Scaling of an antibody validation procedure enables ... [https://pmc.ncbi.nlm.nih.gov/articles/PMC10312534/]
- 11. Frequently Asked Questions from Immunohistochemistry ... [https://www.cap.org/member-resources/councils-committees/immunohistochemistry-topic-center/frequently-asked-questions-from-immunohistochemistry-laboratories]
- 12. Validation, verification, or optimization? Don't guess [https://www.statlab.com/news/validation-verification-or-optimization]
- 13. Immunohistochemistry (IHC) [https://www.cellsignal.com/learn-and-support/overview-of-ihc?srsltid=AfmBOopHATsmUNKQADtKBV-P3gKjLJY9a1Hhw3jUpvPGDe-sCEY_vRWI]
- 14. Antibody Verification | Thermo Fisher Scientific - US [https://www.thermofisher.com/us/en/home/life-science/antibodies/invitrogen-antibody-validation.html]
- 15. Immunohistochemistry vs Immunocytochemistry: Updated ... [https://www.stressmarq.com/blog/immunohistochemistry-vs-immunocytochemistry/?srsltid=AfmBOoq0vK8GXRpcKo38jaIu-4vNBQ1aOE2N2HPNaB3DJuK4o0SakXZp]
- 16. Guide to Antibody Validation Techniques [https://www.neobiotechnologies.com/resources/antibody-validation-methods/?srsltid=AfmBOooKZHf2YiIUWjQcAh90K81Al4Q4tfntIMQGdGbxj_sbSP30z-Zy]
- 17. AI-driven epitope prediction: a systematic review ... [https://www.nature.com/articles/s41541-025-01258-y]
- 18. Antibody Validation for Immunohistochemistry [https://www.cellsignal.com/about-us/our-approach-process/antibody-validation-immunohistochemistry?srsltid=AfmBOooAofRG2Y3d7BvJAvZER-HV_LdWdWw01qTHcglOvJWy8Yao-YkT]
- 19. DECODE enables high-throughput mapping of antibody ... [https://pubmed.ncbi.nlm.nih.gov/PMC11756784]
- 20. Improving B-cell epitope prediction [https://www.sciencedirect.com/science/article/abs/pii/S1359644625002028]
- 21. CLIA, COLA & CAP: What's the Difference? [https://www.bioagilytix.com/blog/clia-cola-cap-whats-the-difference/]
- 22. Simplifying the Process of 'Switching' Antibodies and ... [https://biocare.net/media/white-papers/simplifying-the-process-of-switching-antibodies-and-verifying-the-performance-of-a-modified-ihc-procedure/]
- 23. 2025 CLIA Acceptance Limits for Proficiency Testing [https://www.westgard.com/clia-a-quality/quality-requirements/2024-clia-requirements.html]
- 24. Get Ready for the PT CLIA Changes:… [https://www.cap.org/calendar/webinars/get-ready-for-the-pt-clia-changes-stay-ahead-stay-compliant]
- 25. CAP Updates Their 'Principles of Analytic Validation ... [https://www.bioanalysis-zone.com/cap-updates-their-guidelines-for-principles-of-analytic-validation-of-immunohistochemical-assays/]
- 26. Antibody Validation for Immunohistochemistry [https://www.cellsignal.com/about-us/our-approach-process/antibody-validation-immunohistochemistry?srsltid=AfmBOoqx9gGRVytc8vz8CKCIO9s8W4L48lpawWJNIXbEKkK4BOylK12e]
- 27. Optimizing Immunohistochemistry Validation and ... [https://www.precisionformedicine.com/blog/optimizing-ihc-validation-regulatory-strategies]
- 28. Review of immunohistochemistry techniques: Applications, ... [https://www.sciencedirect.com/science/article/abs/pii/S0740257024000467]
- 29. Scaling of an antibody validation procedure enables ... [https://elifesciences.org/articles/91645]
- 30. Antibody validation for protein expression on tissue slides [https://pmc.ncbi.nlm.nih.gov/articles/PMC7807291/]
- 31. Product Performance & Validation [https://www.cellsignal.com/about-us/cst-antibody-validation-principles?srsltid=AfmBOopSr7mvAbzWp1a8u2iV5h5C103OoGvR2Wj7Dzw0rmPQ5nTRPZEq]
- 32. Antibody Validation Protocols - How To Choose The Most ... [https://bitesizebio.com/35190/antibody-validation-protocol-and-research/]
- 33. Antibody Validation and Research Standards [https://www.nature.com/research-intelligence/nri-topic-summaries/antibody-validation-and-research-standards-micro-346338]
- 34. Antibody Validation Strategies - Introductory Guide [https://blog.citeab.com/antibody-validation-strategies/]
- 35. Five pillars to determine antibody specificity [https://www.abcam.com/en-us/stories/articles/five-pillars-to-determine-antibody-specificity]
- 36. Guide to Antibody Validation Techniques [https://www.neobiotechnologies.com/resources/antibody-validation-methods/?srsltid=AfmBOorTx7W4GfoND_Gd3qQBlsvMooyWPCM35noHBR4yj-pRKETIOV5t]
- 37. 5 Pillars of Antibody Validation [https://www.novusbio.com/5-pillars-validation?srsltid=AfmBOorlzkgZP5dIwqFd_kStr2XFCTluRlYrLpLLJUKmCHcSvfzro33_]
- 38. Enhanced validation of antibodies for research applications [https://www.nature.com/articles/s41467-018-06642-y]
- 39. GeneTex's “5 + 1” Pillar Antibody Validation Process [https://www.genetex.com/Resources/Index/five_pillars?srsltid=AfmBOoo2DjeXb9QAGvD0t250gt2gmiYIEj8hZ2KKgAWzU6BN--iE3d9_]
- 40. Comprehensive Strategy for Antibody Validation [https://www.thermofisher.com/us/en/home/references/newsletters-and-journals/bioprobes-journal-of-cell-biology-applications/bioprobes-75/bioprobes-75-antibody-validation.html]
- 41. Antibody validation - PMC [https://pmc.ncbi.nlm.nih.gov/articles/PMC3891910/]
- 42. Antibody & Cell Line Validation - Resources for Research ... [https://libguides.brown.edu/reproducibility/validation]
- 43. Techniques for Validating CRISPR Changes Using RNA- ... [https://pmc.ncbi.nlm.nih.gov/articles/PMC12027141/]
- 44. Generating and validating CRISPR-Cas9 knock-out cell lines [https://www.abcam.com/en-us/stories/articles/crispr-cas9-knockout-cell-lines]
- 45. Optimization of gene knockout approaches and sgRNA ... [https://www.nature.com/articles/s41598-025-24184-4]
- 46. Rapid and robust validation of pooled CRISPR knockout ... [https://www.nature.com/articles/s41598-025-96095-3]
- 47. A benchmark comparison of CRISPRn guide-RNA design ... [https://bmcgenomics.biomedcentral.com/articles/10.1186/s12864-025-11386-3]
- 48. CRISPR-Cas9 and Its Bioinformatics Tools: A Systematic ... [https://pmc.ncbi.nlm.nih.gov/articles/PMC12109910/]
- 49. Antibody Validation for IHC: Finding a Claudin-6 mAb Clone [https://blog.cellsignal.com/claudin-6-antibody-ihc-validation]
- 50. A critical evaluation of strategies used for validation ... [https://www.sciencedirect.com/science/article/pii/S1574789114000568]
- 51. Immunohistochemistry for Pathologists: Protocols, Pitfalls, ... [https://www.jpatholtm.org/journal/view.php?doi=10.4132/jptm.2016.08.08]
- 52. of PD-L1 Quantitative assays against NIST standard... comparison IHC [https://pmc.ncbi.nlm.nih.gov/articles/PMC8840973/]
- 53. of PD-L1 Quantitative assays against NIST standard... comparison IHC [https://www.nature.com/articles/s41379-021-00884-w?error=cookies_not_supported&code=0581d3da-506e-49bf-a8bd-565d3c819243]
- 54. Precision Medicine in Cytopathology - PMC - PubMed Central [https://pmc.ncbi.nlm.nih.gov/articles/PMC12416530/]
- 55. Immunocytochemistry of cytology specimens for predictive ... [https://pmc.ncbi.nlm.nih.gov/articles/PMC7354113/]
- 56. Validation of Commonly Used Antibodies in Exfoliative ... [https://www.sciencedirect.com/science/article/abs/pii/S2213294515004032]
- 57. IHC-P protocols [https://www.abcam.com/en-us/technical-resources/protocols/ihc-with-samples-in-paraffin]
- 58. IHC Validation [https://www.lsbio.com/resources/ihc-antibody-validation]
- 59. Comparison of Different Antibody Clones for ... - PubMed Central [https://pmc.ncbi.nlm.nih.gov/articles/PMC5815635/]
- 60. Prospective multicenter validation of a next-generation ... [https://bmccancer.biomedcentral.com/articles/10.1186/s12885-025-14770-0]
- 61. Technical development and validation of a clinically ... [https://www.nature.com/articles/s41416-023-02265-3]
- 62. Antibody Validation for Immunohistochemistry [https://www.cellsignal.com/about-us/our-approach-process/antibody-validation-immunohistochemistry?srsltid=AfmBOoqZ5HyT8NVUJkpJURUzVwUXOFfH6YCFFkNgFj3Fs2hQnStrSpjY]
- 63. The effect of prolonged cold ischemia time on estrogen ... [https://www.nature.com/articles/modpathol2012135]
- 64. The impact of impaired tissue fixation in resected non-small ... [https://www.sciencedirect.com/science/article/pii/S0169500223000661]
- 65. Immunohistochemistry for Pathologists: Protocols, Pitfalls, ... [https://pmc.ncbi.nlm.nih.gov/articles/PMC5122731/]
- 66. Impact of delayed and prolonged fixation on the evaluation ... [https://pmc.ncbi.nlm.nih.gov/articles/PMC6647403/]
- 67. Effects of preanalytical variables on the detection of proteins by... [https://pubmed.ncbi.nlm.nih.gov/21526952/]
- 68. Tips and Techniques for Troubleshooting ... [https://www.sigmaaldrich.com/US/en/technical-documents/protocol/protein-biology/immunohistochemistry/antibody-immunohistochemistry-expert-tips-and-techniques?srsltid=AfmBOopRQ7wuz_B89lray5TigyyUsFbSXV7Gr8hFAQxBmCLHCH5USYPj]
- 69. Antibody Validation for Immunohistochemistry [https://www.cellsignal.com/about-us/our-approach-process/antibody-validation-immunohistochemistry?srsltid=AfmBOooMw7NbvbknRO_UfNNQU7MSWwIFE_hY0qMaXYyvOjo2oAlmB_PD]
- 70. Different approaches for interpretation and reporting of... [https://diagnosticpathology.biomedcentral.com/articles/10.1186/s13000-014-0221-9]
- 71. A Comparative Study of HIER Methods: Online vs Offline ... [https://biocare.net/media/white-papers/a-comparative-study-of-hier-methods-online-vs-offline-retrieval/]
- 72. Antigen Retrieval Immunohistochemistry [https://pmc.ncbi.nlm.nih.gov/articles/PMC3201121/]
- 73. Optimizing HIER Antigen Retrieval for IHC [https://www.bosterbio.com/blog/post/protocol-for-optimizing-hier-antigen-retrieval-conditions?srsltid=AfmBOoqCA2iV569g6HARwO5o3eQwXFy1UEJRfCBevbUU9GTPfd__-U47]
- 74. Antigen Retrieval in IHC: Why It Matters and How to Get ... [https://www.atlasantibodies.com/knowledge-hub/blog/antigen-retrieval-in-ihc-why-it-matters-and-how-to-get-it-right/]
- 75. Protocol for Heat-Induced Epitope Retrieval (HIER) [https://www.rndsystems.com/resources/protocols/protocol-heat-induced-epitope-retrieval-hier]
- 76. IHC Epitope/ Antigen Retrieval: HIER vs. PIE [https://www.bio-techne.com/applications/imaging/immunohistochemistry/epitope-retrieval]
- 77. IHC antigen retrieval protocol [https://www.abcam.com/en-us/technical-resources/protocols/ihc-antigen-retrieval]
- 78. Comparison of Antigen Retrieval Methods for ... [https://pmc.ncbi.nlm.nih.gov/articles/PMC11417793/]
- 79. Ten Approaches That Improve Immunostaining: A Review of ... [https://pmc.ncbi.nlm.nih.gov/articles/PMC8836139/]
- 80. International Working Group for Antibody Validation (IWGAV) [https://ms-validatedantibodies.com/validation/]
- 81. Tricks of the Trade for Diluting Antibodies [https://biocare.net/media/white-papers/differentiating-diluents-tricks-of-the-trade-for-diluting-antibodies/]
- 82. Blocking with immunizing peptide protocol [https://www.abcam.com/en-us/technical-resources/protocols/blocking-with-immunizing-peptides]
- 83. Hallmarks of Antibody Validation: Multiple Antibody Strategy [https://www.cellsignal.com/about-us/approach-validation-principles/multiple-antibodies?srsltid=AfmBOortS-LFNTteMK1zSZBBgBV7ZYSxBGE71MRqEDvdSDrj28bGRduZ]
- 84. Enhanced Validation [https://www.atlasantibodies.com/antibody-validation-g484/enhanced-validation/]
- 85. Trust and Transparency Rule: How Scientists Choose ... [https://www.prnewswire.com/news-releases/trust-and-transparency-rule-how-scientists-choose-antibodies-in-2025-302581225.html]
- 86. IHC Staining | Cell Signaling Technology [https://www.cellsignal.com/applications/immunohistochemistry/what-is-immunohistochemistry-staining]
- 87. Incubation Times in Environmental Monitoring [https://www.bioprocessintl.com/qa-qc/a-case-study-in-environmental-monitoring-reviewing-incubation-times-upon-recovery-of-microorganisms]
- 88. A review of artifacts in histopathology - PMC - PubMed Central [https://pmc.ncbi.nlm.nih.gov/articles/PMC6097380/]
- 89. Immunohistochemistry (IHC): The Complete Guide [https://www.antibodies.com/applications/immunohistochemistry]
- 90. ICC/IHC Non-Specific Binding / Staining Prevention Protocol [https://www.rndsystems.com/resources/protocols/preventing-non-specific-staining]
- 91. Artifacts in IHC [https://www.biozol.de/en/techniques/Artifacts-in-IHC]
- 92. Artifacts and non-specific staining in flow cytometry, Part I [https://sanguinebio.com/pbmc-basics/artifacts-and-non-specific-staining-in-flow-cytometry-part-i/?srsltid=AfmBOoq0Cc77Cgn9J_X8WFKTkDfiSvhkSUfFyIz2B8bjALDTEpwZ2773]
- 93. Avoiding pitfalls in diagnostic immunohistochemistry– ... [https://www.sciencedirect.com/science/article/abs/pii/S0740257019300589]
- 94. Antibody Validation for Immunohistochemistry [https://www.cellsignal.com/about-us/our-approach-process/antibody-validation-immunohistochemistry?srsltid=AfmBOopS01LHgZd99yD2HIDzsQ5jXGm3r7pH0acR3C1wUYfiKtUGczyc]
- 95. Concordance of self- and program-reported rates ... [https://pmc.ncbi.nlm.nih.gov/articles/PMC2706767/]
- 96. CAP Publishes New Guideline on PD-L1 Testing ... [https://www.cap.org/member-resources/articles/cap-publishes-new-guideline-on-pd-l1-testing-of-patients-with-lung-cancer]
- 97. Estrogen and Progesterone Receptor Testing in Breast ... [https://www.cap.org/protocols-and-guidelines/cap-guidelines/current-cap-guidelines/guideline-recommendations-for-immunohistochemical-testing-of-estrogen-and-progesterone-receptors-in-breast-cancer]
- 98. HER2 IHC Testing Updates for mNSCLC [https://www.her2know.com/newsletter/her2-ihc-testing-mnsclc-jan-2025-update.html]
- 99. International Expert Consensus Recommendations for ... [https://www.sciencedirect.com/science/article/pii/S0893395225002236]
- 100. Development of a Novel IHC Assay for PD-L1 Detection ... [https://pmc.ncbi.nlm.nih.gov/articles/PMC12562258/]
- 101. Enhanced patient selection with quantitative continuous ... [https://www.nature.com/articles/s41698-025-01107-0]
- 102. Development and validation of a clinical breast cancer tool ... [https://www.nature.com/articles/s41523-024-00651-5]
- 103. Points to Consider in Quality Control Method Validation ... [https://www.bioprocessintl.com/qa-qc/points-to-consider-in-quality-control-method-validation-and-transfer]
- 104. HTS Assay Validation - Assay Guidance Manual - NCBI - NIH [https://www.ncbi.nlm.nih.gov/books/NBK83783/]
- 105. Revalidation requirements: Medical device process ... [https://medicaldevicehq.com/articles/revalidation-requirements-medical-device-process-validation/]
- 106. Antibody Validation for Immunohistochemistry [https://www.cellsignal.com/about-us/our-approach-process/antibody-validation-immunohistochemistry?srsltid=AfmBOorudjqF57Ufl0fRsbmyWtXX-08eCXBXEMakwesWov-vo9WI5fZ1]
- 107. Antibody Validation for Immunohistochemistry [https://www.cellsignal.com/about-us/our-approach-process/antibody-validation-immunohistochemistry?srsltid=AfmBOorolLn-JhKgII7hj7-Ki5NJqNXxCsJFPp3L4rLcjcI2PnzqI0AI]
- 108. Cell Microarray: An Approach to Evaluate Drug-Induced ... [https://www.ncbi.nlm.nih.gov/books/n/cod9780645332094/Ch9/]
- 109. Multiparametric cellular and spatial organization in cancer ... [https://www.nature.com/articles/s41551-025-01475-9]
- 110. AZIN1 level is increased in medulloblastoma and correlates ... [https://jeccr.biomedcentral.com/articles/10.1186/s13046-025-03274-1]
- 111. Technical Challenges Faced in Validation of ... [https://pubmed.ncbi.nlm.nih.gov/41246894/]
- 112. Antibody Validation for Immunohistochemistry [https://www.cellsignal.com/about-us/our-approach-process/antibody-validation-immunohistochemistry?srsltid=AfmBOoqo-okkhYGt0Ui1msQqErFPD8wwc2jgG0V19bFMax1YJ8fsMdk1]