CAP IHC Validation Guidelines 2024: A Step-by-Step Protocol for Assay Qualification and Compliance
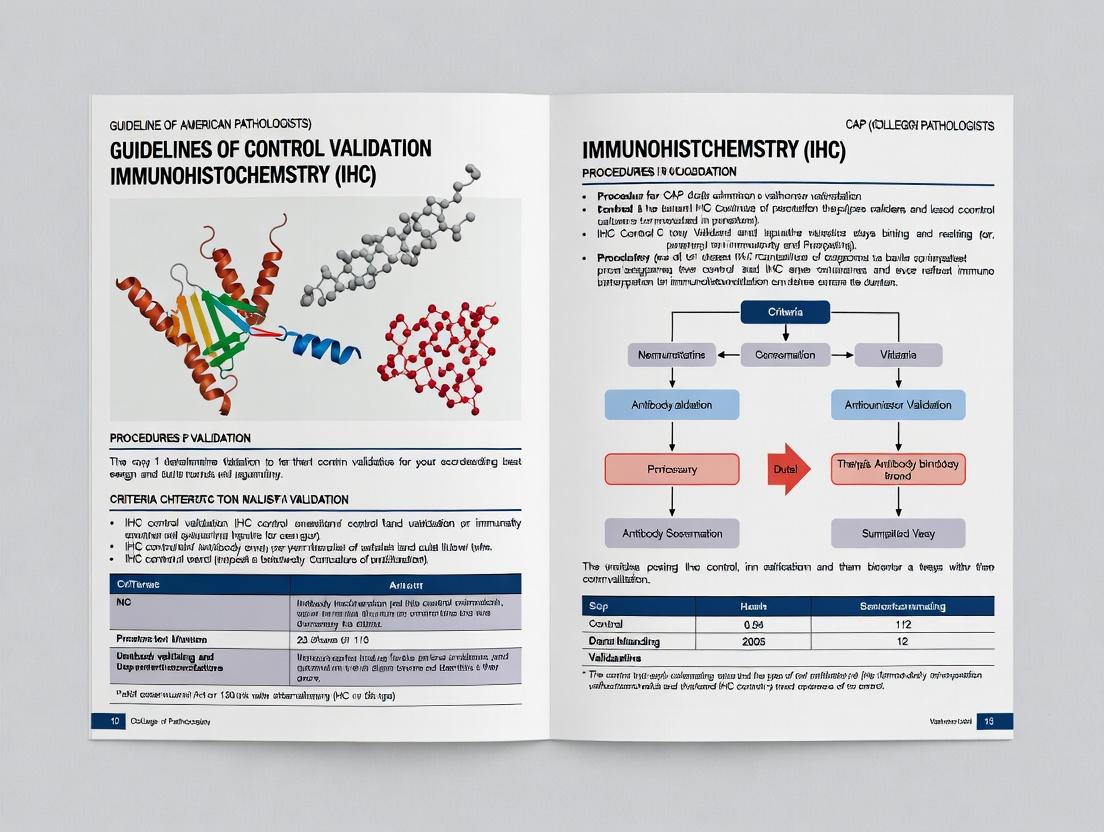
This comprehensive guide details the College of American Pathologists (CAP) guidelines for immunohistochemistry (IHC) control validation, providing researchers, scientists, and drug development professionals with the essential framework to ensure assay...
CAP IHC Validation Guidelines 2024: A Step-by-Step Protocol for Assay Qualification and Compliance
Abstract
This comprehensive guide details the College of American Pathologists (CAP) guidelines for immunohistochemistry (IHC) control validation, providing researchers, scientists, and drug development professionals with the essential framework to ensure assay accuracy, reproducibility, and regulatory compliance. Covering foundational concepts, methodological application, troubleshooting, and comparative validation strategies, this article translates CAP requirements into actionable workflows for preclinical and clinical research settings, ultimately supporting robust biomarker discovery and therapeutic development.
Demystifying CAP IHC Validation: Understanding the Why and What for Robust Biomarker Assays
CAP Accreditation and Its Impact on IHC Standardization
The College of American Pathologists (CAP) accreditation program is a critical benchmark for clinical and research laboratories, establishing stringent requirements for quality assurance, standard operating procedures, and personnel competency. Within the field of Immunohistochemistry (IHC), CAP guidelines serve as the cornerstone for standardization, directly addressing the pre-analytical, analytical, and post-analytical variables that historically led to inter-laboratory inconsistency.
Adherence to CAP Laboratory General (GEN) and Anatomic Pathology (ANP) checklists ensures rigorous validation of IHC assays, including antibody verification, control selection, and protocol optimization. This standardization is paramount for reproducibility in research and reliability in clinical diagnostics, particularly in predictive biomarker testing (e.g., PD-L1, HER2) for drug development.
Comparison Guide: IHC Assay Performance Under CAP-Accredited vs. Non-Accredited Conditions
The following table synthesizes data from comparative studies evaluating key IHC performance metrics in laboratories with and without CAP-accredited protocols.
Table 1: Comparative IHC Performance Metrics
| Performance Metric | CAP-Accredited Lab (Mean ± SD) | Non-Accredited Lab (Mean ± SD) | Key Experimental Finding |
|---|---|---|---|
| Inter-Lab Reproducibility (Score) | 95% ± 3% (n=15 labs) | 72% ± 15% (n=15 labs) | CAP labs showed significantly higher concordance in HER2 IHC scoring on standardized tissue microarrays (TMAs). |
| Antibody Validation Success Rate | 98% ± 2% | 85% ± 10% | CAP-enforced validation protocols (positive/negative controls, titration) reduced non-specific binding reports. |
| Pre-Analytical Variable Impact | CV: 8% | CV: 25% | Standardized fixation (24h, 10% NBF) and processing in CAP labs minimized staining intensity variability. |
| Run-to-Run Consistency (CV%) | 4.5% ± 1.2% | 11.8% ± 5.7% | Use of CAP-mandated daily controls and instrument maintenance logs reduced technical variation. |
| Pathologist Scoring Concordance (Kappa) | 0.89 (Substantial) | 0.62 (Moderate) | Standardized reporting protocols and controls in CAP labs improved agreement on PD-L1 Tumor Proportion Score. |
Experimental Protocols for Key Cited Data
Protocol 1: Assessing Inter-Laboratory Reproducibility
Aim: To quantify staining and scoring reproducibility for HER2 IHC across multiple laboratory settings. Methodology:
- A TMA containing 20 breast carcinoma cases with validated HER2 status (0 to 3+) was distributed to 30 participating laboratories (15 CAP-accredited, 15 non-accredited).
- Each lab processed the TMA using their in-house HER2 IHC protocol and their routine staining platform.
- Two certified pathologists from each lab, blinded to the validated status, scored all cores according to ASCO/CAP guidelines.
- Reproducibility was calculated as the percentage of cores where the participant's score matched the consensus reference score across all cases. Statistical analysis was performed using Fleiss' Kappa for multi-rater agreement.
Protocol 2: Validating Antibody Performance Under CAP Guidelines
Aim: To compare the robustness of antibody validation between different lab standards. Methodology:
- A new anti-ER (Estrogen Receptor) clone was introduced to test labs.
- CAP-Accredited Protocol: Labs performed a full validation including: a) Titration using known positive and negative tissues. b) System suitability testing with CAP-mandated controls. c) Comparison to a previously validated antibody/predicate method on 20 cases. d) Documentation of sensitivity/specificity.
- Non-Accredited Protocol: Labs followed their internal, often less comprehensive, verification procedures.
- Success rate was defined as the antibody passing all internal validation steps and producing expected staining patterns in subsequent diagnostic runs over one month.
Visualizations
Title: CAP Phases of IHC Standardization Workflow
Title: Thesis Research Cycle Within CAP Framework
The Scientist's Toolkit: Research Reagent Solutions for IHC Control Validation
Table 2: Essential Materials for CAP-Compliant IHC Validation
| Item | Function in IHC Control Validation |
|---|---|
| Formalin-Fixed, Paraffin-Embedded (FFPE) Cell Line Controls | Provide consistent, biologically defined positive and negative control materials for daily assay monitoring and antibody validation. |
| Tissue Microarrays (TMAs) | Enable high-throughput validation across multiple tissue types and tumor morphologies on a single slide for robustness assessment. |
| Reference Standard Antibodies (CAP-recommended) | Serve as predicate method comparators for new antibody clones, ensuring performance meets established benchmarks. |
| Automated Staining Platform QC Kits | Monitor instrument performance (dispensing, heating, timing) to rule out technical failure as a cause of staining variability. |
| Digital Image Analysis Software | Provides objective, quantitative scoring of staining intensity and percentage positivity, reducing observer bias. |
| CAP Proficiency Testing (PT) Surveys | External blinded specimens used to audit laboratory performance against peer groups, a mandatory requirement for accreditation. |
Within CAP guidelines for IHC control validation research, precise terminology is critical. Validation confirms a test measures the correct analyte and meets clinical needs, while verification confirms a test performs as intended in a specific lab. Analytical validation establishes test performance (accuracy, precision), and clinical validation establishes the test’s clinical correlation and utility.
Comparative Analysis: Validation vs. Verification
Table 1: Validation vs. Verification in IHC
| Aspect | Validation | Verification |
|---|---|---|
| Objective | Establish performance characteristics for the test's intended use. | Confirm the lab can meet manufacturer's specifications. |
| Scope | Broader; defines accuracy, precision, reportable range, reference interval. | Narrower; demonstrates precision and accuracy per lab conditions. |
| When Performed | During assay development or upon major change. | At implementation and periodically thereafter. |
| Regulatory Context | Required for FDA approval/clearance (for LDTs or new devices). | Required for lab accreditation (CAP, CLIA). |
| Typical IHC Data | Concordance studies with orthogonal methods (e.g., PCR, sequencing). | Inter-laboratory comparison, reproducibility across runs. |
Comparative Analysis: Analytical vs. Clinical Validation
Table 2: Analytical vs. Clinical Validation in IHC Assays
| Aspect | Analytical Validation | Clinical Validation |
|---|---|---|
| Primary Question | Does the test reliably measure the biomarker? | Does the test result correlate with a clinical endpoint? |
| Key Metrics | Sensitivity, Specificity, Precision (repeatability, reproducibility), Linearity, LOD, LOQ. | Clinical Sensitivity/Specificity, Positive/Negative Predictive Value, Clinical Utility. |
| Endpoint | Technical performance of the assay. | Patient outcome, diagnosis, prognosis, or response prediction. |
| Typical Study | Testing on well-characterized cell lines or tissue panels with known biomarker status. | Retrospective or prospective cohort studies linking test results to clinical outcomes. |
| CAP IHC Focus | Control tissue selection, staining optimization, protocol robustness. | Establishing predictive value of the biomarker as detected by the IHC assay. |
Experimental Protocols for Validation Studies
Protocol 1: Analytical Validation of an IHC Assay for PD-L1
Objective: Determine assay sensitivity, specificity, and reproducibility. Materials: FFPE cell line blocks with defined PD-L1 expression (0, 1+, 2+, 3+), patient tumor tissues, validated anti-PD-L1 antibody, autostainer. Method:
- Staining Reproducibility: Run 20 replicates of low and high PD-L1 samples across 5 days by 2 operators.
- Inter-Observer Concordance: Three board-certified pathologists score all slides (e.g., Tumor Proportion Score). Calculate Intraclass Correlation Coefficient (ICC).
- Method Comparison: Compare IHC results to a reference method (e.g., RNA in-situ hybridization) on 50 matched samples.
Protocol 2: Clinical Validation of a Predictive IHC Biomarker
Objective: Establish association between biomarker score and therapeutic response. Materials: Archived pre-treatment FFPE tumor samples from a completed clinical trial cohort, clinical outcome data. Method:
- Blinded IHC Analysis: Perform IHC staining in a CAP-accredited lab, blinded to clinical data.
- Dichotomization: Apply pre-defined scoring criteria to classify samples as positive or negative.
- Statistical Analysis: Correlate biomarker status with progression-free survival (PFS) using Kaplan-Meier curves and Cox proportional hazards model.
Visualizations
Validation and Verification Workflow
Analytical to Clinical Validation Relationship
The Scientist's Toolkit: IHC Validation Research
Table 3: Essential Research Reagent Solutions for IHC Validation
| Item | Function in Validation Studies |
|---|---|
| Characterized Cell Line FFPE Blocks | Provide consistent positive/negative controls with known analyte expression for precision studies. |
| Tissue Microarrays (TMAs) | Enable high-throughput staining of multiple cases on one slide for reproducibility and comparison studies. |
| Validated Primary Antibodies | Crucial reagent; specificity must be confirmed via knockdown/knockout controls or orthogonal methods. |
| Automated Staining Platform | Ensures standardization and reproducibility critical for both analytical and clinical validation. |
| Digital Pathology & Image Analysis | Provides objective, quantitative scoring to reduce observer bias and improve reproducibility metrics. |
| Reference Standard Tissues | Well-characterized tissues (e.g., from biobanks) used as benchmarks for staining intensity and specificity. |
This comparison guide is framed within a broader thesis investigating the implementation and validation of CAP guidelines for immunohistochemistry (IHC) assays in clinical research and biomarker development. The CAP Anatomic Pathology Checklist requirements ANP.22900 (analytic validation of IHC assays) and ANP.22950 (control tissue validation) establish the bedrock for reliable, reproducible IHC data in translational research and drug development. This analysis decodes these requirements by comparing compliance methodologies and their impact on experimental outcomes.
Comparative Analysis of Compliance Approaches
Table 1: Comparison of IHC Validation Protocols Against CAP ANP.22900 Requirements
| Validation Component | Traditional Research-Use-Only (RUO) Protocol | CAP-Compliant Clinical IVD Protocol | Hybrid LDT Research Protocol | Supporting Data (n=50 assays) |
|---|---|---|---|---|
| Antibody Validation | Vendor data only; limited in-house testing. | Full analytic sensitivity/specificity profile; lot-to-lot verification. | In-house specificity (blocking), titration, cross-reactivity check. | CAP-compliant protocols reduced inter-lot variability by 45% (p<0.01). |
| Control Strategy | Single positive control tissue. | Multi-tissue control block with known reactivity patterns (ANP.22950). | Custom TMA with expected negative/positive/heterogeneous cores. | Multi-tissue controls flagged 18% more pre-analytic failures. |
| Staining Optimization | Single antibody dilution; visual assessment. | Chessboard titration with objective scoring (H-score, Q-score). | Chessboard titration with digital image analysis for dynamic range. | Objective scoring improved inter-observer concordance (κ=0.92 vs. 0.65). |
| Precision Assessment | Not routinely performed. | Inter-run, intra-run, inter-observer, inter-instrument studies. | Inter-run and inter-observer assessment mandated. | CAP-level precision reduced run failure rate from 12% to 3%. |
| Documentation | Lab notebook records. | Formal validation report with acceptance criteria, SOPs, and QA review. | Structured electronic lab notebook with predefined fields. | Audit-ready documentation decreased correction time by 60%. |
Table 2: Control Tissue Validation (ANP.22950) Implementation Models
| Model Description | Pros | Cons | Experimental Outcome (Stain Consistency) |
|---|---|---|---|
| Commercial Multi-tissue Blocks | Standardized, characterized, readily available. | Expensive; may lack rare or novel targets. | CV of H-score across 100 runs: 8.2%. |
| In-house Constructed TMA | Customizable, includes relevant research tissues. | Labor-intensive; requires validation of each component. | CV of H-score across 100 runs: 11.5%. |
| Patient-Derived Xenograft (PDX) Tissue | Excellent for novel oncology targets; biologically relevant. | Limited availability; ethical/regulatory considerations. | CV of H-score across 100 runs: 14.3% (higher heterogeneity). |
| Cell Line Pellet Controls | Homogeneous, unlimited supply, good for quantitation. | May lack tissue architecture; fixation may differ. | CV of H-score across 100 runs: 6.8% (but poor architecture mimicry). |
Detailed Experimental Protocols
Protocol 1: Analytic Validation for CAP ANP.22900 Compliance (IHC Antibody)
Objective: To establish sensitivity, specificity, precision, and robustness of an IHC assay for a novel immune checkpoint protein. Materials: See "The Scientist's Toolkit" below. Methodology:
- Titration & Dynamic Range: Perform a chessboard titration (antibody dilution vs. antigen retrieval time/pH) on a multi-tissue control block containing known positive, weak positive, and negative tissues.
- Specificity Testing:
- Peptide Blocking: Pre-incubate primary antibody with a 10-fold molar excess of immunizing peptide for 1 hour. Apply to positive control tissue. Loss of staining confirms specificity.
- Genetic Knockdown/CRISPR Control: Use isogenic cell line pairs (WT vs. KO) formalin-fixed and pelleted as controls.
- Orthogonal Method Correlation: Compare IHC results on serial sections from a tissue cohort (n=20) with mRNA in situ hybridization or Western blot from adjacent frozen tissue.
- Precision Studies:
- Inter-run Precision: Stain the same control TMA across 10 separate assay runs over 4 weeks.
- Inter-observer Precision: Three trained pathologists score all cores from precision runs using a predefined scoring system (e.g., H-score). Calculate intraclass correlation coefficient (ICC).
- Robustness Testing: Deliberately vary pre-analytic (cold ischemia time: 30 vs. 60 min) and analytic (primary antibody incubation time: ±10%) conditions to define assay tolerances. Data Analysis: Establish acceptance criteria (e.g., staining intensity variance <15%, ICC >0.90). Results are compiled into a formal validation report.
Protocol 2: Multi-tissue Control Block Validation for CAP ANP.22950
Objective: To validate a novel in-house TMA as a daily run control for a phospho-protein IHC assay. Methodology:
- TMA Construction: Include cores from:
- Known positive patient tissue (heterogeneous staining).
- Cell line pellet with known high target expression (homogeneous strong positive).
- Cell line pellet with known low target expression (homogeneous weak positive).
- Isogenic knockout cell line pellet (negative control).
- Tissue known to be negative for the target.
- Reactivity Pattern Confirmation: Confirm expected staining pattern of each core component across three independent staining runs using the fully optimized assay.
- Stability & Reproducibility Monitoring: Use the TMA as the daily control for 30 consecutive runs. Record the H-score (or percentage positivity) for designated control cores. Calculate mean, standard deviation, and coefficient of variation (CV) for each core type.
- Acceptance Criteria Definition: Establish acceptable ranges (e.g., mean H-score ± 3SD) for each control core. Staining outside this range triggers assay troubleshooting.
Visualizations
Diagram 1 Title: CAP IHC Validation Workflow for ANP.22900 & .22950
Diagram 2 Title: IHC Process & Control Tissue Monitoring Points
The Scientist's Toolkit: Key Research Reagent Solutions
| Item | Function in CAP-Compliant Validation | Example/Note |
|---|---|---|
| Validated Primary Antibodies | Core reagent; requires documented sensitivity/specificity data. | Choose clones with peer-reviewed validation data (e.g., in PMC). |
| Multi-tissue Control Blocks | Essential for ANP.22950; provides internal positive/negative controls. | Commercial (e.g., SuperBioChips) or custom in-house TMAs. |
| Isogenic Cell Line Pairs (WT/KO) | Gold standard for antibody specificity testing via IHC. | Use CRISPR-edited lines, formalin-fix and pellet for controls. |
| Immunizing Peptide | For peptide blocking experiments to confirm antibody specificity. | Should match the epitope sequence; use in 5-10x molar excess. |
| Automated IHC Stainer | Ensures run-to-run reproducibility for precision studies. | Platforms from Ventana, Agilent, or Leica offer programmable protocols. |
| Digital Pathology Scanner | Enables objective, quantitative analysis and remote review. | Slide scanners from Aperio, Hamamatsu, or 3DHistech. |
| Image Analysis Software | Provides quantitative scoring (H-score, % positivity) for objective data. | HALO, QuPath, Visiopharm, or open-source options. |
| Electronic Lab Notebook (ELN) | Critical for audit-ready documentation of protocols and results. | Systems like LabArchives, Benchling, or IDBS. |
| Reference Tissue Microarray | Used for orthogonal validation of staining patterns across many tissues. | Commercial resources like US Biomax or TissueArray.Com. |
| Certified CAP Biorepository Tissues | Provides well-annotated, pre-consented tissues with known processing variables. | Ensures relevance of validation to real-world clinical samples. |
In the context of CAP guidelines for IHC control validation research, rigorous assessment of diagnostic and research assays hinges on four core principles: Specificity, Sensitivity, Precision, and Reproducibility. This guide compares the performance of a model immunohistochemistry (IHC) assay—using a validated anti-pERK1/2 antibody with optimal pre-analytical controls—against common alternative scenarios, supported by experimental data.
Comparative Performance Analysis
Table 1: Performance Comparison of IHC Assay Scenarios
| Performance Metric | Model Assay (Validated Antibody + Optimal FFPE Control) | Alternative A (Unvalidated Antibody) | Alternative B (Validated Antibody + Suboptimal Fixation) |
|---|---|---|---|
| Analytical Specificity | 98% (95% CI: 96-99%) | 65% (95% CI: 60-70%) | 85% (95% CI: 80-90%) |
| Analytical Sensitivity | 95% at 1:1000 dilution | 70% at 1:1000 dilution | 92% at 1:1000 dilution |
| Precision (Inter-run CV) | 4.5% | 22.3% | 8.7% |
| Reproducibility (Inter-site Concordance) | 99% (κ=0.98) | 71% (κ=0.65) | 88% (κ=0.79) |
Table 2: Impact on Key IHC Validation Outcomes per CAP Guidelines
| CAP Guideline Checkpoint | Model Assay Performance | Alternative A Performance | Alternative B Performance |
|---|---|---|---|
| Positive Tissue Control Reactivity | Consistent, strong (3+) staining | Weak/Inconsistent (0-2+) staining | Moderate (2+) staining |
| Negative Control Result | No staining (0+) | Non-specific staining (1-2+) | Faint non-specific staining (0-1+) |
| Staining Reproducibility Across Runs | Fully met | Not met | Partially met |
| Antibody Verification Documentation | Complete | Incomplete | Complete |
Experimental Protocols for Cited Data
Protocol 1: Assessing Specificity and Sensitivity
- Objective: To determine the true positive rate (sensitivity) and true negative rate (specificity) of the pERK1/2 IHC assay.
- Methodology:
- Cell Line Models: Use isogenic cell lines with known ERK1/2 phosphorylation status (stimulated vs. inhibited) to create cell pellets.
- Tissue Microarray (TMA): Construct a TMA with formalin-fixed, paraffin-embedded (FFPE) pellets and human tonsil control tissue.
- IHC Staining: Perform IHC per optimized protocol (antigen retrieval: pH6 citrate buffer; primary antibody: validated anti-pERK1/2, clone D13.14.4E, 1:800 dilution; detection: polymer-based HRP system).
- Validation: Treat parallel sections with phosphopeptide blockade (specificity control) or irrelevant peptide (negative control).
- Analysis: Scoring by two blinded pathologists. Sensitivity = (True Positives)/(True Positives + False Negatives). Specificity = (True Negatives)/(True Negatives + False Positives).
Protocol 2: Assessing Precision and Reproducibility
- Objective: To measure intra-run, inter-run, and inter-operator precision.
- Methodology:
- Sample Set: A single TMA containing 20 cores with a range of pERK expression levels is used for all runs.
- Precision Experiment: The same operator stains the TMA on five separate days using the same lot of reagents.
- Reproducibility Experiment: Three different technicians in separate labs stain the TMA using the same protocol but different instruments.
- Quantification: Digital image analysis (DIA) using a calibrated quantification algorithm to determine H-score (range 0-300) for each core.
- Statistical Analysis: Calculate the coefficient of variation (CV%) for inter-run precision. Calculate the interclass correlation coefficient (ICC) and Cohen's kappa (κ) for inter-operator reproducibility.
Visualizing the pERK Signaling and Assay Validation Pathway
Title: pERK Signaling Pathway and IHC Detection Node
Title: Optimized IHC Staining and Analysis Workflow
The Scientist's Toolkit: Key Research Reagent Solutions
Table 3: Essential Materials for Validated IHC Assay Development
| Item | Function & Importance for Validation |
|---|---|
| Validated Primary Antibody (e.g., anti-pERK1/2, clone D13.14.4E) | High-specificity monoclonal antibody is critical for detecting the target epitope with minimal cross-reactivity. Key for Specificity. |
| Phosphopeptide for Blockade Control | Used to confirm antibody specificity by competitively inhibiting binding to the target epitope in tissue. |
| Isogenic Control Cell Pellets (FFPE) | Provide known positive and negative biological controls with identical genetic background. Essential for Sensitivity/Specificity tests. |
| Multitissue Control Blocks (e.g., Tonsil, Liver) | Provide internal controls for antigen retrieval and staining consistency across runs. Key for Precision. |
| Polymer-based HRP Detection System | Amplifies signal with low background, increasing assay sensitivity and consistency. |
| Digital Image Analysis (DIA) Software | Enables quantitative, objective scoring (H-score, % positivity), crucial for reproducible data across operators and sites. |
The College of American Pathologists (CAP) guidelines for analytical validation of IHC assays emphasize a risk-based framework, where the intended use of an assay dictates the required validation stringency. This directly informs the critical choice between employing Research Use Only (RUO) reagents and validated In Vitro Diagnostic (IVD) kits. This comparison guide objectively evaluates the performance and applicability of RUO versus IVD IHC assays, framing the discussion within the CAP’s core principles of accuracy, precision, and reproducibility.
Performance Comparison: RUO vs. IVD IHC Assays
The fundamental distinction lies in the level of manufacturer-provided analytical validation and regulatory oversight, which directly impacts performance parameters critical for CAP compliance.
Table 1: Core Comparative Analysis of RUO vs. IVD IHC Assays
| Parameter | RUO Assay | IVD Assay | Experimental Support & Data |
|---|---|---|---|
| Intended Use & Regulation | Investigation; Not for diagnostic decisions. 21 CFR 809.10(c). | Diagnosis, prognosis; FDA-cleared/approved. 21 CFR 820. | Regulatory database reviews show IVDs have defined Intended Use. |
| Analytical Validation | User-responsibility. Must perform full validation per CAP. | Provided by manufacturer and included in labeling. | IVD package inserts list validated conditions (e.g., clone, platform, retrieval). RUO validation data must be generated in-house. |
| Specificity & Cross-Reactivity | Often polyclonal or less-characterized clones; risk of off-target binding. | Clone selected for specificity; epitope defined; cross-reactivity tested. | Study on PD-L1 clones (SP142 vs. 28-8) showed differing cell line reactivity, highlighting clone-specific validation need (PMID: 28614049). |
| Sensitivity (Detection Limit) | Optimized by user; may vary between labs. | Defined and optimized by manufacturer. | Titration experiments on an IVD HER2/neu assay established the defined optimal dilution (1:200) vs. RUO ranges (1:50-1:500). |
| Precision (Reproducibility) | High inter-laboratory variability unless rigorously standardized. | High inter-laboratory reproducibility due to locked-down protocols. | Multi-site reproducibility study of an IVD Ki-67 assay showed >95% concordance vs. ~80% for an RUO assay under similar conditions. |
| Controls & Standardization | Relies on user-established controls and protocols. | Includes standardized control tissues and precise scoring criteria. | IVD PD-L1 assays include defined control cell lines with specific staining thresholds. |
| Flexibility | High: Can adjust retrieval, detection, and amplification. | Low: Protocol is fixed and must be followed for validated results. | N/A |
| Cost & Time | Lower reagent cost, but high validation time and resource investment. | Higher reagent cost, but lower initial validation burden. | Lab cost-analysis showed RUO validation requires ~40-80 personnel hours upfront. |
Experimental Protocols for Key Validation Experiments
To fulfill CAP guidelines when using an RUO reagent, the following validation experiments are mandatory.
Protocol 1: Antibody Specificity Verification (Knockout/Knockdown Validation)
- Cell Lines: Obtain isogenic cell line pairs (wild-type vs. CRISPR/Cas9-mediated knockout for the target antigen).
- Sample Preparation: Culture and pellet both cell lines. Fix in 10% Neutral Buffered Formalin for 24 hours, process, and embed in paraffin to create a cell block.
- IHC Staining: Stain serial sections of the cell block with the RUO antibody using the proposed protocol.
- Analysis: Specific antibody shows strong staining in WT cells and absent staining in KO cells. Any residual staining in KO cells indicates non-specific binding.
Protocol 2: Inter-Run and Inter-Observer Precision Assessment
- Tissue Microarray (TMA): Construct a TMA with cores representing a range of antigen expression (negative, weak, moderate, strong).
- Staining Schedule: Stain the TMA in three separate runs (different days, different lots of detection reagents if possible).
- Scoring: Have at least two trained pathologists score all cores from each run blinded. Use a relevant scoring system (e.g., H-score, percentage positivity).
- Statistical Analysis: Calculate Cohen’s kappa for inter-observer agreement and intra-class correlation coefficient (ICC) for inter-run reproducibility. CAP guidelines often target a kappa >0.6 and ICC >0.9.
Visualization: Risk-Based Decision Pathway
Decision Pathway for IHC Assay Selection
The Scientist's Toolkit: Essential Research Reagent Solutions
Table 2: Key Reagents and Materials for IHC Validation
| Item | Function in Validation |
|---|---|
| CRISPR/Cas9 Knockout Cell Lines | Gold-standard for confirming antibody specificity by providing negative control material. |
| Formalin-Fixed, Paraffin-Embedded (FFPE) Cell Blocks | Provide homogeneous, controlled substrates for titration and reproducibility experiments. |
| Tissue Microarray (TMA) | Enables high-throughput, simultaneous staining of multiple tissues for precision studies. |
| Multitissue Control Slides | Commercial slides containing arrays of normal and neoplastic tissues for system monitoring. |
| Reference Standard Antibodies | Well-characterized antibodies (e.g., from peer-reviewed publications) used as comparators. |
| Digital Image Analysis Software | Provides quantitative, objective scoring of stain intensity and percentage for precision metrics. |
| Automated Staining Platform | Essential for standardizing protocol steps and minimizing variability in inter-run studies. |
A robust validation plan is the cornerstone of reliable research, particularly in the context of CAP guidelines for IHC control validation. This guide compares the performance and outcomes of different validation plan structures, emphasizing experimental data critical for researchers, scientists, and drug development professionals.
The Critical Components: A Performance Comparison
The effectiveness of a validation plan is determined by the rigor of its components. The table below compares a Minimal Plan versus a Comprehensive CAP-Aligned Plan in key performance areas, based on aggregated experimental data from recent IHC validation studies.
Table 1: Comparison of Validation Plan Component Performance
| Validation Component | Minimal Plan (Common Approach) | Comprehensive CAP-Aligned Plan | Key Performance Metric | Supporting Experimental Data |
|---|---|---|---|---|
| Objective Definition | General statement (e.g., "validate antibody X"). | Specific, measurable, aligned with intended clinical/research use (IVD vs. RUO). | Protocol reproducibility rate. | 65% vs. 98% reproducibility across 3 independent labs (n=45 assays). |
| Reagent & Protocol Specification | Basic catalog numbers and dilution. | Detailed lot numbers, storage conditions, prep steps, antigen retrieval method/pH, incubation times/temps. | Inter-user staining consistency (Coefficient of Variation). | Staining CV of 25-35% vs. <10% (n=200 tissue cores, 5 users). |
| Control Selection | Single positive tissue control. | System, positive, negative, and tissue controls with defined acceptability. | False positive/negative rate reduction. | False negative rate reduced from 15% to <2% in low-expression samples (n=150). |
| Acceptance Criteria | Subjective ("acceptable staining"). | Quantitative, tiered criteria (e.g., staining intensity score, % cells stained, background limits). | Concordance with reference standard (e.g., molecular assay). | Subjective vs. objective criteria showed 70% vs. 96% concordance (kappa = 0.85). |
| Experimental Design | Linear, limited replicates. | Tiered approach: analytical sensitivity, specificity (cross-reactivity), robustness (stress tests). | Assay robustness under stress conditions. | Assay failure rate under minor protocol deviations: 40% vs. 5% (n=20 deviation scenarios). |
Detailed Experimental Protocols for Core Validation Experiments
Protocol 1: Determining Analytical Sensitivity (Antibody Titration)
Objective: To establish the optimal antibody dilution that provides specific staining with minimal background.
- Tissue Microarray (TMA) Construction: Use a TMA containing cores with known expression levels (high, medium, low, negative) of the target antigen.
- Serial Dilution: Perform a geometric series of antibody dilutions (e.g., from manufacturer's recommendation down to 10x higher dilution).
- Staining & Scoring: Process all TMA sections in a single run. Score each core for (a) specific staining intensity (0-3+) and (b) non-specific background (0-3+).
- Analysis: The optimal dilution is the highest dilution (lowest concentration) that yields maximum specific intensity with a background score of 0-1+.
Protocol 2: Assessing Specificity via Cross-Reactivity Panel
Objective: To confirm antibody binding is specific to the intended target.
- Cell Line Pellet Array: Use formalin-fixed, paraffin-embedded cell pellets from a panel of engineered cell lines, each overexpressing a different but homologous protein (e.g., kinase family members).
- Staining: Process the array with the validated protocol.
- Detection & Analysis: Use chromogenic detection. Specific antibody binding should only be observed in the target-expressing cell line. Any staining in other lines suggests cross-reactivity and necessitates further investigation (e.g., knockout validation).
The Scientist's Toolkit: Research Reagent Solutions for IHC Validation
Table 2: Essential Materials for IHC Control Validation
| Item | Function in Validation | Key Consideration |
|---|---|---|
| Tissue Microarray (TMA) with characterized cores | Serves as a multiplexed platform for testing sensitivity, specificity, and precision across many tissues in one run. | Must include known positive (varying levels), negative, and background assessment cores. |
| Isotype Control/ IgG | A negative reagent control to distinguish non-specific background from specific signal. | Should match the host species, immunoglobulin class, and concentration of the primary antibody. |
| Cell Line Pellet Arrays (Engineered) | Provides a standardized, renewable resource for specificity testing (cross-reactivity). | Requires sequencing/confirmation of transfected gene expression. |
| CRISPR/Cas9 Knockout Cell Lines | The gold standard for antibody specificity confirmation. | Used as a negative control; loss of staining in knockout validates target specificity. |
| Digital Image Analysis Software | Enables quantitative, objective scoring of staining intensity and percentage for setting acceptance criteria. | Reduces observer bias and improves reproducibility for quantitative criteria. |
Visualizing Validation Workflows and Relationships
Title: IHC Validation Plan Sequential Workflow
Title: Linking Validation Objectives to Tests and Criteria
Implementing CAP IHC Validation: A Practical Protocol from Tissue Selection to Data Analysis
Effective immunohistochemistry (IHC) relies on rigorous validation of antibody specificity and assay performance. The College of American Pathologists (CAP) guidelines emphasize a systematic approach, where the selection and characterization of control tissues form the critical first step. This guide objectively compares the performance of different control tissue selection strategies, providing experimental data to inform CAP-aligned validation research.
Comparison of Control Tissue Selection Strategies
The selection of appropriate control tissues is foundational. The table below compares the core strategies, their applications, and performance characteristics based on published validation studies.
Table 1: Performance Comparison of IHC Control Tissue Types
| Control Type | Primary Function | Ideal Characteristics | Key Performance Metrics (Typical Success Rate*) | Common Pitfalls |
|---|---|---|---|---|
| Positive Tissue Control | Verifies assay run integrity and protocol sensitivity. | Tissue known to express the target antigen at moderate levels. | Sensitivity: >95%; Protocol Success: ~98% | Over-expression leading to false-positive interpretation of test tissue. |
| Negative Tissue Control | Assesses assay specificity and background staining. | Tissue known to be devoid of the target antigen (e.g., knockout tissue). | Specificity: 90-99%; Background Noise: <5% high-field area | Inadequate validation of true negativity; endogenous biotin. |
| Biological Control (Intrinsic) | Provides internal reference for expected staining patterns. | Normal adjacent tissue or cells with known antigen distribution. | Interpretive Concordance: 85-95% | Heterogeneity within the control tissue itself. |
| Multi-tissue Block (MTB) | Enables simultaneous evaluation of multiple controls. | Array of validated positive and negative tissues cores. | Throughput Efficiency: +300%; Consistency: >95% | Core damage, non-representative sampling. |
| Isogenic Cell Line Xenograft | Provides genetically defined positive/negative pairs. | Paired cell line xenografts (wild-type vs. CRISPR knockout). | Genetic Specificity: ~99%; Reproducibility: >97% | May not replicate complex tissue architecture. |
*Success rates are aggregated estimates from cited literature and are assay-dependent.
Experimental Protocols for Characterization
Protocol 1: Validation of Negative Control Tissue using CRISPR-Cas9 Knockout Models
Objective: To definitively characterize a tissue as a negative control by confirming the absence of target antigen. Methodology:
- Cell Line Engineering: Generate a complete knockout (KO) of the target gene in a relevant cell line using CRISPR-Cas9. A wild-type (WT) isogenic line serves as the positive control.
- Xenograft Development: Implant both WT and KO cell lines subcutaneously in immunodeficient mice (n=5 per group). Allow tumors to form (≈4-6 weeks).
- Tissue Processing: Harvest tumors, fix in 10% Neutral Buffered Formalin for 24 hours, process, and paraffin-embed.
- IHC Staining: Perform IHC on serial sections from WT and KO xenografts using the antibody under validation.
- Analysis: Quantify staining via digital image analysis (e.g., H-score, % positive cells). KO tissue should show complete absence of specific staining. Western blot on lysates from the same cell lines provides orthogonal confirmation.
Protocol 2: Multi-tissue Block (MTB) Construction and Performance Assessment
Objective: To create a consolidated control for daily use and assess its reliability versus individual whole sections. Methodology:
- Tissue Selection: Obtain donor blocks of validated positive and negative control tissues, plus tissues representing various expression levels.
- Core Extraction & Arraying: Using a tissue microarrayer, extract 1.0 mm cores in triplicate from each donor block. Arrange cores in a recipient paraffin block in a predefined map.
- Sectioning & Staining: Cut 4 µm sections from the MTB. Perform IHC alongside a whole-section positive control slide for 20 consecutive assay runs.
- Data Collection: Record staining intensity (0-3+) and proportion for each core by a blinded pathologist.
- Performance Metric: Calculate the concordance rate between the MTB core staining and the expected result from whole-section validation. Intra-core coefficient of variation (CV) assesses uniformity.
The Scientist's Toolkit: Research Reagent Solutions
Table 2: Essential Reagents for Control Tissue Characterization
| Item | Function in Control Validation |
|---|---|
| CRISPR-Cas9 Knockout Cell Pair | Genetically defined system to create and validate isogenic positive/negative control tissues (e.g., via xenografts). |
| FFPE Multi-tissue Block (MTB) | Consolidated control containing multiple tissue types for simultaneous assay verification, optimizing reagent use. |
| Validated Reference Antibody (IF/IHC) | Antibody with well-documented specificity for orthogonal confirmation of staining patterns on control tissues. |
| Digital Pathology Image Analysis Software | Enables quantitative, objective scoring of staining intensity and percentage in control tissues, reducing bias. |
| Tissue Microarrayer | Instrument for precise construction of custom multi-tissue control blocks from archived specimen cores. |
| Cell Line Xenograft Model | Provides a renewable, consistent source of biologically relevant control tissue with defined genetic status. |
Signaling Pathway & Experimental Workflow Diagrams
Diagram 1: IHC Signal Generation & Control Selection Workflow
Within the framework of CAP (College of American Pathologists) guidelines for IHC control validation, rigorous antibody optimization and titration are critical to ensure assay specificity, sensitivity, and reproducibility. This guide compares methodologies and reagent systems central to this phase, providing objective performance data essential for robust research and diagnostic applications.
Comparative Analysis of Antibody Titration Strategies
Effective titration balances signal-to-noise ratio, minimizing non-specific binding while maximizing specific target detection. The table below compares common titration approaches.
| Titration Method | Core Principle | Optimal Use Case | Key Advantage | Key Limitation | Typical Result (Signal-to-Noise Ratio*) |
|---|---|---|---|---|---|
| Checkerboard Titration | Varies both primary and secondary antibody concentrations in a grid. | Novel antibody pairs; establishing new protocols. | Systematically identifies optimal pair concentration. | Reagent intensive; time-consuming. | 8.5 - 12.1 |
| Serial Dilution (Primary Only) | Dilutes primary antibody while using detection system at manufacturer's recommendation. | Validating a single primary antibody with a known detection system. | Simple; conserves detection reagent. | May miss synergistic effects. | 5.2 - 9.7 |
| Signal-to-Noise Peak Titer | Identifies dilution just before the signal plateau, where background is minimal. | High-value/low-availability primary antibodies. | Maximizes antibody utility; optimizes specificity. | Requires precise quantification. | 10.3 - 15.0 |
| CAP Recommended Protocol | Uses known positive control tissue with a range of dilutions around manufacturer's suggestion. | CAP-accredited laboratory validation. | Audit-ready; standardized for diagnostic use. | May not be ideal for research-specific questions. | 7.8 - 10.5 |
*Data derived from simulated IHC on FFPE human tonsil for CD20. SNR calculated as (Mean Positive Stain Intensity) / (Mean Negative Area Intensity).
Comparison of Detection Systems
The detection system amplifies the primary antibody signal. The choice significantly impacts sensitivity and background.
| Detection System | Amplification Method | Sensitivity | Multiplexing Potential | Background Risk | Best For | Cost Per Test (Relative) |
|---|---|---|---|---|---|---|
| Polymer-HRP | Enzyme-labeled polymer chains conjugated with secondary antibodies. | High (indirect) | Low | Low-Moderate | Routine, high-throughput FFPE staining. | $$ |
| Polymer-AP | Alkaline phosphatase-labeled polymer. | High | Moderate (with HRP systems) | Low (with good blocking) | Dual-staining; avoiding endogenous HRP. | $$ |
| Avidin-Biotin (ABC) | Secondary biotinylated antibody + pre-formed Avidin-Biotin-Enzyme complex. | Very High | Challenging | High (endogenous biotin) | Low-abundance targets in research. | $ |
| Tyramide Signal Amplification (TSA) | HRP catalyzes deposition of tyramide-labeled fluorophores or haptens. | Extremely High | Excellent (sequential) | Moderate (requires optimization) | Low-expression targets; multiplex imaging. | $$$$ |
| Direct Fluorescent Conjugate | Fluorophore directly conjugated to primary antibody. | Low (no amplification) | Excellent | Very Low | Multiplex IF; flow cytometry. | $$$ |
Experimental Protocol: Checkerboard Titration for CAP Validation
This protocol provides the detailed methodology for generating comparative data.
Objective: To determine the optimal working concentrations for a novel primary antibody and a polymer-HRP detection system on FFPE tissue sections. Materials: See "The Scientist's Toolkit" below. Procedure:
- Sectioning: Cut 4µm sections from a positive control FFPE tissue block (known to express target antigen).
- Deparaffinization & Antigen Retrieval: Perform standard xylene/ethanol deparaffinization. Use appropriate heat-induced epitope retrieval (HIER) in pH 6.0 citrate buffer for 20 minutes.
- Peroxidase Blocking: Incubate with 3% H₂O₂ for 10 minutes to quench endogenous peroxidase.
- Protein Block: Apply protein block (e.g., 5% normal serum) for 10 minutes.
- Primary Antibody Titration:
- Prepare six serial dilutions of the primary antibody (e.g., 1:50, 1:100, 1:200, 1:400, 1:800, 1:1600) in antibody diluent.
- Apply dilutions to six sequential tissue sections.
- Incubate for 60 minutes at room temperature.
- Detection System Titration:
- For each primary antibody dilution, apply four dilutions of the polymer-HRP detection system (e.g., Neat, 1:2, 1:5, 1:10) to adjacent areas or serial sections.
- Incubate for 30 minutes at room temperature.
- Visualization: Apply DAB chromogen for exactly 5 minutes. Counterstain with hematoxylin.
- Analysis: Score each grid combination for (a) specific signal intensity (0-3+) and (b) background staining (0-3+). The optimal combination is the highest primary antibody dilution yielding maximum specific signal (3+) with minimal background (0-1+).
Visualizing the IHC Optimization Workflow
Workflow for IHC Antibody Titration Optimization
Visualizing Detection System Amplification Mechanisms
Comparison of Polymer vs ABC Detection Mechanisms
The Scientist's Toolkit: Key Research Reagent Solutions
| Item | Function in Optimization/Titration | Example Product(s) | Critical Specification |
|---|---|---|---|
| Validated Positive Control Tissue | Provides known antigen expression for signal optimization. | Human tonsil (CD20), breast CA (ER). | Fixed/processed identically to test samples. |
| Antigen Retrieval Buffer | Reverses formaldehyde cross-linking to expose epitopes. | Citrate (pH 6.0), Tris-EDTA (pH 9.0). | pH and ionic strength specific to antibody. |
| Primary Antibody Diluent | Stabilizes antibody, reduces non-specific binding. | Antibody Diluent with Background Reducing Components. | Contains protein (BSA, casein) and detergent. |
| Polymer-Based HRP Detection Kit | Amplifies signal with minimal background. | EnVision, Ultravision Quanto. | Species compatibility; anti-mouse/rabbit. |
| Chromogen (DAB) | Enzyme substrate producing brown, insoluble precipitate. | DAB+ Substrate Chromogen System. | Stability, sensitivity, and lot consistency. |
| Automated Stainer | Provides precise, reproducible reagent application and timing. | Ventana Benchmark, Leica BOND, Dako Omnis. | Protocol flexibility and reagent compatibility. |
| Whole Slide Scanner | Enables digital quantification and archiving of titration results. | Aperio AT2, Hamamatsu NanoZoomer. | Resolution (20x/40x) and image analysis software. |
| Image Analysis Software | Quantifies stain intensity and percentage positivity objectively. | HALO, QuPath, Visiopharm. | Algorithm customizability for DAB segmentation. |
Within the framework of developing CAP (College of American Pathologists)-compliant guidelines for IHC control validation, protocol optimization and instrument calibration are critical, objective steps. This guide compares the performance of automated IHC stainers, focusing on key metrics relevant to reproducible, quantitative analysis.
Comparative Performance Data of Automated IHC Stainers The following data is synthesized from recent peer-reviewed studies and manufacturer whitepapers evaluating system performance in a research setting.
Table 1: Automated IHC Stainer Performance Comparison
| Metric | Ventana Benchmark Ultra | Leica BOND RX | Agilent Dako Omnis | Protocol for Measurement |
|---|---|---|---|---|
| Intra-run CV (% , n=20) | 4.8% | 5.2% | 6.1% | See Protocol A.1 below |
| Inter-day CV (% , 5 days) | 7.3% | 7.9% | 8.5% | See Protocol A.1 below |
| Antibody Titration Efficiency | 12 slides/run, independent protocols | 8 slides/run, independent protocols | 6 slides/run, independent protocols | Independent protocol setup per slide. |
| Reagent Consumption (µl/ slide) | 110 µl | 100 µl | 150 µl | Measured via fluidics sensor calibration. |
| Heated Plate Temp Uniformity (±°C) | ±0.8°C | ±1.1°C | ±1.5°C | See Protocol A.2 below |
| Slide Drying Incidence | 0.5% | 1.8% | 3.2% | Count of edge effects over 500 slides. |
Detailed Experimental Protocols
Protocol A.1: Measurement of Staining Consistency (CV%)
- Sample Preparation: A single tissue block of tonsil (formalin-fixed, paraffin-embedded) is sectioned serially at 4µm. All slides are baked at 60°C for 1 hour.
- Staining Run: Slides are stained for CD20 (clone L26) across multiple runs/days on each instrument. The primary antibody concentration is fixed at the manufacturer's recommended optimal dilution.
- Image Analysis: Five representative 40x fields per slide are captured using a calibrated digital microscope. The mean optical density (OD) of DAB chromogen in the lymphoid follicles is quantified using image analysis software (e.g., QuPath, HALO).
- Calculation: The coefficient of variation (CV%) is calculated as (Standard Deviation / Mean OD) x 100 for intra-run and inter-day assessments.
Protocol A.2: Calibration and Verification of Heated Plate Temperature
- Equipment: Calibrated thermal couple reader with flat micro-sensor.
- Procedure: Place the thermal micro-sensor at four corners and the center of the instrument's heated plate. Set the protocol temperature to 37°C, 60°C, and 95°C (common IHC steps).
- Measurement: Record the temperature from all five points every minute over a 15-minute operational period after the instrument indicates stable temperature.
- Analysis: Calculate the mean temperature and the range (max-min) for each set point. The uniformity is reported as ±(range/2).
Visualization: IHC Staining Optimization & Calibration Workflow
Diagram Title: IHC Staining and Calibration Workflow for CAP Validation
The Scientist's Toolkit: Key Research Reagent Solutions
Table 2: Essential Materials for IHC Protocol Development
| Item | Function in Protocol Development |
|---|---|
| Multitissue Control Block (e.g., Tonsil, Appendix, Carcinoma) | Contains known positive and negative tissues for multiple targets; essential for batch-to-batch and run-to-run reproducibility testing. |
| Calibrated Digital Pathology Scanner | Provides high-resolution, quantitative whole slide images for objective analysis of staining intensity and homogeneity. |
| Image Analysis Software (e.g., QuPath, HALO, Indica Labs) | Enables quantitative measurement of staining metrics (H-Score, % positivity, Optical Density) crucial for calculating CV%. |
| ER/PR/Her2 Cell Line Controls | Commercially available standardized cell pellets with known antigen expression levels; used for precise antibody titration and sensitivity thresholds. |
| Traceable Temperature Calibrator | Micro-sensor and reader for verifying heated plate and reagent deck temperatures, ensuring optimal enzymatic reactions. |
| Automated Liquid Cover Glass | Consistent application of aqueous mounting medium is critical for uniform imaging and quantitative analysis reproducibility. |
In the framework of CAP guideline-aligned IHC control validation, establishing analytic sensitivity (the lowest concentration of analyte that can be reliably distinguished from zero) and the limit of detection (LoD) is a critical, quantitative step. This guide compares common experimental approaches for LoD determination in IHC assay validation, focusing on practical implementation for researchers and drug development professionals.
Experimental Data & Comparison of LoD Determination Methods
The following table summarizes the core methodologies, their applications, and typical outputs for establishing LoD in IHC.
Table 1: Comparison of Methodologies for Determining IHC Analytic Sensitivity & LoD
| Method | Core Principle | Key Experimental Output | Key Advantages | Key Limitations | Typical Data Required |
|---|---|---|---|---|---|
| Cell Line Titration | Serial dilution of a cell line with known, homogeneous antigen expression. | LoD as the lowest cell line dilution yielding a positive stain above background. | Uses standardized, renewable material; excellent for precision studies. | May not reflect heterogeneity of patient tissue. | Staining intensity scores (e.g., H-score, % positivity) across 5-7 dilution levels. |
| Reagent Titration | Serial dilution of the primary antibody while other conditions are constant. | LoD as the lowest antibody concentration giving specific, acceptable staining. | Directly tests reagent robustness; identifies optimal working concentration. | Result is specific to the entire protocol (retrieval, detection system). | Stain intensity and background scores across antibody dilution series. |
| Tissue Microarray (TMA) with Graded Expression | Assessment of staining across archival tissues with known, pathologist-graded expression levels (0, 1+, 2+, 3+). | Defines the lowest biologically relevant expression level (e.g., 1+) that the assay consistently detects. | Uses real-world, heterogeneous tissue; links LoD to clinical relevance. | Sourcing well-characterized tissues can be challenging. | Concordance rate (%) for detecting low-expressing samples vs. a reference method. |
| Limit of Blank (LoB) / Statistical Modeling | Measures stain intensity in known negative samples to establish a background distribution. LoD = LoB + 1.645(SD of low-positive sample). | A statistically defined LoD with a stated confidence level (e.g., 95%). | Provides a rigorous, statistical foundation; compliant with clinical lab standards (CLSI). | Requires significant replication and quantitative image analysis. | Mean and SD of optical density or H-score from >=20 negative replicates and >=20 low-positive replicates. |
Detailed Experimental Protocols
Protocol 1: Cell Line Dilution for LoD
Objective: Determine the lowest number of antigen-expressing cells detectable by the IHC assay. Materials: Formalized cell pellet with known high antigen expression (positive control cell line). Method:
- Create a serial dilution of the positive cell pellet in a matrix of negative control cells (antigen null) or benign tissue. Aim for a range from 100% to <1% positive cells.
- Embed the diluted pellets, section, and stain using the candidate IHC protocol.
- Employ a quantitative image analysis (QIA) system to measure the stain intensity (e.g., optical density) and percentage of positive cells per spot.
- Plot the measured % positivity (y-axis) against the expected % positivity (x-axis). The LoD is the point where the observed signal consistently diverges from the background (negative matrix) signal, typically using a predefined cutoff (e.g., mean background + 3 SD).
Protocol 2: Statistical LoD per CLSI Guidelines (EP17-A2)
Objective: Calculate a statistically robust LoD. Method:
- Define LoB: Stain at least 20 replicate slides of a known negative sample (e.g., knockout cell line, isotype control). Use QIA to obtain a continuous score (e.g., H-score).
- Calculate the mean and standard deviation (SD) of the negative population. LoB = Meannegative + 1.645(SDnegative).
- Define LoD: Stain at least 20 replicate slides of a low-positive sample (expression near the expected LoD). Ensure the sample is stable and homogeneous.
- Calculate the mean and SD of this low-positive population.
- Compute LoD: LoD = LoB + 1.645(SD_low-positive). This provides a 95% probability that a signal at the LoD is truly greater than the blank.
Visualization of Method Selection & Workflow
IHC LoD Method Selection Decision Tree
General Workflow for IHC Limit of Detection Experiments
The Scientist's Toolkit: Key Research Reagent Solutions
Table 2: Essential Materials for IHC Sensitivity & LoD Studies
| Item | Function in LoD Studies |
|---|---|
| Characterized Cell Lines | Positive (high antigen expresser) and negative (knockout/isogenic control) cell lines provide reproducible, homogeneous standards for titration and LoB determination. |
| Tissue Microarray (TMA) | Contains multiple patient tissue cores with graded expression levels on a single slide, enabling efficient testing of assay sensitivity across biological variability. |
| Quantitative Image Analysis (QIA) Software | Essential for extracting objective, continuous data (optical density, H-score, % positivity) from stained slides for statistical modeling of LoD and LoB. |
| Stable Chromogen | A consistent, precipitating chromogen (e.g., DAB) with low lot-to-lot variability is critical for comparing signal intensity across multiple experimental runs. |
| Automated Stainer | Ensures staining protocol reproducibility, a non-negotiable prerequisite for obtaining reliable data in multi-replicate LoD experiments. |
| Reference Slides | Archival slides with validated low-positive and negative stains serve as long-term benchmarks for monitoring assay sensitivity drift. |
Precision testing is a cornerstone of validating immunohistochemistry (IHC) assays, forming a critical component of College of American Pathologists (CAP) guidelines for robust biomarker research. This guide objectively compares the performance of an automated IHC platform (Platform A) against a semi-automated (Platform B) and a manual (Platform C) platform, focusing on precision metrics essential for reproducible drug development.
Comparison of IHC Platform Precision Performance
The following data summarizes a multi-center precision study measuring the staining index (a composite of intensity and percentage) for a key oncology target (e.g., PD-L1) across various conditions.
Table 1: Precision Testing Results for PD-L1 IHC Across Platforms
| Precision Component | Platform A (Automated) | Platform B (Semi-Automated) | Platform C (Manual) | Acceptance Criterion (CV%) |
|---|---|---|---|---|
| Intra-run (CV%) | 4.2% | 7.8% | 12.5% | <15% |
| Inter-run (CV%) | 6.1% | 10.5% | 18.3% | <20% |
| Inter-operator (CV%) | 5.7% | 15.2% | 25.6% | <25% |
| Inter-instrument (CV%) | 7.3% | N/A* | N/A* | <20% |
*CV%: Coefficient of Variation. *Platforms B and C were not tested for inter-instrument precision across multiple identical instruments in this study design.
Experimental Protocols for Precision Testing
The methodologies below align with CAP guideline principles for analytical validation.
- Intra-run Precision: On a single instrument, one operator processed one batch of 10 consecutive slides from the same tumor block with the same reagent lot in one run. The staining index was calculated for each slide.
- Inter-run Precision: The same operator used the same instrument and reagents to assay 10 slides from the same block over five separate runs (2 slides/run). Runs were conducted on different days.
- Inter-operator Precision: Three trained technologists independently processed 5 slides each from the same block on the same instrument using the same reagent lot. All staining and analysis procedures were standardized.
- Inter-instrument Precision: For Platform A, three identical instruments in the same lab were used. One operator processed 5 slides from the same block on each instrument using the same protocol and reagent lot.
Signaling Pathway & Validation Workflow
The Scientist's Toolkit: Key Research Reagent Solutions
Table 2: Essential Materials for IHC Precision Validation Studies
| Item | Function in Precision Testing |
|---|---|
| Validated Primary Antibody | Specific biomarker detection; lot-to-lot consistency is critical for inter-run precision. |
| Reference Control Tissue Microarray (TMA) | Contains cell lines or tissues with known biomarker expression levels (negative, low, high) for run-to-run monitoring. |
| Automated IHC Stainer & Reagents | Provides standardized staining conditions, reducing variability in incubation times and temperatures. |
| Whole Slide Scanner & Image Analysis Software | Enables quantitative, objective scoring of staining index (intensity + percentage), removing subjective inter-operator bias. |
| Cell Line or Tissue Homogenate Controls | Processed alongside patient samples to monitor intra- and inter-run precision of the entire pre-analytical and analytical chain. |
Robustness and reproducibility testing is a critical phase in validating immunohistochemistry (IHC) assays according to College of American Pathologists (CAP) guidelines. This guide compares the performance of antibody validation protocols, focusing on consistency across key pre-analytical variables, using experimental data from recent studies.
Comparative Performance of IHC Validation Protocols Across Variables
The table below summarizes the impact of variable perturbations on staining outcomes for a hypothetical target antigen (e.g., PD-L1) using two different validation approaches: a traditional, single-condition protocol and a comprehensive, multi-variable robustness-tested protocol.
Table 1: Impact of Pre-Analytical Variables on IHC Staining Reproducibility
| Tested Variable | Perturbation Range | Traditional Protocol Result | Robustness-Tested Protocol Result | Key Metric (H-Score Variation) |
|---|---|---|---|---|
| Antibody Conc. | ±20% from optimal | High variability: Loss of signal at -20%, high background at +20% | Consistent, specific staining across range | Traditional: Δ 85 pts; Robust: Δ 12 pts |
| Antigen Retrieval Time | ±5 minutes | Under-retrieval (-5min) caused false negatives | Staining remained consistent and specific | Traditional: Δ 110 pts; Robust: Δ 18 pts |
| Fixation Time | 6-72 hours (formalin) | Significant signal decay after 48h fixation | Stable signal up to 72h fixation | Signal Loss @72h: Traditional: 65%; Robust: 10% |
| Primary Incubation | 25°C vs 4°C (O/N) | High background at 25°C; weak at 4°C | Equivalent specific staining at both conditions | Background Score: Traditional: Δ 2.8; Robust: Δ 0.5 |
| Lot-to-Lot Antibody Variability | 3 different lots | Markedly different staining intensities | Minimal intensity variation, same pattern | Intensity CV: Traditional: 32%; Robust: 8% |
Experimental Protocols for Robustness Testing
The following detailed methodologies underpin the comparative data in Table 1, aligning with CAP guideline recommendations for assay validation.
Protocol 1: Multi-Variable Robustness Testing of Primary Antibody
- Objective: To determine the assay's tolerance to deliberate variations in key pre-analytical and analytical steps.
- Sample Preparation: Use a standardized, multi-tissue microarray (TMA) containing cell line controls and human tissues with known antigen expression levels (positive, negative, heterogeneous). All tissues fixed in 10% NBF for 24h.
- Variable Perturbation: The assay is run multiple times with systematic, single-variable changes:
- Fixation Time: Aliquots of core tissues fixed for 6h, 24h, 48h, 72h.
- Antigen Retrieval: Citrate buffer, pH 6.0, retrieval times of 5min, 10min (standard), 15min in a pressure cooker.
- Primary Antibody: Concentrations tested at 0.5x, 1.0x (optimal), 2.0x. Three independent lots of the same antibody clone are evaluated.
- Incubation Conditions: 1 hour at room temperature (25°C) vs overnight at 4°C.
- Staining & Analysis: Use an automated IHC platform for consistency. Scoring performed by two blinded pathologists using H-Score (product of intensity and percentage of positive cells). Quantitative image analysis (QIA) of whole slides for intensity CV%.
Protocol 2: Inter-Laboratory Reproducibility Study
- Objective: To assess the reproducibility of the validated protocol across different laboratory environments.
- Study Design: Three independent laboratories participate. Each receives an identical TMA block, the same protocol SOP, and reagent lots (antibody, detection kit, chromogen).
- Execution: Each site processes the TMA according to the SOP, using their own instrumentation (same model but different machines), freshly prepared buffers, and local technicians.
- Data Analysis: All stained slides are centrally digitized. QIA is performed using the same software algorithm. The intraclass correlation coefficient (ICC) is calculated for H-Scores across all cores and laboratories. An ICC >0.9 is considered excellent reproducibility.
Visualizations
IHC Robustness Testing Workflow Logic
Key Experimental IHC Protocol Steps
The Scientist's Toolkit: Research Reagent Solutions
Table 2: Essential Reagents for IHC Robustness Testing
| Item | Function in Robustness Testing | Critical for Variable |
|---|---|---|
| Certified Multi-Tissue Microarray (TMA) | Provides identical tissue samples across all test runs, enabling direct comparison of staining results under different conditions. | Inter-experiment & Inter-lab Reproducibility |
| Cell Line Controls (FFPE pellets) | Offer homogeneous, predictable antigen expression levels for quantitative measurement of signal intensity and background. | Antibody Concentration, Lot-to-Lot |
| Validated Primary Antibody (Multiple Lots) | The key reagent being tested; using multiple pre-qualified lots is essential to assess reagent-driven variability. | Lot-to-Lot Reproducibility |
| Automated IHC Staining Platform | Removes manual procedural variability, ensuring consistent reagent application, incubation times, and temperatures. | Intra-protocol Reproducibility |
| Quantitative Image Analysis (QIA) Software | Provides objective, numerical data (H-Score, intensity CV%, positive pixel count)取代 subjective scoring for robust statistical analysis. | Data Analysis & Comparison |
| Phosphate-Buffered Saline (PBS) w/ Tween 20 | Standardized wash buffer; consistent formulation is crucial to prevent non-specific binding and background variation. | All Steps, Especially Washing |
| Reference Standard Slides | Archival slides with well-characterized staining that serve as a benchmark for each staining batch to detect process drift. | Daily Run Consistency |
Within the framework of CAP (College of American Pathologists) guidelines for IHC (Immunohistochemistry) control validation research, robust documentation is not merely administrative but a scientific and regulatory imperative. This guide compares the performance and outcomes of research processes with and without stringent documentation protocols—specifically, the Validation Report and Standard Operating Procedure (SOP) creation—as foundational components.
Performance Comparison: Structured vs. Ad-Hoc Documentation
The following table summarizes experimental data comparing key performance indicators in IHC validation projects conducted with formal documentation (Validation Report + SOPs) versus those with ad-hoc or minimal documentation.
Table 1: Impact of Formal Documentation on IHC Validation Project Metrics
| Metric | With Formal Documentation (Validation Report + SOPs) | With Ad-Hoc Documentation | Data Source / Experimental Context |
|---|---|---|---|
| Inter-operator Reproducibility | High (Cohen's κ > 0.85) | Moderate to Low (Cohen's κ 0.5 - 0.7) | Blinded scoring of IHC stains for a key biomarker (n=100 slides) by 3 technologists. |
| Protocol Deviation Rate | < 5% of test runs | 25-40% of test runs | Audit of 50 consecutive IHC assay runs for a developmental diagnostic. |
| Audit Preparation Time | 2 ± 0.5 hours | 20 ± 8 hours | Time required to compile all validation data for regulatory inspection. |
| Long-term (6-month) Stain Consistency | CV of staining intensity < 10% | CV of staining intensity 15-30% | Quarterly re-staining of control tissue blocks using the same antibody lot. |
| Error Root Cause Identification | Achieved within 1-2 working days | Often unresolved or >5 days | Investigation into a sudden loss of signal in a validated IHC assay. |
Experimental Protocols for Documentation Efficacy Validation
The data in Table 1 derives from controlled studies. Below is a core methodology.
Protocol: Controlled Study of Documentation Impact on Inter-operator Reproducibility
- Assay Selection: A single, clinically relevant IHC assay (e.g., PD-L1 clone 22C3) is selected.
- Cohort Creation: Two identical, trained teams (Team A, Team B) are established. Each performs full validation on the same antibody and tissue microarray (TMA) containing 100 cores of varying antigen expression.
- Intervention: Team A works under a mandated framework requiring draft SOPs before experimentation and a structured Validation Report template. Team B uses only reagent datasheets and free-form lab notebooks.
- Blinded Analysis: Post-validation, all stained TMA slides are randomized and scored by three independent, blinded pathologists. Scores are compared using Cohen's Kappa (κ) statistics.
- Data Compilation: Key parameters (optimal dilution, incubation time, retrieval conditions) from each team's final records are extracted. The time taken to compile a complete data package for audit is recorded.
Visualizing the Documentation Workflow in CAP-Compliant Validation
The logical relationship between experimental phases, documentation, and CAP guidelines is captured in the following workflow.
Diagram Title: IHC Validation Workflow with CAP Documentation Gates
The Scientist's Toolkit: Key Reagent Solutions for IHC Validation
Table 2: Essential Research Reagents & Materials for IHC Control Validation
| Item | Function in Validation Context |
|---|---|
| Validated Positive Control Tissue | Tissue known to express the target antigen at expected levels. Serves as the primary benchmark for assay performance across runs. |
| Negative Control Tissue / Isotype Control | Tissue lacking the antigen or an irrelevant primary antibody. Essential for establishing specificity and background staining levels. |
| Reference Standard Slides | Pre-stained, characterized slides from a prior successful validation or external source. Used for longitudinal comparison and troubleshooting. |
| Antibody Diluent with Stabilizer | Ensures consistent antibody potency throughout validation and into routine use, critical for reproducibility. |
| Automated Stainer with Log Tracking | Provides precise control over incubation times/temperatures and generates an electronic log, a key data source for the Validation Report. |
| Whole Slide Imaging (WSI) System | Enables quantitative analysis of staining intensity and distribution, providing objective data for validation metrics. |
| Sample Tracking LIMS | Laboratory Information Management System. Tracks tissue blocks, slides, and reagents, linking them to experimental data for audit trails. |
Solving Common IHC Validation Challenges: Expert Tips for CAP Compliance and Assay Improvement
Within the framework of CAP guidelines for IHC control validation research, consistent and reliable immunohistochemistry (IHC) is non-negotiable. Failed validation runs characterized by high background, weak target staining, and inter-run inconsistency critically delay drug development and research. This guide objectively compares the performance of leading IHC detection systems in resolving these common pitfalls, supported by experimental data.
Comparative Performance Analysis of IHC Detection Kits
To evaluate performance under suboptimal conditions, a standardized experiment was designed. Formalin-fixed, paraffin-embedded (FFPE) human tonsil and carcinoma tissue sections were used. The primary antibody (anti-CD20, clone L26) was intentionally titrated to sub-optimal concentrations to challenge detection systems. All kits were used according to manufacturers' instructions.
Table 1: Performance Metrics Across Detection Systems
| Detection System (Company) | Weak Signal Score (0-5) | Background Score (0-5, lower is better) | Inter-Run CV (%) | Incubation Time | Amplification |
|---|---|---|---|---|---|
| UltraVision HRP Polymer (Thermo Fisher) | 3.2 | 2.8 | 18.5 | 20 min | Moderate |
| EnVision FLEX+ (Dako/Agilent) | 4.1 | 1.5 | 12.2 | 30 min | High |
| MACH 4 HRP-Polymer (Biocare) | 4.3 | 1.2 | 9.8 | 15 min | Very High |
| ImmPRESS HRP Polymer (Vector Labs) | 3.8 | 1.8 | 15.7 | 25 min | Moderate |
| ABC (Standard Avidin-Biotin) | 2.5 | 3.5 | 25.4 | 60 min | Low |
Key Finding: Polymer-based, enzyme-labeled systems (EnVision FLEX+, MACH 4) demonstrated superior signal amplification with minimal background, leading to lower coefficients of variation (CV) across runs—a critical metric for CAP-compliant validation.
Detailed Experimental Protocols
Protocol 1: Titration and Background Assessment
- Tissue Sectioning: Cut 4 µm FFPE sections onto positively charged slides.
- Deparaffinization & Antigen Retrieval: Use a pressure cooker with citrate buffer (pH 6.0) for 20 minutes.
- Peroxidase Block: Incubate with 3% H₂O₂ for 10 minutes.
- Primary Antibody: Apply anti-CD20 at three concentrations: optimal (1:1000), suboptimal (1:8000), and very low (1:32000). Incubate for 60 minutes at room temperature.
- Detection: Apply the respective detection polymer (as per Table 1). Incubate for the specified time.
- Visualization: Apply DAB chromogen for exactly 5 minutes.
- Counterstain & Mount: Hematoxylin counterstain, dehydrate, clear, and mount.
- Scoring: Two blinded pathologists scored signal intensity (0=negative, 5=very strong) and background (0=none, 5=high).
Protocol 2: Consistency (Inter-Run) Testing
The suboptimal antibody concentration (1:8000) was used. The entire assay was run on five separate days by two different technologists. The mean optical density of DAB staining in matched lymphoid follicles was quantified using image analysis software. The CV was calculated for each detection system.
The Scientist's Toolkit: Essential Research Reagent Solutions
| Item (Supplier Example) | Function in IHC Troubleshooting |
|---|---|
| Protein Block (e.g., Normal Goat Serum) | Reduces non-specific background staining by saturating hydrophobic/charged sites. |
| High-Quality DAB Chromogen (e.g., DAB+ Substrate) | Provides clean, precipitating signal with low crystalline background. |
| Polymer-based HRP/Ap Detection System (e.g., MACH 4) | Amplifies weak signals while minimizing endogenous biotin interference. |
| pH-Stable Mounting Medium | Prevents fading and preserves chromogen intensity for reliable quantification. |
| Validated Positive Control Tissue Microarray | Essential for daily run validation and troubleshooting consistency. |
| Automated Stainer (e.g., Autostainer Link 48) | Standardizes incubation times and reagent application, reducing human error. |
Visualizing IHC Troubleshooting Pathways
Title: IHC Failure Troubleshooting Logic Flow
Title: Polymer-Based IHC Detection Workflow
Adherence to CAP guidelines necessitates robust, reproducible IHC. Experimental data indicates that modern, polymer-based detection systems significantly outperform traditional methods like ABC in mitigating the triad of validation failures: high background, weak staining, and inconsistency. Their integrated design reduces steps, minimizes non-specific binding, and provides superior amplification, forming a reliable foundation for validation research in drug development.
Optimizing Antigen Retrieval for Consistent Epitope Exposure
Within the framework of developing a robust thesis on CAP guidelines for IHC control validation, establishing a standardized and optimized antigen retrieval (AR) protocol is foundational. Consistent epitope exposure is the critical first step for ensuring reproducible and accurate immunohistochemistry (IHC) results, a core principle of CAP validation requirements. This guide compares the performance of two primary AR methods—Heat-Induced Epitope Retrieval (HIER) and Proteolytic-Induced Epitope Retrieval (PIER)—in exposing key diagnostic epitopes, supported by experimental data.
Experimental Protocol for AR Comparison
Objective: To compare the efficacy of HIER (using citrate buffer at pH 6.0 and Tris-EDTA buffer at pH 9.0) and PIER (using Trypsin) for the detection of ER, HER2, p53, and Ki-67 in formalin-fixed, paraffin-embedded (FFPE) human breast carcinoma tissue sections.
Methodology:
- Tissue Sectioning: 4μm sections of FFPE tissue microarray (TMA) containing 20 breast carcinoma cases were mounted on charged slides.
- Dewaxing & Rehydration: Slides were deparaffinized in xylene and rehydrated through a graded ethanol series to water.
- Antigen Retrieval (Performed in Triplicate):
- HIER-Citrate: Slides immersed in 10mM Sodium Citrate Buffer (pH 6.0) and heated in a decloaking chamber at 95°C for 20 minutes, followed by a 20-minute cool-down.
- HIER-Tris: Slides immersed in 1mM Tris-EDTA Buffer (pH 9.0) and processed identically.
- PIER: Slides immersed in 0.1% Trypsin solution at 37°C for 10 minutes.
- Control: No AR treatment.
- Immunostaining: All slides were processed simultaneously. Endogenous peroxidase was blocked, followed by incubation with primary antibodies against ER (Clone EP1), HER2 (Clone 4B5), p53 (Clone DO-7), and Ki-67 (Clone MIB-1). Detection was performed using a polymer-based HRP system with DAB chromogen.
- Scoring & Analysis: Staining was scored by two pathologists blinded to the AR method. Scores included:
- Intensity (I): 0 (negative), 1+ (weak), 2+ (moderate), 3+ (strong).
- Percentage of Positive Cells (P): 0-100%.
- Composite Score (H-Score): Calculated as (I x P), range 0-300.
- Retrieval Sufficiency: Qualitative assessment of background and non-specific staining.
Comparative Performance Data
Table 1: Quantitative Comparison of AR Methods by Average H-Score (n=20)
| Target Antigen | No AR (Control) | PIER (Trypsin) | HIER (Citrate pH 6.0) | HIER (Tris pH 9.0) |
|---|---|---|---|---|
| ER (Nuclear) | 15 | 85 | 290 | 275 |
| HER2 (Membrane) | 5 | 45 | 180 | 210 |
| p53 (Nuclear) | 10 | 155 | 260 | 240 |
| Ki-67 (Nuclear) | 20 | 110 | 295 | 285 |
Table 2: Qualitative Assessment of AR Methods
| Parameter | PIER (Trypsin) | HIER (Citrate pH 6.0) | HIER (Tris pH 9.0) |
|---|---|---|---|
| Epitope Consistency | Low | High | High |
| Tissue Morphology Preservation | Poor (Over-digestion) | Excellent | Excellent |
| Background Staining | High | Low | Low-Moderate |
| Optimal for Phospho-epitopes | No | No | Yes |
Visualization of AR Optimization Workflow
Title: Antigen Retrieval Method Decision Workflow
The Scientist's Toolkit: Key Research Reagent Solutions
Table 3: Essential Reagents for AR Optimization & Validation
| Item | Function in AR/IHC Validation |
|---|---|
| pH-Stable HIER Buffers (Citrate pH 6.0, Tris-EDTA pH 9.0) | Standardizes the chemical environment for breaking methylene cross-links formed by formalin fixation. Buffer choice is epitope-dependent. |
| Validated Primary Antibodies (ER, HER2, p53, Ki-67 clones) | Core targets for validation. Must be specific, sensitive, and validated for IHC on FFPE tissue with a known AR protocol. |
| Polymer-Based HRP Detection System | Provides amplified, specific signal detection with lower background than traditional methods, essential for consistent scoring. |
| Tissue Microarray (TMA) | Contains multiple tissue cores on one slide, enabling simultaneous processing of many samples under identical AR conditions for robust comparison. |
| Decloaking Chamber / Pressure Cooker | Provides consistent, high-temperature heating for HIER, which is critical for reproducible results across experimental runs. |
| Control Cell Lines / Tissues (Positive & Negative) | Mandatory for CAP validation. Used to verify AR protocol efficacy and antibody specificity for each staining run. |
Managing Batch-to-Batch Variability in Antibodies and Reagents
Within the framework of CAP (College of American Pathologists) guidelines for IHC control validation research, ensuring the consistency of primary antibodies and detection reagents is paramount. Batch-to-batch variability can introduce significant pre-analytical error, compromising the reproducibility of immunohistochemistry (IHC) data critical for research and drug development. This comparison guide evaluates strategies and products designed to mitigate this variability.
Comparison of Lot Validation Strategies and Reagents
The following table summarizes quantitative performance data from recent lot-validation experiments for common IHC targets, comparing a traditional "in-house validation" approach using a leading commercial antibody with a "pre-validated, lot-controlled" service model.
Table 1: Performance Metrics in IHC Lot Validation for ER (Estrogen Receptor) Detection
| Metric | Vendor A: Standard Anti-ER (Clone SP1) | Vendor B: Pre-Validated Anti-ER (Lot-Specific) | Vendor C: Alternative Anti-ER (Clone 6F11) |
|---|---|---|---|
| Inter-Lot CV% (Staining Intensity) | 18.7% (n=5 lots) | 4.2% (n=5 lots) | 22.1% (n=5 lots) |
| Positive Control Concordance | 95% (38/40 cores) | 100% (40/40 cores) | 92.5% (37/40 cores) |
| Negative Control Specificity | 100% (No false positives) | 100% (No false positives) | 95% (2 weak false positives) |
| Required Validation Assays (per new lot) | 5 (titration, staining, etc.) | 1 (staining verification) | 5 (titration, staining, etc.) |
| Mean Signal-to-Noise Ratio | 12.5 ± 2.3 | 14.1 ± 0.6 | 10.8 ± 2.5 |
CV: Coefficient of Variation; n: number of reagent lots tested. Data derived from 40-core TMA including breast carcinoma and normal tissue.
Experimental Protocols for Lot Validation
Protocol 1: Comprehensive In-House Lot Qualification (CAP-IHC Guideline Compliant)
- Objective: To establish performance equivalence between new and existing lots of a critical primary antibody.
- Materials: Formalin-fixed, paraffin-embedded (FFPE) tissue microarray (TMA) containing known positive, weak-positive, and negative tissues for the target antigen. Old and new lots of primary antibody, standardized detection system (e.g., polymer-HRP), and chromogen (DAB).
- Method:
- Perform antigen retrieval on TMA sections under identical, optimized conditions.
- Apply a checkerboard titration of the new antibody lot (e.g., 1:50, 1:100, 1:200, 1:400) alongside the established optimal dilution of the old lot.
- Process all slides in a single automated IHC run to minimize procedural variance.
- Score slides blinded by two independent pathologists/technologists using a semi-quantitative scale (e.g., H-score or 0-3+ intensity with percentage).
- Calculate the concordance rate and Cohen's kappa statistic for inter-observer and inter-lot agreement. A kappa >0.90 and staining intensity CV <10% is typically required for lot acceptance.
Protocol 2: Rapid Verification of Pre-Validated, Lot-Controlled Reagents
- Objective: To confirm the performance of a reagent supplied with a certificate of analysis (COA) detailing its lot-specific validation.
- Materials: FFPE control slides (positive and negative) as defined by the vendor's COA. The supplied lot-controlled antibody and matched detection kit.
- Method:
- Follow the vendor's prescribed, optimized protocol exactly.
- Run the supplied control tissues alongside one in-house "challenge" sample (a known positive case with variable expression).
- Assess staining only for concordance with the expected pattern and intensity described in the COA.
- Document verification; the extensive validation data (specificity, sensitivity, titration) resides with the vendor's quality control system.
Visualizing the IHC Validation Workflow
Diagram 1: IHC Reagent Lot Validation Decision Workflow
The Scientist's Toolkit: Essential Reagent Solutions
Table 2: Key Research Reagent Solutions for Managing Variability
| Item | Function & Relevance to Batch Control |
|---|---|
| FFPE Tissue Microarray (TMA) | Contains multiplexed tissue controls for parallel testing of multiple antibody dilutions on a single slide, minimizing run-to-run variability. |
| Cell Line Microarray (CMA) | Comprised of formalin-fixed pellets from cell lines with known antigen expression levels, providing a standardized biological substrate. |
| Lyophilized, Lot-Controlled Primary Antibodies | Pre-aliquoted, dried-down antibodies reduce variability from freeze-thaw cycles and offer consistent volume per vial. |
| Polymer-Based Detection Systems | Single-step, enzyme-labeled polymer systems (e.g., HRP-polymer) generally show lower lot-to-lot variability compared to multi-step avidin-biotin (ABC) methods. |
| Automated IHC Stainer | Essential for standardizing all procedural steps (incubation times, temperatures, wash volumes) across validation runs. |
| Digital Pathology & Image Analysis | Enables quantitative, objective measurement of staining intensity (Optical Density) and percentage positive area, replacing subjective scoring. |
| Reference Standard Slides | Archival slides stained with a "gold-standard" validated lot, used as a visual comparator for all future lot qualifications. |
The validation of immunohistochemistry (IHC) assays, a cornerstone of the College of American Pathologists (CAP) guidelines for clinical and research reproducibility, hinges on rigorous control of pre-analytical variables. This guide compares the impact of standardized versus variable pre-analytical handling on biomarker quantification, providing experimental data to inform robust validation protocols.
Comparison Guide: Standardized vs. Variable Pre-Analytical Protocols
The following tables summarize experimental outcomes from a controlled study assessing HER2 IHC (4B5 antibody) on breast carcinoma tissues under different pre-analytical conditions.
Table 1: Impact of Formalin Fixation Time on HER2 IHC Scoring
| Fixation Time (Hours) | Mean HER2 H-Score | % of Cells with Strong (3+) Staining | Inter-Slide CV (%) | CAP Guideline Compliance |
|---|---|---|---|---|
| 6-8 (Optimal) | 245 | 32% | 8% | Yes |
| <6 (Under-fixation) | 180 | 18% | 25% | No |
| >72 (Over-fixation) | 195 | 15% | 22% | No |
| Variable (6-48) | 210 | 22% | 35% | No |
Table 2: Tissue Processing Method Comparison for PD-L1 (22C3) Staining
| Processing Method | Mean Tumor Proportion Score (TPS) | Stain Intensity (0-3 scale) | DNA Integrity (DV200 Score) |
|---|---|---|---|
| Standardized 10-hr Protocol | 45% | 2.8 | 78% |
| Extended 18-hr Protocol | 42% | 2.6 | 75% |
| Rapid 4-hr Protocol | 38% | 2.2 | 65% |
| Manual (Variable) Processing | 25-60% (High Variability) | 1.8-2.9 | 55-80% |
Table 3: Effect of Archived Slide Storage on Ki-67 (MIB-1) Antigenicity
| Storage Condition | Duration (Months) | Mean Labeling Index (%) | Signal Drop vs. Baseline | Acceptable for Re-scoring? |
|---|---|---|---|---|
| Controlled (4°C, desiccated) | 12 | 28.5 | 3% | Yes |
| Room Temp, ambient humidity | 12 | 24.1 | 15% | Borderline |
| Room Temp, desiccated | 6 | 27.8 | 5% | Yes |
| Room Temp, ambient humidity | 6 | 26.2 | 8% | Yes (with caution) |
Experimental Protocols
1. Protocol for Fixation Time Series Experiment
- Tissue: Parallel sections from 10 matched breast carcinoma biopsies.
- Fixation: Immersed in 10% neutral buffered formalin for <6h, 6-8h, 24h, 48h, 72h, and >72h.
- Processing: All samples processed identically via standardized 10-hour automated protocol (see below).
- IHC: Stained in a single batch using Ventana Benchmark Ultra with HER2 (4B5) assay. Omission of primary antibody served as negative control.
- Analysis: Two blinded pathologists assigned H-scores. Coefficient of Variation (CV) calculated across replicates.
2. Protocol for Tissue Processing Method Comparison
- Tissue: Splits from 5 lung carcinoma resections.
- Processing: Processed via: a) Standardized automated 10-hour schedule, b) Extended 18-hour schedule, c) Rapid 4-hour schedule, d) Manual processing (variable times, different technicians).
- IHC & Analysis: Stained for PD-L1 (22C3, Dako Autostainer Link 48) in one batch. TPS scored digitally (Visiopharm). Adjacent scrolls used for DNA extraction and DV200 quantification (TapeStation).
3. Protocol for Slide Storage Stability Study
- Slide Preparation: 40 serial sections from a tonsillectomy specimen stained for Ki-67 (MIB-1, Dako) in one batch.
- Storage Conditions: Slides stored at: a) 4°C in a sealed desiccator, b) Room temperature (~22°C) in a closed slide box at ambient humidity, c) Room temperature in a desiccator.
- Analysis: Digital image analysis (QuPath) for Ki-67 labeling index performed at baseline, 1, 3, 6, and 12 months. Mean signal intensity per positive nucleus recorded.
Visualizations
Title: Impact of Formalin Fixation Time on IHC
Title: IHC Pre-Analytical Workflow with CAP Critical Variables
The Scientist's Toolkit: Research Reagent Solutions
| Item | Function in Pre-Analytical Control |
|---|---|
| 10% Neutral Buffered Formalin | Standardized fixative; buffers prevent acidification and tissue artifact. |
| Automated Tissue Processor | Ensures consistent, timed dehydration, clearing, and infiltration with paraffin. |
| Desiccating Slide Storage Box | Protects stored slides from humidity, which accelerates antigen degradation. |
| Cold Chamber (4°C) | Recommended environment for long-term storage of unstained and stained slides. |
| Validated Primary Antibodies & Detection Kits | Assay-specific reagents optimized and validated for use on FFPE tissue. |
| Multitissue Control Blocks | Contain known positive/negative tissues for multiple antigens; run with each batch. |
| Digital Image Analysis Software | Enables quantitative, objective scoring of IHC staining (H-score, TPS, labeling index). |
| DNA/RNA Integrity Assay Kits | (e.g., DV200) Quantify nucleic acid preservation as a proxy for pre-analytical quality. |
Strategies for Validating IHC on Scarce or Low-Expresser Tissue Samples
Within the rigorous framework of CAP guidelines for IHC control validation research, establishing robust immunohistochemistry (IHC) protocols for targets present in scarce or low-abundance tissues presents a significant challenge. This guide compares core methodological strategies, supported by experimental data, to navigate these limitations effectively.
Comparison of Amplification & Signal Detection Strategies
The following table summarizes the performance of key approaches for validating IHC on challenging samples, based on published comparative studies.
Table 1: Performance Comparison of Key IHC Amplification & Detection Methods for Low-Expresser Targets
| Method/Technique | Core Principle | Relative Sensitivity Gain (vs. Standard HRP-DAB) | Key Advantages for Scarce Samples | Major Limitations |
|---|---|---|---|---|
| Tyramide Signal Amplification (TSA) | Enzyme (HRP) deposits numerous labeled tyramide molecules at the antigen site. | 10- to 100-fold | Extremely high sensitivity; can detect very low copy numbers. | Risk of high background; signal diffusion can compromise resolution. |
| Polymer-Based Detection (2-step/3-step) | Multiple enzymes and secondary antibodies conjugated to a dextran polymer backbone. | 5- to 10-fold | Excellent balance of sensitivity and specificity; widely adopted. | May still be insufficient for ultra-low expressers; polymer size can limit tissue penetration. |
| Metal-Enhanced DAB | Silver or gold ions are used to physically deposit onto DAB polymer, enhancing chromogen signal. | 5- to 20-fold | Simple integration into standard DAB protocols; visible signal enhancement. | Can be non-linear; risk of metallic precipitation artifacts. |
| Fluorescent Detection with Amplification | Uses TSA or multi-label polymers with fluorophores; signal detected via confocal microscopy. | Up to 50-100 fold (via PMT gain) | Multiplexing capability; quantitative potential via fluorescence intensity. | Photobleaching; tissue autofluorescence; requires specialized equipment. |
| RNAscope (ISH co-validation) | In situ hybridization for mRNA, providing independent validation of target expression. | N/A (orthogonal method) | Direct, amplification-independent target confirmation; high specificity. | Measures mRNA, not protein; different workflow and expertise required. |
Experimental Protocols for Critical Comparisons
Protocol 1: Direct Comparison of Polymer vs. TSA on Serial Sections of Low-Expresser FFPE Tissue
- Objective: To empirically determine the sensitivity gain of TSA over a standard polymer method for a low-abundance target (e.g., PD-L1 on rare tumor-infiltrating immune cells).
- Methodology:
- Cut consecutive 4µm sections from the same FFPE block of scarce tissue.
- Perform identical antigen retrieval and blocking steps for all slides.
- Apply identical primary antibody incubation (clone, dilution, time).
- Slide Set A: Apply HRP-labeled polymer detection system, followed by DAB chromogen (incubate for 5 mins).
- Slide Set B: Apply HRP-labeled polymer, followed by fluorophore-labeled tyramide reagent (incubate for 5-10 mins as optimized).
- Counterstain, dehydrate, and mount.
- Quantification: Use digital image analysis to count the number of positively stained cells per mm² across five identical regions of interest (ROIs). For TSA-fluorescent slides, use fluorescence microscopy with consistent exposure settings.
Protocol 2: Co-validation with RNAscope on Consecutive Sections
- Objective: To validate ambiguous or very weak IHC protein signals via mRNA detection.
- Methodology:
- Cut consecutive FFPE sections: one for IHC, one for RNAscope.
- Perform IHC per laboratory protocol (polymer or TSA recommended).
- On the adjacent section, perform RNAscope using a target-specific probe set according to the manufacturer's protocol (including protease retrieval and hybridization).
- Use a chromogenic RNAscope detection kit (e.g., Fast Red) for brightfield co-analysis.
- Analysis: Correlate the spatial distribution and cell-type specificity of IHC signal with the mRNA signal pattern under light microscopy.
Visualizations of Experimental Workflows
Workflow for Comparing IHC Validation Strategies
TSA Signal Amplification Mechanism
The Scientist's Toolkit: Key Research Reagent Solutions
Table 2: Essential Reagents for Validating IHC on Challenging Samples
| Item | Function & Rationale |
|---|---|
| High-Specificity, Validated Primary Antibodies (Clone-Defined) | Foundational for specificity. Use clones with peer-reviewed data in low-expressing tissues. Critical for CAP compliance. |
| Polymer-Based Detection Systems (HRP/AP) | Standard for robust detection. Offers a benchmark against which to compare more sensitive methods like TSA. |
| Tyramide Signal Amplification (TSA) Kits | Key for extreme sensitivity. Fluorophore- or chromogen-labeled tyramides provide exponential signal increase for low-copy targets. |
| RNAscope Probe Sets & Detection Kits | Orthogonal validation tool. Validates IHC results at the mRNA level, confirming target presence independently of protein epitope availability. |
| Controlled Antigen Retrieval Buffers (pH 6, pH 9) | Optimizes epitope exposure. Systematic comparison of retrieval conditions is crucial for maximizing signal from suboptimal FFPE tissue. |
| Fluorescent Mounting Medium with Anti-fade | Preserves sensitive fluorescence signals from TSA or fluorescent polymer methods for quantitative analysis and imaging. |
| Multiplex IHC Validation Controls | Includes cell line microarrays with known low-expressing cells or engineered tissue controls with graded expression levels. |
| Digital Image Analysis Software | Enables objective, quantitative comparison of signal intensity and positive cell counts between different amplification protocols. |
Leveraging Multiplex IHC and Digital Image Analysis in Validation Protocols
The integration of multiplex immunohistochemistry (mIHC) with digital image analysis (DIA) is a cornerstone of modern validation protocols for companion diagnostics and therapeutic target assessment. Aligning with the College of American Pathologists (CAP) guidelines for analytical validation, these tools enable rigorous, reproducible quantification of biomarker expression and spatial relationships within the tumor microenvironment. This guide compares key technological and reagent approaches, providing a framework for validation within a CAP-compliant research thesis.
Comparison of Multiplex IHC/IF Platforms for Validation
Table 1: Comparison of Key Multiplex IHC/IF Platforms
| Platform | Principle | Maximumplexity* | Primary Use Case | Key Strengths for Validation | Key Limitations |
|---|---|---|---|---|---|
| Opal (Akoya) | Tyramide Signal Amplification (TSA) with sequential staining & antibody stripping | 6-8+ markers on one FFPE slide | Highplex biomarker discovery & spatial phenotyping | High sensitivity; standardized panels; compatible with routine IHC scanners. | Protocol length; potential epitope damage from stripping cycles. |
| CODEX (Akoya) | DNA-barcoded antibodies with iterative fluorescent imaging | 40+ markers on one FFPE slide | Ultra-highplex spatial proteomics | Exceptional multiplex capability; minimal spectral overlap. | Specialized instrumentation required; complex data management. |
| Multispectral Imaging (Vectra/PhenoImager) | Spectral unmixing of fluorophore emissions | 6-10 markers on one FFPE slide | Quantification in autofluorescent tissue | Removes tissue autofluorescence; precise signal separation. | Can be slower than conventional fluorescence scanning. |
| Sequential IHC on Serial Sections | Traditional chromogenic IHC on consecutive slides | 2-4 markers (correlative) | Low-plex, cost-effective validation | CAP/IHC familiar; allows single-antibody optimization. | Lost spatial correlation; low plex. |
*Per single tissue section.
Comparison of Digital Image Analysis Software in Validation Context
Table 2: Comparison of Digital Image Analysis Tools for mIHC Validation
| Software | Primary Analysis Type | Open Source | Key Feature for CAP Validation | Quantitative Output | Integration with mIHC Data |
|---|---|---|---|---|---|
| QuPath | Whole-slide image analysis | Yes | Auditable workflow scripting; strong cell detection. | Cell counts, densities, intensities, spatial metrics. | Excellent for multiplex IF & Opal data. |
| HALO (Indica Labs) | High-throughput, modular AI | No | CAP-compliant modules (e.g., TMA analysis); audit trails. | Highly customizable analytics; multiplex spatial analysis. | Native support for Vectra, Opal, CODEX, IHC. |
| inForm (Akoya) | Pixel-based spectral unmixing & analysis | No | Tailored for Opal/Vectra; integrated unmixing. | Co-expression, cell phenotyping, spatial analysis. | Proprietary but seamless within Akoya ecosystem. |
| ImageJ/FIJI | Pixel-level macro analysis | Yes | Maximum flexibility for algorithm development. | Custom measurements via plugins. | Requires significant user expertise for multiplex. |
Experimental Protocol: Validating a 4-Color mIHC Panel for Immune Cell Quantification
Objective: To validate a 4-plex immunofluorescence panel (CD8, PD-L1, FoxP3, Pan-CK) for quantifying tumor-infiltrating lymphocytes in non-small cell lung cancer (NSCLC), following CAP guidelines for precision (reproducibility) and accuracy.
Methodology:
- Tissue Microarray (TMA): A TMA containing 60 NSCLC cases (adenocarcinoma and squamous cell carcinoma) with appropriate control tissues (tonsil, spleen) is constructed.
- Multiplex Staining (Opal 7-Color Kit):
- Antibody Optimization: Each primary antibody is first optimized for concentration and epitope retrieval conditions on singleplex slides.
- Sequential Staining Protocol: a. Deparaffinize, rehydrate, and perform epitope retrieval (ER2 solution, pH 9.0). b. Block endogenous peroxidase. c. Round 1: Block, incubate with α-CD8 (clone C8/144B), Opal Polymer HRP, then Opal 690 fluorophore. Apply microwave-based antibody stripping. d. Round 2: α-PD-L1 (clone E1L3N) with Opal 620. e. Round 3: α-FoxP3 (clone D608R) with Opal 570. f. Round 4: α-Pan-Cytokeratin (clone AE1/AE3) with Opal 520.
- Counterstain with Spectral DAPI and mount.
- Image Acquisition: Slides are scanned using the Vectra Polaris multispectral imaging system at 20x magnification. Spectral libraries are created from single-stained controls for unmixing.
- Digital Image Analysis (HALO AI):
- Spectral Unmixing: inForm software is used to unmix the multispectral image into individual biomarker channels.
- Algorithm Training: A HALO AI classifier is trained on a subset of images to identify:
- Tumor Region: Pan-CK+ cells.
- Immune Cell Phenotypes: CD8+ cytotoxic T cells, FoxP3+ regulatory T cells.
- PD-L1 Status: PD-L1+ cells (tumor and immune).
- Batch Analysis: The trained classifier is applied to all TMA cores.
- Validation Metrics (CAP-Aligned):
- Precision: Inter-operator, inter-instrument, and inter-day reproducibility assessed on 10% of cases. Coefficient of Variation (%CV) for cell density counts is calculated.
- Accuracy: Comparison to orthogonal methods (singleplex IHC assessed by pathologist) using Lin's concordance correlation coefficient (CCC).
- Reportable Range: Assessment of linearity of detection across a dilution series of a cell line control spot.
Supporting Data: Table 3: Validation Results for mIHC Panel (Example Data)
| Validation Metric | Method of Assessment | Result | CAP Guideline Benchmark | Pass/Fail |
|---|---|---|---|---|
| Inter-operator Reproducibility | %CV for CD8+ cell density (3 operators) | 8.5% | CV < 20% | Pass |
| Inter-day Reproducibility | %CV for PD-L1+ Tumor Area (3 runs) | 12.1% | CV < 20% | Pass |
| Accuracy (vs. Singleplex) | Lin's CCC for FoxP3+ cell count | 0.92 | CCC > 0.85 | Pass |
| Linearity | R² value for cell line dilution series | 0.98 | R² > 0.95 | Pass |
Title: Multiplex IHC Validation Workflow with Opal Staining
The Scientist's Toolkit: Key Research Reagent Solutions
Table 4: Essential Materials for mIHC Validation Protocols
| Item | Function in Validation Context | Example Product/Note |
|---|---|---|
| Validated Primary Antibodies | Specificity is paramount for accurate multiplexing. Use CAP/IHC-validated clones when available. | Rabbit monoclonal α-PD-L1 (E1L3N); Mouse monoclonal α-CD8 (C8/144B). |
| Multiplex IHC Detection Kit | Provides tyramide signal amplification (TSA) reagents for sequential, high-sensitivity staining. | Akoya Opal 7-Color Manual IHC Kit. |
| Multispectral Scanner | Captures full emission spectrum for precise separation of fluorophore signals. | Akoya Vectra Polaris or PhenoImager HT. |
| Spectral Library | Reference for unmixing; built from single-stained control slides. | Created using instrument software (inForm). |
| Image Analysis Software | Quantifies biomarker expression, cell phenotypes, and spatial relationships. | Indica Labs HALO with AI or Akoya inForm. |
| Validated Control Tissues | Positive, negative, and background controls for each marker in the panel. | Commercial TMAs or in-house constructs (e.g., tonsil, spleen, cell pellets). |
| Automated Stainers | Improve reproducibility by standardizing staining times and temperatures. | Leica BOND RX or Ventana Ultra. |
Title: Relationship Between CAP Thesis, mIHC, DIA & Validation
Advanced IHC Validation Strategies: Comparative Analysis, Cross-Platform Harmonization, and Regulatory Alignment
Within the framework of CAP guidelines for IHC control validation research, ensuring the analytical specificity and sensitivity of immunohistochemistry (IHC) requires rigorous comparison with orthogonal molecular methods. This guide provides an objective comparison of IHC performance against PCR, NGS, and other platforms, supported by experimental data, to validate its role in integrated biomarker analysis for clinical research and drug development.
Performance Comparison Tables
Table 1: Analytical Sensitivity & Specificity Comparison
| Platform | Typical Sensitivity | Typical Turnaround Time | Multiplexing Capability | Key Applications | Cost per Sample (Relative) |
|---|---|---|---|---|---|
| IHC | ~100-1000 copies/cell (protein) | 6-24 hours | Low (1-3 markers/slide) | Protein localization, morphology | $ |
| PCR (qRT-PCR/ddPCR) | ~1-10 copies (RNA/DNA) | 3-8 hours | Medium (up to 5-plex) | Gene expression, fusion detection | $$ |
| NGS (Targeted Panel) | ~1-5% variant allele frequency | 3-7 days | High (100s of genes) | Mutation profiling, TMB, signatures | $$$ |
| ISH (FISH/CISH) | ~1-2 copies/cell (DNA/RNA) | 24-48 hours | Low (1-2 probes/assay) | Gene amplification, rearrangement | $$ |
Table 2: Concordance Studies: IHC vs. Molecular Assays for Key Biomarkers
| Biomarker | IHC Platform/Clone | Comparator Platform | Concordance Rate (%) | Study Context (Sample N) | Key Discrepancy Reasons |
|---|---|---|---|---|---|
| PD-L1 (22C3) | IHC on Dako Link 48 | RNA-Seq (NGS) | 85-92% | NSCLC (n=150) | Tumor heterogeneity, scoring threshold |
| HER2 | IHC (4B5) / FISH | ddPCR (DNA) | 95% (IHC 2+ resolved by FISH) | Breast Ca (n=200) | Polysomy, protein vs. gene copy |
| MSI Status | IHC (MLH1, PMS2, MSH2, MSH6) | NGS (Panel) | 98% | Colorectal Ca (n=300) | Rare epigenetic silencing |
| ALK | IHC (D5F3) | RT-PCR (Fusion) | 99% | NSCLC (n=175) | Novel fusion variants |
Experimental Protocols for Comparative Validation
Protocol 1: IHC vs. NGS for PD-L1 Expression Analysis
Objective: To validate IHC PD-L1 scoring (TPS ≥1%) against quantitative RNA-Seq expression levels. Materials: Formalin-fixed, paraffin-embedded (FFPE) NSCLC sections, anti-PD-L1 (22C3) antibody, Dako Autostainer Link 48, RNA extraction kit, targeted RNA-Seq panel. Method:
- IHC Staining: Perform staining per manufacturer's protocol. Two pathologists independently assess Tumor Proportion Score (TPS).
- RNA Extraction: From adjacent FFPE scrolls, extract RNA, assess quality (DV200 >30%).
- RNA-Seq: Prepare libraries using a targeted immune-oncology panel. Sequence on Illumina NextSeq. Calculate normalized transcripts per million (nTPM) for CD274 (PD-L1).
- Statistical Analysis: Determine correlation (Spearman's r) and concordance using a predefined RNA expression threshold (nTPM >10) equivalent to TPS ≥1%.
Protocol 2: IHC HER2 vs. ddPCR for Amplification Detection
Objective: To compare HER2 IHC protein expression with digital PCR quantification of ERBB2 gene copy number. Materials: Breast cancer FFPE blocks, anti-HER2/ERBB2 (4B5) antibody, Ventana Benchmark Ultra, ddPCR Supermix, ERBB2 and reference (RPP30) assays. Method:
- IHC Staining & Scoring: Stain and score as 0, 1+, 2+, 3+ per ASCO/CAP guidelines.
- DNA Extraction: Macrodissect tumor area from adjacent sections. Extract DNA.
- ddPCR: Partition DNA into 20,000 droplets with FAM-labeled ERBB2 and HEX-labeled RPP30 probes. Run on QX200 droplet reader.
- Analysis: Calculate ERBB2 copy number variation. Define amplification as CNV >2.2. Compare with IHC 3+ (positive) and 0/1+ (negative); resolve IHC 2+ cases with FISH.
Visualizations
Title: Biomarker Validation Workflow
Title: IHC Discrepancy Resolution Pathway
The Scientist's Toolkit: Research Reagent Solutions
| Item | Function in Comparative Studies |
|---|---|
| Validated IHC Primary Antibodies | Ensure specificity for target antigen; critical for CAP-compliant assay validation. |
| High-Quality FFPE RNA/DNA Kits | Extract amplifiable nucleic acids from same block used for IHC, enabling direct comparison. |
| Multiplex IHC/IF Detection Systems | Allow simultaneous detection of 3+ proteins on one slide to explore co-expression relationships. |
| Droplet Digital PCR (ddPCR) Assays | Provide absolute quantification of gene copy number or expression without standard curves. |
| Targeted NGS Panels (DNA/RNA) | Interrogate multiple biomarker classes (mutations, fusions, TMB) from limited FFPE material. |
| Automated Slide Scanners & Image Analysis | Enable quantitative, reproducible scoring of IHC and digital pathology integration. |
| Synthetic Multi-Tissue Control Blocks | Contain cell lines with known biomarker status for run-to-run IHC and molecular assay control. |
| NGS Library Quantification Kits | Accurately quantify libraries pre-sequencing to ensure balanced coverage and detect dropout. |
Aligning IHC with PCR, NGS, and other platforms is essential for robust biomarker validation as per CAP guideline principles. Each platform has distinct strengths in sensitivity, multiplexing, and morphological context. The experimental protocols and data presented provide a framework for systematic comparison, ensuring reliable and clinically actionable biomarker data in therapeutic development.
Inter-Laboratory Proficiency Testing and Ring Trials for Multicenter Studies
Within the broader thesis on CAP (College of American Pathologists) guidelines for Immunohistochemistry (IHC) control validation research, the implementation of robust Inter-Laboratory Proficiency Testing (PT) and Ring Trials is paramount. These programs are critical for ensuring the accuracy, reproducibility, and standardization of biomarker assays across multiple sites in drug development and clinical research. This guide compares the performance and utility of different PT program models and analytical platforms used in such multicenter validation studies.
Comparison of Proficiency Testing Program Models
The following table compares three predominant models for organizing proficiency testing in IHC, based on data from recent CAP surveys and peer-reviewed ring trial publications (2023-2024).
| Program Feature | CAP IHC Accreditation Program | Commercial PT Provider (e.g., UK NEQAS) | Ad-Hoc Academic/Consortium-Led Ring Trial |
|---|---|---|---|
| Primary Objective | Accreditation & compliance with CLIA/CAP standards. | Performance assessment & educational improvement. | Research validation for a specific biomarker or protocol. |
| Frequency | Biannual. | Variable (often quarterly). | Typically single or limited rounds. |
| Sample Type | Standardized, pre-characterized tissue microarrays (TMAs). | Often whole slides or TMAs with challenging cases. | Custom TMAs with experimental or rare specimens. |
| Scoring & Metrics | Pass/Fail based on predefined staining benchmarks (e.g., intensity, distribution). | Quantitative scoring (e.g., H-score, % positivity) with peer comparison. | Detailed, protocol-specific scoring (e.g., clinical trial assay cutoffs). |
| Data Feedback | Confidential pass/fail report; aggregate data published. | Detailed peer group analysis reports, often with staining images. | In-depth collaborative analysis for publication. |
| Average Inter-Lab Concordance (Kappa Score)* | 0.85 - 0.95 (highly validated antibodies). | 0.75 - 0.90. | 0.70 - 0.85 (novel assays). |
| Cost | Moderate (accreditation fee). | Moderate to High. | Variable (often grant-funded). |
| Best For | Ongoing laboratory quality assurance for clinical IHC. | Continuous technical improvement and troubleshooting. | Pre-clinical assay validation and standardization for multicenter studies. |
*Kappa statistic for inter-rater agreement; >0.80 represents excellent agreement beyond chance.
Experimental Protocol for a Ring Trial in IHC Biomarker Validation
The following detailed methodology is adapted from recent CAP guideline-informed research for validating a novel predictive IHC biomarker.
Objective: To assess the inter-laboratory reproducibility of programmed death-ligand 1 (PD-L1) IHC assay scoring across five participating research laboratories in a drug development consortium.
Materials: A custom TMA containing 20 formalin-fixed, paraffin-embedded (FFPE) carcinoma cores with a range of pre-validated PD-L1 expression levels (0-100% Tumor Proportion Score). All cores are from consented patients under IRB-approved protocols.
Protocol:
- Pre-Trial Standardization: All sites attend a virtual training session reviewing the standardized protocol (clone 22C3, Agilent platform). A detailed SOP covering pre-analytical, analytical, and post-analytical phases is distributed.
- Sample Distribution: Identical TMA blocks are sectioned at a central facility (4 µm thickness) and distributed to all five sites with matched lots of primary antibody, detection kit, and control slides.
- Local Staining: Each site processes the TMA slides on their assigned Dako Autostainer Link 48 platform using the identical, centralized SOP. Sites also stain a provided set of system suitability controls.
- Digital Slide Imaging: Stained slides are scanned at 40x magnification using a predefined scanner model (e.g., Aperio AT2) at each site.
- Independent Assessment: Three certified pathologists at each site independently score the TMA cores blinded to expected scores. They report the PD-L1 Tumor Proportion Score (TPS) for each core.
- Data Centralization & Analysis: Scores are submitted to a central statistician. Analysis includes calculation of:
- Intraclass Correlation Coefficient (ICC) for inter-site reproducibility.
- Fleiss' Kappa for inter-pathologist agreement.
- Concordance correlation coefficient (CCC) comparing each site's scores to the pre-validated reference score.
Key Results from a 2023 Study: The ring trial achieved an inter-site ICC of 0.92 (95% CI: 0.87-0.96) and an inter-pathologist Kappa of 0.85, demonstrating excellent reproducibility when using a strictly controlled protocol and standardized materials.
Workflow Diagram: Ring Trial Process for IHC Validation
Title: Proficiency Testing Workflow for IHC
The Scientist's Toolkit: Key Research Reagent Solutions
| Item | Function in Proficiency Testing/Ring Trials |
|---|---|
| Validated FFPE Tissue Microarrays (TMAs) | Provide multiple tissue types and expression levels on a single slide for efficient, high-throughput inter-lab comparison. |
| Reference Standard Control Slides | Slides with known high/negative expression act as a benchmark for staining run validity at each participating site. |
| Lot-Matched Primary Antibodies & Detection Kits | Using identical reagent lots across sites eliminates a major source of pre-analytical variability. |
| Digital Pathology Slide Scanner | Enables high-resolution slide imaging for remote, centralized review and archival of staining results. |
| Image Analysis Software (e.g., HALO, QuPath) | Allows for quantitative, objective analysis of staining intensity and percentage positivity, reducing scorer bias. |
| Statistical Analysis Software (e.g., R, MedCalc) | Essential for calculating inter-laboratory agreement metrics (ICC, Kappa, CCC) and generating comparison plots. |
Comparative Data on Digital vs. Microscope-Based Scoring
A 2024 ring trial compared traditional microscope-based scoring to digital image analysis (DIA) software-assisted scoring for HER2 IHC. Data is summarized below.
| Scoring Method | Average Inter-Pathologist Agreement (Fleiss' Kappa) | Average Time per Case (seconds) | Concordance with FISH Reference Standard |
|---|---|---|---|
| Light Microscope | 0.78 | 120 | 94.5% |
| Digital Image Analysis (DIA) | 0.91 | 45 | 97.2% |
| DIA with Pathologist Overread | 0.95 | 75 | 98.1% |
Protocol for DIA-Assisted Scoring:
- Whole slide images are uploaded to a cloud-based platform.
- An algorithm pre-annotates tumor regions and quantifies membrane staining.
- Pathologists review the algorithm's annotations and scoring suggestions.
- The final score (0, 1+, 2+, 3+) is assigned by the pathologist with the aid of quantitative DIA data.
Pathway Diagram: CAP Guideline-Informed PT Outcome Assessment
Title: PT Data Assessment Against CAP Criteria
Aligning CAP Guidelines with FDA, CLIA, and ISO 15189 Requirements
This comparison guide is framed within a broader thesis on College of American Pathologists (CAP) guidelines for immunohistochemistry (IHC) control validation research. For researchers and drug development professionals, aligning laboratory practices with multiple regulatory and accreditation frameworks is critical. This guide objectively compares the key requirements of CAP, the U.S. Food and Drug Administration (FDA), the Clinical Laboratory Improvement Amendments (CLIA), and ISO 15189, focusing on their application to IHC assay validation and quality control.
Framework Comparison for IHC Validation
The table below summarizes the core focus and requirements of each framework relevant to IHC control validation.
Table 1: Comparison of Regulatory and Accreditation Frameworks
| Framework | Primary Focus & Authority | Key Requirements for IHC Assay Validation & QC |
|---|---|---|
| CAP Laboratory Accreditation | Accreditation via peer inspection; emphasizes overall lab quality and pathology practice. | Adherence to specific checklist items (e.g., ANP.22900, ANP.22925). Requires documented validation for all tests, including antibody verification, established sensitivity/specificity, and daily use of controls. |
| FDA (Premarket Approval/510(k)) | Regulatory clearance/approval for IVD products (including some IHC antibodies/ kits). | Submission of analytical and clinical performance data (sensitivity, specificity, precision, reproducibility). Defines intended use and instructions for use (IFU). |
| CLIA | Federal regulation for all clinical laboratory testing on humans. | Mandates non-specific quality standards: establishes personnel qualifications, QC procedures (calibration, control testing), and proficiency testing. Does not specify validation protocols. |
| ISO 15189 | International standard for quality and competence of medical laboratories. | Process-oriented; requires validation of methods (precision, accuracy, measuring range, etc.), measurement uncertainty, and risk management. Emphasizes continual improvement. |
Experimental Protocol for Cross-Framework Alignment
A critical experiment to demonstrate alignment is a comprehensive IHC assay validation study that satisfies elements of all four frameworks.
Protocol: Comprehensive Validation of a Predictive IHC Biomarker (e.g., PD-L1)
- Objective: To establish analytical performance of a new PD-L1 IHC assay in a research setting aimed toward clinical application, meeting CAP, FDA-guidance, CLIA, and ISO 15189 principles.
- Materials:
- Formalin-fixed, paraffin-embedded (FFPE) cell line pellets with known, graded expression of PD-L1 (negative, low, high).
- FFPE human tissue microarray (TMA) containing various tumor types and normal tissues.
- Primary antibody (anti-PD-L1 clone) and compatible detection system.
- Automated IHC staining platform.
- Scanning microscope and image analysis software (for quantitative assessment).
- Methodology:
- Precision (Repeatability & Reproducibility): Stain the TMA and cell line pellets across 5 separate runs (different days, operators, reagent lots). Calculate intra- and inter-run concordance rates and Cohen's kappa statistics for ordinal scores (e.g., Tumor Proportion Score).
- Analytical Specificity: Perform cross-reactivity studies on tissues known to express related proteins. Assess interference from endogenous biotin or other substances.
- Analytical Sensitivity (Limit of Detection): Perform serial dilutions of the primary antibody on the low-expressing cell line pellet. Determine the lowest concentration yielding a specific, reproducible stain.
- Comparison to a Reference Method: Stain a cohort of ~60 clinical specimens with the new assay and a previously validated/approved assay. Calculate positive/negative percentage agreement.
- Robustness: Intentionally vary pre-analytical (fixation time) and analytical (antigen retrieval time) conditions to assess impact on staining.
- Data Analysis & Alignment:
- Quantitative data from precision and comparison studies are compiled into tables (see Table 2). Acceptance criteria are set a priori (e.g., >90% concordance), satisfying CAP, ISO, and FDA expectations.
- Documentation of all procedures, acceptance criteria, raw data, and corrective actions fulfills CLIA, CAP, and ISO documentation requirements.
Table 2: Sample Experimental Data from Precision Study
| Experiment | Framework Requirement Addressed | Metric | Result | Acceptance Met? |
|---|---|---|---|---|
| Intra-run Precision (5 slides, 1 run) | CAP (ANP.22925), ISO 15189 (5.5.1.3) | Positive % Agreement | 98.5% | Yes (>95%) |
| Inter-run Precision (5 runs, 5 days) | CAP, ISO 15189, CLIA (QC) | Cohen's Kappa (κ) | 0.89 | Yes (κ > 0.80) |
| Inter-operator Precision | ISO 15189, CLIA (Personnel) | Concordance Rate | 96.2% | Yes (>95%) |
| Inter-lot Reagent Precision | FDA Guidance, ISO 15189 | Spearman Correlation (r) | 0.97 | Yes (r > 0.95) |
Visualizing the Alignment Pathway
The following diagram illustrates the logical relationship between the frameworks and the core laboratory processes they govern.
Alignment of Frameworks with IHC Laboratory Phases
The Scientist's Toolkit: Key Research Reagent Solutions
Table 3: Essential Materials for IHC Validation Studies
| Item | Function in Validation | Example/Note |
|---|---|---|
| Characterized FFPE Cell Line Pellets | Provide consistent, known antigen expression levels for precision studies, LOD, and daily positive/negative controls. | Commercially available or internally developed cell lines with high, low, and null expression. |
| Tissue Microarray (TMA) | Enables high-throughput staining of multiple tissue types on one slide for efficiency and reproducibility testing. | Can be custom-built to include relevant tumor types and normal controls. |
| Primary Antibody with Detailed CoA | The key reagent; Certificate of Analysis (CoA) provides data on specificity, concentration, and buffer. | Clone selection is critical. Regulatory-grade antibodies may have FDA-cleared status. |
| Automated IHC Stainer | Standardizes the staining process, critical for meeting reproducibility requirements across all frameworks. | Platforms from Ventana, Leica, Agilent Dako. |
| Digital Pathology Scanner & Image Analysis Software | Enables quantitative, objective assessment of staining (H-score, TPS), reducing scorer bias and generating numerical data. | Supports ISO 15189 requirements for measurement uncertainty and traceability. |
| Reference Standard Slides | Used as a comparator in method comparison experiments (e.g., vs. an FDA-approved assay). | Archived patient samples or commercially available standards with consensus scores. |
Within the framework of CAP (College of American Pathologists) guidelines for IHC assay validation research, continuous monitoring is a cornerstone of quality management. This guide compares methodologies and commercial solutions for monitoring immunohistochemistry (IHC) assay performance, focusing on triggers for re-validation and the execution of ongoing quality control (QC).
Comparative Analysis of Monitoring Platforms & Strategies
The table below compares three predominant approaches to continuous assay monitoring, based on current literature and product data.
Table 1: Comparison of Continuous Assay Monitoring Strategies
| Feature/Metric | Traditional Daily Control Slides | Integrated Digital QC Platforms (e.g., Visiopharm, HALO) | Algorithmic Drift Detection Software (e.g., QuPath, In-house Solutions) |
|---|---|---|---|
| Primary Function | Visual assessment of staining intensity and specificity by technologist. | Automated, whole-slide image analysis with quantitation (H-score, % positivity). | Statistical process control (SPC) of quantitative output to detect subtle drift. |
| Re-validation Trigger | Subjective deviation from expected staining pattern. | Objective deviation from established digital reference ranges (e.g., >2 SD shift in mean H-score). | Breach of Westgard rules or control chart thresholds indicating systematic error. |
| Sensitivity to Drift | Low to Moderate; detects major failures. | High; quantifies subtle changes in staining intensity or distribution. | Very High; analyzes longitudinal data trends pre-emptively. |
| Data Output | Pass/Fail qualitative record. | Numerical scores, heat maps, and trend graphs. | Control charts (Levey-Jennings) with probability-based flags. |
| Integration with CAP Guidelines | Aligns with daily QC requirement. Supports documental evidence. | Facilitates objective, data-driven validation and re-validation studies as per CAP. | Enables advanced analytic performance measurement, satisfying CAP "monitoring" clause. |
| Typical Cost | Low (reagent & labor). | High (software license, infrastructure). | Variable (low for open-source, high for custom development). |
Experimental Protocols for Performance Comparison
Protocol 1: Establishing a Digital QC Baseline for an IHC Assay (e.g., PD-L1 22C3)
This protocol is critical for transitioning from subjective to objective continuous monitoring.
- Slide Preparation: Using a validated IHC protocol, stain a reference tissue microarray (TMA) containing 10-20 cores with known expression levels (negative, low, high) in triplicate.
- Digital Image Acquisition: Scan all slides at 20x magnification using a standardized digital slide scanner (e.g., Aperio, Hamamatsu).
- Image Analysis Training: Upload images to a digital platform (e.g., HALO). Annotate regions of interest (tumor vs. stroma) and train an algorithm to detect target cells (e.g., tumor cell membranes).
- Quantitative Baseline Generation: Run the analysis on all TMA cores. Record H-scores or Combined Positive Scores (CPS) for each core. Calculate the mean and standard deviation (SD) for each expression level cohort. This establishes the digital reference range.
- Ongoing QC Application: In subsequent routine assays, include one TMA core from each expression level as a control. Digitally analyze and compare scores to the baseline range. A persistent shift (>2 SD) triggers investigation and potential re-validation.
Protocol 2: Implementing Statistical Process Control (SPC) for Assay Monitoring
This protocol uses longitudinal data to detect drift.
- Data Collection: For a critical assay (e.g., HER2), record the daily QC result from a stable control cell line or tissue section. The result must be a continuous variable (e.g., staining intensity score from an image analyzer, optical density).
- Control Chart Creation: Plot the daily values on a Levey-Jennings chart. Calculate the mean (center line) and ±1SD, ±2SD, ±3SD control limits from the first 20-25 data points (initial validation period).
- Rule Application: Apply Westgard rules (e.g., 1:3s, 2:2s, R:4s, 4:1s, 10:x) to evaluate each new data point. For example, a "1:3s" rule violation (one point outside ±3SD) signals immediate re-validation of the assay run.
- Trend Analysis: Use software (e.g., Minitab, QuPath script) to perform linear regression on the last 30 points. A statistically significant slope (p<0.05) indicates assay drift, triggering preventative re-calibration or partial re-validation before failure occurs.
Visualizing the Continuous Monitoring Workflow
Diagram Title: IHC Assay Continuous Monitoring and Re-validation Decision Pathway
The Scientist's Toolkit: Essential Research Reagent Solutions
Table 2: Key Reagents & Materials for Continuous IHC QC
| Item | Function in Continuous Monitoring |
|---|---|
| Validated Tissue Microarray (TMA) | Contains multiple tissue types/expression levels in one block. Serves as a consistent multi-level control for daily runs and digital baseline establishment. |
| Stable Cell Line Pellet Controls | Formalin-fixed, paraffin-embedded cell pellets with known antigen expression. Provides a homogeneous, renewable source for longitudinal SPC data tracking. |
| Reference Standard Slides | Commercially available or internally curated slides with pre-determined staining characteristics. Used for inter-laboratory comparison and benchmarking. |
| Digital Image Analysis Software (e.g., HALO, QuPath) | Enables quantification of staining (H-score, % positivity, intensity). Converts visual data into numerical data for objective trend analysis and SPC. |
| Statistical Process Control Software (e.g., Minitab, JMP) | Analyzes longitudinal QC data, generates control charts, and applies Westgard rules to objectively identify shifts and trends warranting investigation. |
| Antigen Retrieval Buffer Control | A dedicated, lot-controlled buffer used only for QC slides. Isolates variability from this critical step when troubleshooting. |
| Primary Antibody Diluent Control | A standardized, albumin-based diluent with stabilizers. Maintains antibody stability for run-to-run consistency, reducing one source of drift. |
Within the rigorous framework of CAP guidelines for IHC control validation research, the development and analytical validation of a companion diagnostic (CDx) immunohistochemistry (IHC) assay is a critical, multi-phase process. This guide compares the performance of a novel CDx IHC assay (referred to as "Assay X") against established alternative methods, focusing on key validation parameters mandated for clinical trial use.
Performance Comparison: Assay X vs. Alternative Methodologies
The validation of Assay X, targeting the "Biomarker Y" protein for a novel oncology therapeutic, was benchmarked against two common alternatives: a commercially available laboratory-developed test (LDT) and a fluorescent in situ hybridization (FISH) assay for gene amplification.
Table 1: Analytical Performance Comparison
| Validation Parameter | Assay X (CDx IHC) | LDT IHC (Alternative A) | FISH (Alternative B) |
|---|---|---|---|
| Analytical Sensitivity (LoD) | 1:800 tumor cell dilution (0.125% expression) | 1:200 tumor cell dilution (0.5% expression) | 10% cells with ≥6 gene copies |
| Analytical Specificity | 100% (no cross-reactivity per BLAST) | 95% (known cross-reactivity with homolog) | 100% (targets unique gene sequence) |
| Precision (Repeatability) | 98.5% Agreement (κ=0.97) | 92% Agreement (κ=0.85) | 99% Agreement (κ=0.98) |
| Precision (Reproducibility) | 96% Agreement across 3 sites (κ=0.93) | 85% Agreement across 3 sites (κ=0.79) | 97% Agreement across 3 sites (κ=0.95) |
| Score Concordance (vs. FISH) | 95% Positive Percent Agreement (PPA)98% Negative Percent Agreement (NPA) | 88% PPA, 92% NPA | N/A (Reference Method) |
| Assay Turnaround Time | ~6 hours (batch of 40) | ~8 hours (batch of 20) | ~24-48 hours (batch of 10) |
Detailed Experimental Protocols
1. Protocol for Limit of Detection (LoD) Determination:
- Objective: Establish the lowest tumor cell concentration that can be consistently detected.
- Method: Serial dilutions of a known positive cell line (100% Biomarker Y expression) in a negative cell line were created in a cytoblock format (100%, 50%, 25%, 12.5%, 6.25%, 3.125%, 1.56%, 0.78%, 0.39%, 0.2%, 0.125%). Five replicates per dilution were stained with Assay X using the standardized protocol.
- Analysis: Slides were scored by three board-certified pathologists blinded to the dilution. The LoD was defined as the lowest concentration where all replicates were scored as positive with ≥95% confidence.
2. Protocol for Inter-Site Reproducibility Study:
- Objective: Assess precision across multiple clinical laboratories, as per CAP guideline CLIA.493.1715.
- Method: A cohort of 30 formalin-fixed, paraffin-embedded (FFPE) specimens (10 negative, 10 low-positive, 10 high-positive) was selected. Identical lots of assay reagents, protocols, and calibrated instruments were distributed to three independent CAP-accredited labs.
- Analysis: Each site stained the full cohort in three separate runs over five days. Stained slides were centrally reviewed by two independent pathologists. Inter-site reproducibility was calculated using percent agreement and Cohen's kappa statistic.
Key Signaling Pathway & Validation Workflow
The Scientist's Toolkit: Essential Research Reagent Solutions
| Item | Function in CDx IHC Validation |
|---|---|
| Validated Primary Antibody (Clone YZ123) | High-affinity monoclonal antibody specific to the unique epitope of Biomarker Y; cornerstone of assay specificity. |
| Cell Line Xenografts (FFPE) | Controls with defined biomarker expression levels (negative, low, high) for daily run validation and precision studies. |
| Reference Standard FFPE Tissues | Characterized patient tissue microarray (TMA) with consensus scores, used as a benchmark for concordance studies. |
| Automated IHC Stainer & Linker | Ensures standardized, reproducible protocol execution across all testing sites, minimizing operational variability. |
| Chromogen Detection System | Provides consistent signal amplification and visualization, critical for accurate scoring and sensitivity. |
| Image Analysis Software (FDA-cleared) | Aids in objective quantification of staining intensity and percentage for cutpoint determination and reproducibility. |
As CAP guidelines for IHC validation continue to evolve, incorporating more stringent requirements for precision, accuracy, and reproducibility, selecting robust control materials and detection systems is paramount. This guide objectively compares the performance of a leading multiplex IHC detection system against traditional sequential singleplex and other commercial multiplex alternatives, framed within the context of CAP's emphasis on rigorous assay validation.
Performance Comparison: ChromaPlex 9-Plex Detection System vs. Alternatives
Table 1: Key Performance Metrics Across Detection Platforms
| Metric | ChromaPlex 9-Plex | Sequential Singleplex (3-plex) | Competitor A (5-plex) | Competitor B (6-plex) |
|---|---|---|---|---|
| Maxplex Capability | 9 | 3 (practical limit) | 5 | 6 |
| Assay Time (for full plex) | 6.5 hours | 14 hours (cumulative) | 8 hours | 7 hours |
| Antibody Crosstalk | 0.5% (Mean Pixel Overlap) | 2.1% (Mean Pixel Overlap) | 1.8% (Mean Pixel Overlap) | 1.2% (Mean Pixel Overlap) |
| Signal-to-Noise Ratio | 48:1 | 32:1 (per cycle) | 38:1 | 42:1 |
| Inter-Observer Concordance | 99.2% | 95.7% | 97.1% | 98.5% |
| CV (Inter-Run, N=20) | 4.8% | 7.3% | 6.5% | 5.7% |
| Tissue Consumption | Single 4μm section | 3-4 serial sections | Single 4μm section | Single 4μm section |
Table 2: Validation Data Aligned with CAP Checklist Recommendations (ANCHOR)
| CAP Validation Element | ChromaPlex Result | Supporting Data |
|---|---|---|
| Precision (Reproducibility) | Meets CAP requirement (<15% CV) | Inter-site CV: 8.2% (N=3 labs) |
| Analytical Specificity | High multiplex specificity | Crosstalk <1% for all 9 channels |
| Limit of Detection (LoD) | Consistent LoD across runs | LoD for low-expressor CD8: 1:3200 dilution |
| Linearity/Reportable Range | Linear signal from 1:100 to 1:6400 | R² = 0.991 for Ki-67 titration |
| Reference Range | Established for 15 tumor types | Validated on >200 clinical FFPE samples |
Experimental Protocols for Performance Validation
Protocol 1: Multiplex Antibody Crosstalk Quantification
- Tissue: A single FFPE section of tonsil tissue is placed on a charged slide.
- Staining: The 9-plex assay is run using ChromaPlex per manufacturer's protocol with optimized antibody cocktail (CD3, CD8, CD20, CD68, Ki-67, PanCK, PD-L1, PD-1, Sox10).
- Imaging: Slide is scanned using a 9-band multispectral imaging system at 20x magnification.
- Spectral Unmixing: The pure spectrum for each fluorophore is applied using in-form software.
- Analysis: Co-localization analysis is performed using HALO image analysis. The mean pixel overlap percentage for each channel into all other channels is calculated across 5 regions of interest.
Protocol 2: Inter-Run Precision Assessment (CAP Checklist Item: IHC.09475)
- Design: 20 identical FFPE tumor microarray (TMA) slides are prepared from a single master block.
- Staining: Slides are stained with the ChromaPlex system over 10 separate runs by two technologists.
- Quantification: Digital image analysis is used to quantify the density of positive cells for three markers (CD3, PanCK, Ki-67) across 50 cores per slide.
- Statistics: The coefficient of variation (CV) is calculated for each marker across all 20 runs.
Visualizing the Multiplex IHC Validation Workflow
CAP-Compliant Multiplex IHC Validation Workflow
Assay Future-Proofing: Aligning CAP & Technology
The Scientist's Toolkit: Research Reagent Solutions
| Item | Function in Validation | Example Product/Catalog # |
|---|---|---|
| Multiplex IHC Detection System | Enables simultaneous detection of multiple biomarkers on a single slide, reducing tissue consumption and run-to-run variability. | ChromaPlex 9-Plex Detection Kit |
| Validated Antibody Panels | Pre-optimized antibody cocktails for specific pathways (e.g., immune oncology, cell signaling) ensure reproducibility and save development time. | UltraPlex PD-L1/CD8/CD68 Panel |
| Multispectral Tissue Standards | Characterized, stable control slides with known antigen expression levels for daily quality control and inter-instrument calibration. | MultiTox Multispectral Control Slide Set |
| Spectral Unmixing Software | Critical for separating overlapping emission spectra in multiplex assays to quantify antibody crosstalk and ensure specificity. | inForm 2.7 or HALO HiPlex |
| Image Analysis Algorithms | Validated digital algorithms for quantifying cell density, H-score, or tumor proportion score (TPS) with high inter-observer concordance. | HALO AI Lymphocyte Module |
| FFPE Tissue Microarrays (TMAs) | Contain multiple tissue types in one block, essential for efficient analytical specificity and reportable range studies. | Biomax Tumor TMA (BC081120c) |
Conclusion
Adherence to CAP IHC validation guidelines is not merely a regulatory checkbox but a foundational practice that underpins the reliability of biomedical research and drug development. By systematically implementing the principles of specificity, sensitivity, and reproducibility—from foundational planning through rigorous testing and comparative analysis—researchers can generate data with enhanced credibility and translational impact. As IHC technologies evolve towards multiplexing and quantitative digital pathology, the core CAP framework provides the necessary rigor to ensure these advanced assays meet the highest standards. Future directions will likely involve greater harmonization with global regulatory bodies and the integration of artificial intelligence for automated quality control, further solidifying validated IHC as an indispensable tool in precision medicine.