Chromogenic vs Fluorescent IHC: A Strategic Guide for Biomedical Researchers
This article provides a comprehensive comparison of chromogenic and fluorescent detection methods in immunohistochemistry (IHC), tailored for researchers, scientists, and drug development professionals.
Chromogenic vs Fluorescent IHC: A Strategic Guide for Biomedical Researchers
Abstract
This article provides a comprehensive comparison of chromogenic and fluorescent detection methods in immunohistochemistry (IHC), tailored for researchers, scientists, and drug development professionals. It covers the fundamental principles, mechanisms, and historical context of both techniques, followed by a detailed analysis of their optimal applications and methodologies, including multiplexing and signal amplification. The guide also offers practical troubleshooting advice for common issues like autofluorescence and antigen masking, and concludes with a direct, data-driven comparison to empower informed method selection for specific research or diagnostic goals, from routine pathology to complex spatial phenotyping.
Core Principles: How Chromogenic and Fluorescent IHC Work
Defining Immunohistochemistry and Its Role in Biomedical Research
Immunohistochemistry (IHC) is a foundational technique in biomedical research and clinical diagnostics that uses antibody-epitope interactions to selectively label and visualize proteins within their physiological tissue context [1] [2]. This powerful method combines immunodetection with advanced microscopy to provide spatial localization of target antigens while preserving tissue architecture and cellular morphology [3]. First developed in the 1940s by Albert Hewett Coons and colleagues, who created the first fluorescently-labeled antibody to detect pneumococcal bacteria, IHC has evolved into an indispensable tool for understanding protein distribution, abundance, and subcellular localization [1] [2] [3].
The significance of IHC lies in its unique ability to provide spatial context that other protein detection methods like Western blot or ELISA cannot offer [1]. While techniques like Western blot analyze denatured proteins from lysed cells, IHC enables researchers to visualize protein expression within specific cell types and subcellular compartments in complex tissues, making it particularly valuable for studying heterogeneous samples such as tumors or brain regions [1]. This spatial resolution has made IHC crucial for both basic research investigating protein localization and clinical diagnostics, particularly in cancer pathology for tumor immunophenotyping [2] [3].
The ongoing evolution of IHC technology has centered largely on detection methodologies, primarily divided into chromogenic and fluorescent systems [4] [5]. Each approach offers distinct advantages and limitations that researchers must consider when designing experiments, particularly as the field moves toward increasingly multiplexed applications that enable simultaneous detection of multiple markers on a single tissue section [5] [6].
Detection Methodologies: Chromogenic vs. Fluorescent IHC
The fundamental distinction in contemporary IHC applications lies in the choice between chromogenic and fluorescent detection methods. Both approaches rely on antibody-antigen recognition but differ significantly in their detection chemistry, capabilities, and optimal applications.
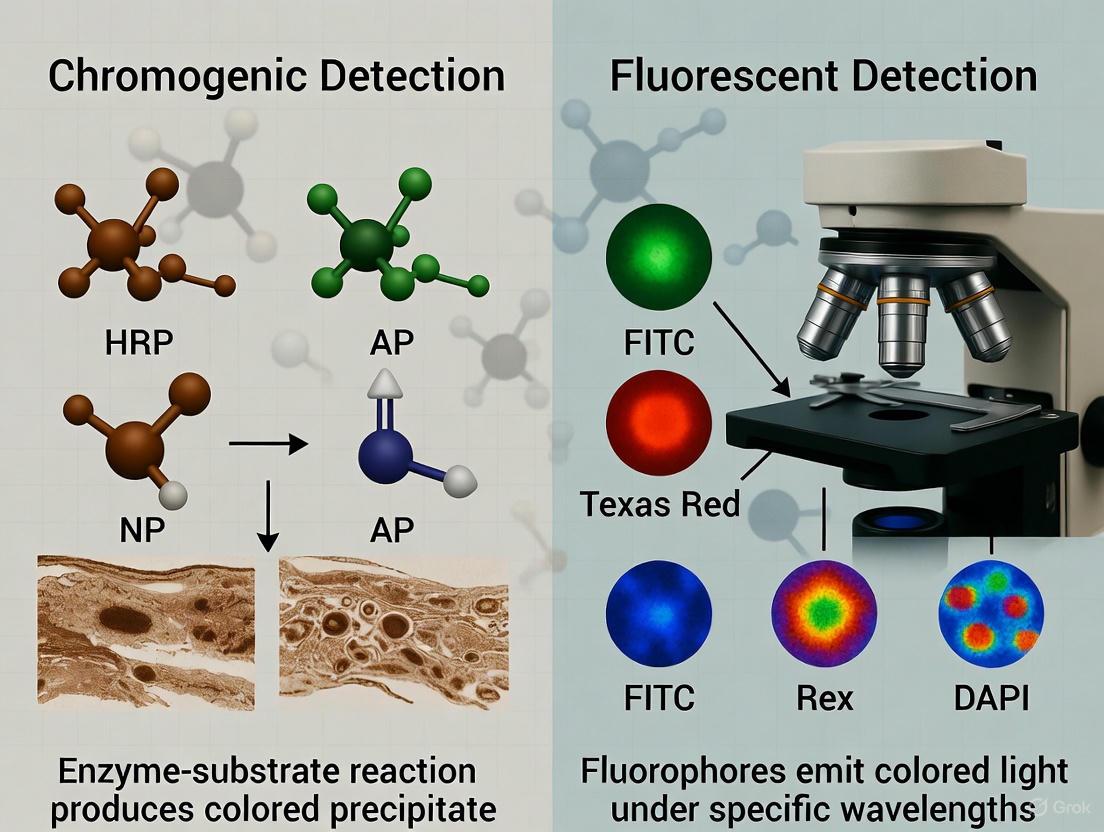
Chromogenic detection utilizes enzymes such as horseradish peroxidase (HRP) or alkaline phosphatase (AP) conjugated to antibodies. These enzymes catalyze reactions with substrate compounds like 3,3'-diaminobenzidine (DAB) to produce a colored precipitate at the antigen site [4] [2]. The resulting staining is visible under standard brightfield microscopy and produces a permanent, archivable record that can be stored for years without signal degradation [5] [7]. This method is particularly valuable for clinical diagnostics and situations where preserving tissue morphology is paramount [5].
Fluorescent detection employs fluorophore-conjugated antibodies that emit light at specific wavelengths when excited by an appropriate light source [4] [2]. This approach enables multiplexing, allowing researchers to detect multiple targets simultaneously by using fluorophores with distinct emission spectra [4] [5]. While fluorescent signals are more susceptible to photobleaching over time, they offer superior sensitivity and dynamic range, making them ideal for detecting low-abundance targets and for co-localization studies [4] [7].
Table 1: Comparison of Chromogenic and Fluorescent Detection Methods
| Feature | Chromogenic IHC | Fluorescent IHC/IF |
|---|---|---|
| Detection Chemistry | Enzyme-based (HRP/AP) with chromogenic substrates | Fluorophore-conjugated antibodies |
| Marker Capacity | 1-2 markers typically, 3-5 with multiplexing [5] [6] | 2-8 markers typically, up to 60 with advanced cycles [6] [7] |
| Equipment Needs | Standard brightfield microscope | Fluorescence microscope or specialized scanner |
| Signal Stability | Permanent, archivable for years [5] | Moderate, prone to photobleaching [4] [5] |
| Sensitivity/Dynamic Range | Moderate [7] | High to very high [7] |
| Co-localization Studies | Limited due to color blending [4] [5] | Excellent, independent signal analysis [4] [5] |
| Best Applications | Diagnostic workflows, morphology assessment, archival studies [5] [7] | Multiplexing, spatial biology, immune cell profiling, co-localization [5] [6] |
| Typical Cost/Complexity | Lower cost, simpler workflow [7] | Higher cost and complexity [7] |
The choice between these detection methods depends heavily on research objectives, available equipment, and sample characteristics. For single-target studies requiring permanent records and precise morphological assessment, particularly in clinical settings, chromogenic IHC remains the preferred choice [7]. For investigations requiring multiple target detection, protein co-localization analysis, or quantification of expression levels, fluorescent methods offer significant advantages [4] [5]. Emerging technologies such as tyramide signal amplification (TSA) have further enhanced the sensitivity of fluorescent detection, enabling identification of low-abundance targets that were previously challenging to detect [5] [6].
Detailed IHC Protocols and Methodologies
Sample Preparation and Fixation
Proper sample preparation is critical for successful IHC experiments, as it preserves tissue architecture and maintains antigen integrity. The process begins with tissue fixation, which prevents degradation and stabilizes protein structures. The most commonly used fixatives are aldehyde-based, including formaldehyde, formalin, and paraformaldehyde (PFA), which create methylene cross-links between proteins [1] [3]. While formalin (typically 10% neutral buffered) provides excellent tissue penetration and preservation of morphology, over-fixation can mask epitopes through excessive cross-linking, necessitating subsequent antigen retrieval steps [1] [2]. Alternative fixatives include glutaraldehyde for electron microscopy applications and alcohol-based precipitative fixatives (methanol, ethanol), though the latter may not preserve morphology as effectively and are often incompatible with antigen retrieval techniques [1].
Two primary fixation approaches are used: perfusion fixation, where fixative is delivered through the vascular system of an anesthetized animal prior to tissue dissection, and immersion fixation, where dissected tissue is placed directly into fixative [1]. Perfusion fixation generally provides more rapid and uniform fixation, particularly for larger tissues, and reduces non-specific staining in blood vessels [1]. Following fixation, tissues are typically embedded in paraffin (for microtome sectioning) or optimal cutting temperature (OCT) compound (for cryostat sectioning) to facilitate thin-sectioning [8] [3]. Section thickness generally ranges from 4-7μm, with thinner sections providing better cellular resolution but potentially losing some tissue context [2] [8].
Antigen Retrieval and Staining
For formalin-fixed paraffin-embedded (FFPE) tissues, antigen retrieval is typically necessary to reverse the cross-links formed during fixation that can mask epitopes [2] [3]. The most common approach is heat-induced epitope retrieval (HIER), which involves heating tissue sections in a buffer solution (commonly citrate buffer at pH 6.0 or EDTA buffer at pH 8.0) using methods such as microwave heating, water baths, or pressure cookers [2] [3]. The optimal buffer pH and heating method must be determined empirically for each antibody-epitope combination [3]. Alternatively, proteolytic-induced epitope retrieval using enzymes like proteinase K or pepsin can be effective for certain targets [3].
The core immunostaining process involves several key steps. First, tissues are blocked to reduce non-specific antibody binding using normal serum, bovine serum albumin (BSA), or commercial blocking buffers [2] [3]. For fluorescent detection, additional steps may be needed to quench endogenous autofluorescence [1]. Next, primary antibodies are applied and incubated for sufficient time to allow specific binding—typically 1-2 hours at room temperature or overnight at 4°C, though some protocols extend primary antibody incubation to 48 hours at 4°C for enhanced signal [8]. Following primary antibody incubation and washing, appropriate secondary antibodies are applied. These are typically conjugated either with enzymes (for chromogenic detection) or fluorophores (for fluorescent detection) [2]. For chromogenic detection, the enzyme substrate (e.g., DAB for HRP) is then applied to generate the colored precipitate [2]. Finally, counterstaining with hematoxylin (for chromogenic IHC) or DAPI (for fluorescent IHC) provides morphological context by labeling nuclei [2] [8].
Table 2: Key Research Reagent Solutions for IHC
| Reagent Category | Specific Examples | Function and Application Notes |
|---|---|---|
| Fixatives | Formalin, Paraformaldehyde (PFA), Glutaraldehyde | Preserve tissue architecture and prevent degradation through protein cross-linking [1] [3] |
| Embedding Media | Paraffin, OCT Compound | Stabilize tissue for sectioning; choice depends on sectioning method [8] [3] |
| Antigen Retrieval Buffers | Citrate Buffer (pH 6.0), EDTA Buffer (pH 8.0) | Reverse formaldehyde-induced cross-links to expose epitopes [2] [3] |
| Blocking Agents | Normal Serum, BSA, Non-fat Dry Milk | Reduce non-specific antibody binding to minimize background [2] |
| Primary Antibodies | Monoclonal vs. Polyclonal | Recognize target antigens; monoconal offer specificity, polyclonal can increase signal [2] |
| Detection Systems | HRP/DAB (Chromogenic), Fluorophores (e.g., Alexa Fluors) | Generate detectable signal at antigen site [4] [2] |
| Counterstains | Hematoxylin, DAPI | Provide morphological context by labeling nuclei [2] [8] |
| Mounting Media | Aqueous, Permanent | Preserve staining and create ideal refractive index for microscopy [3] |
Visualization and Analysis
The final stage of IHC involves microscopic visualization and analysis. Chromogenic staining is typically visualized using standard brightfield microscopy, while fluorescent detection requires fluorescence or confocal microscopy [2] [8]. For multiplex fluorescent IHC, advanced imaging systems such as spinning disk confocal microscopes or automated slide scanners with multiple filter sets are necessary to capture signals from different fluorophores [8] [6]. Subsequent image analysis ranges from qualitative assessment of staining patterns to quantitative analysis using densitometry for chromogenic signals or intensity measurements for fluorescent signals [2] [6]. For multiplex experiments, specialized software tools are employed for color deconvolution (chromogenic IHC) or spectral unmixing (fluorescent IHC) to separate overlapping signals from different markers [6]. These analytical approaches enable researchers to extract meaningful biological data regarding protein expression levels, cellular localization, and spatial relationships between different cell types within complex tissues.
Visualization of IHC Workflows and Signaling Relationships
The following diagrams illustrate key workflows and methodological relationships in immunohistochemistry, highlighting the divergent paths for chromogenic and fluorescent detection.
Advanced Applications and Future Directions
Immunohistochemistry has evolved far beyond single-marker detection, with multiplex IHC emerging as a powerful approach for analyzing complex biological systems. Both chromogenic and fluorescent methods have been adapted for multiplexing, though with different capabilities and limitations [5] [6]. Chromogenic multiplex IHC typically enables detection of 3-5 markers simultaneously, but can be limited by color blending and overlapping deposition [5] [6]. In contrast, fluorescent multiplex IHC using tyramide signal amplification (TSA) or cyclical staining approaches can detect up to 8 markers routinely, with advanced platforms capable of analyzing 10-60 markers on a single slide [6] [7].
These multiplex approaches have proven particularly valuable in cancer immunotherapy research, where understanding the tumor immune microenvironment is critical for predicting treatment response and understanding resistance mechanisms [6]. For example, multiplex IHC has identified promising predictive biomarkers such as intratumoral CD8+CD39+ cell density in non-small cell lung cancer and specific spatial relationships between PD-1+ and PD-L1+ cells in Merkel cell carcinoma [6]. The Society for Immunotherapy of Cancer has established best practice guidelines for multiplex IHC/IF to standardize these complex assays across laboratories [6].
Emerging technologies continue to push the boundaries of IHC capabilities. Methods such as multiplexed immunohistochemical consecutive staining on single slide (MICSSS) enable iterative staining and scanning cycles to achieve higher plexing with chromogenic detection [6]. Digital Spatial Profiling (DSP) technologies combine antibody-based detection with UV-cleavable DNA tags to generate quantitative data for 40-50 markers from specific regions of interest [6]. Mass spectrometry imaging approaches using antibodies tagged with elemental mass reporters further expand the multiplexing capacity while enabling simultaneous detection of proteins and metabolites [6].
The future of IHC in biomedical research will likely see increased integration of artificial intelligence and machine learning for image analysis, particularly as whole-slide imaging becomes more commonplace [6]. These computational approaches can identify complex patterns in multiplexed tissue data that may not be apparent through manual analysis, potentially revealing new biomarkers and biological insights [6]. As these technologies mature and become more standardized, IHC will continue to be an essential tool for bridging the gap between basic research and clinical application, particularly in personalized medicine and drug development.
Chromogenic immunohistochemistry is a foundational technique in diagnostic pathology and biomedical research, enabling the visualization of specific target biomarkers within tissue architectures through enzyme-mediated color deposition [9]. This method transforms invisible antibody-antigen interactions into stable, colored precipitates that can be analyzed using standard brightfield microscopy [10]. The technique's versatility and reliability have made it indispensable for studying disease pathogenesis, identifying therapeutic targets, and establishing histopathological diagnoses [9]. When framed within the broader context of chromogenic versus fluorescent detection methodologies, chromogenic IHC offers distinct advantages in signal permanence, accessibility with standard microscopy equipment, and established interpretation protocols familiar to pathologists worldwide [11] [12]. The fundamental principle underpinning chromogenic detection is the enzymatic conversion of soluble substrate molecules into insoluble colored compounds that deposit at sites of antibody binding, creating a permanent histological record of antigen expression patterns [10].
Fundamental Chemical Principles
Enzymatic Conversion and Color Development
The chromogenic mechanism centers on enzymatic catalysis that transforms soluble chemical substrates into insoluble colored precipitates. This process typically employs one of two principal enzymes: horseradish peroxidase (HRP) or alkaline phosphatase (AP), each with distinct substrate preferences and catalytic properties [10]. These enzymes are conjugated to secondary antibodies or polymeric detection systems that localize them precisely to sites of primary antibody binding, ensuring specific signal generation directly proportional to target antigen presence [11].
For HRP-based systems, the enzymatic reaction follows a well-defined chemical pathway: HRP + H₂O₂ + Chromogen → Oxidized Chromogen (Insoluble Precipitate) + H₂O + Oxidized HRP [10]
In this reaction cycle, HRP acts as a catalyst that utilizes hydrogen peroxide as an electron acceptor to oxidize the chromogenic substrate molecule. The oxidized chromogen intermediate subsequently polymerizes into a stable, insoluble compound that deposits at the antigen site [10]. This deposition creates a visual signal whose intensity correlates with target antigen abundance, allowing both qualitative localization and semi-quantitative assessment of biomarker expression [9].
Chromogen Chemistry and Properties
Chromogens differ in their chemical structures, resulting in varied visual properties and performance characteristics critical for experimental success:
Table: Common Chromogens in Immunohistochemistry
| Chromogen | Enzyme | Color | Stability | Solubility | Primary Applications |
|---|---|---|---|---|---|
| DAB (3,3'-Diaminobenzidine) | HRP | Brown | Highly stable, permanent | Alcohol and xylene insoluble | General use, high-resolution documentation [10] [11] |
| Fast Red | AP | Red | Prone to fading/alcohol soluble | Alcohol soluble | Tissues with endogenous pigmentation [10] |
| AEC (3-amino-9-ethylcarbazole) | HRP | Red | Moderate, fades with light | Alcohol soluble | Alternate to DAB for red spectrum [11] |
| BCIP/NBT | AP | Blue/ Purple | Stable | Alcohol insoluble | Multiplexing, high contrast needed [10] |
The most widely employed chromogen, 3,3'-diaminobenzidine (DAB), produces a robust brown precipitate that offers excellent dynamic range, high stability, and permanence ideal for long-term sample preservation [10] [11]. The DAB reaction product is insoluble in both water and alcohol, allowing compatibility with various dehydration and clearing steps during tissue processing [10]. This characteristic, combined with its crisp deposition and resistance to fading, has established DAB as the gold standard chromogen for both diagnostic applications and research investigations requiring archival quality specimens [11].
Detection Methodologies and Signal Amplification
Direct vs. Indirect Detection Systems
Chromogenic IHC employs either direct or indirect detection approaches, with indirect methods predominating due to their superior signal amplification capabilities [11]:
Direct Detection: A primary antibody directly conjugated to an enzyme (HRP or AP) binds to the target antigen. This method offers simplicity and rapid processing but lacks significant signal amplification, making it suitable only for highly abundant targets [11].
Indirect Detection: An unlabeled primary antibody binds to the antigen, followed by an enzyme-conjugated secondary antibody that recognizes the primary antibody's species and isotype. This approach generates substantial signal amplification through multiple secondary antibodies binding to each primary antibody [11].
Advanced Amplification Strategies
To enhance detection sensitivity for low-abundance targets, several sophisticated signal amplification systems have been developed:
Avidin-Biotin Complex (ABC) Method: Biotin-conjugated secondary antibodies link tissue-bound primary antibodies with preformed complexes of avidin and biotinylated enzyme (HRP or AP). The tetravalent nature of avidin allows formation of large complexes containing multiple enzyme molecules, significantly increasing the enzyme-to-antibody ratio and consequently boosting signal intensity [11].
Labeled Streptavidin-Biotin (LSAB) Method: This approach utilizes a biotin-conjugated secondary antibody followed by enzyme-conjugated streptavidin. The smaller complex size compared to ABC facilitates better tissue penetration, potentially enhancing sensitivity while maintaining high signal-to-noise ratios [11].
Polymer-Based Methods: Enzyme-linked polymer backbones conjugated with multiple secondary antibodies provide exceptional signal amplification while minimizing background. These systems typically offer superior sensitivity compared to ABC or LSAB methods with fewer processing steps [9].
Tyramide Signal Amplification (TSA): This ultra-sensitive technique employs HRP to catalyze the conversion of fluorochrome- or hapten-labeled tyramide molecules into highly reactive intermediates that covalently bind to tyrosine residues proximal to the enzyme site [10]. This deposition method can increase sensitivity by up to 100-fold compared to conventional methods, enabling detection of exceptionally low-abundance targets [10].
Experimental Protocols
Standard Chromogenic IHC Protocol for FFPE Tissues
This protocol outlines the complete procedure for chromogenic detection using formalin-fixed, paraffin-embedded (FFPE) tissue sections, incorporating critical troubleshooting steps to ensure reproducible results [13] [9].
Tissue Preparation and Sectioning
Fixation: Fix tissues promptly in 10% neutral buffered formalin (NBF) or 4% paraformaldehyde (PFA) for 12-24 hours at 4°C. The fixative volume should be 5-10 times the tissue volume to ensure complete penetration [13].
- Critical Step: Time to fixation is crucial. Begin fixation immediately after tissue removal as autolysis begins rapidly. Tissues can be temporarily stored in PBS with calcium and magnesium at 4°C for up to 4 hours if immediate fixation isn't possible [13].
Processing and Embedding:
Sectioning: Cut sections at 4-5μm thickness using a microtome. Sections thinner than 5μm ensure optimal antibody penetration [13].
Staining Procedure
Deparaffinization and Rehydration:
Antigen Retrieval:
- Heat-induced epitope retrieval (HIER): Place slides in citrate buffer (pH 6.0) or Tris-EDTA buffer (pH 9.0) and heat in a pressure cooker or water bath at 95-100°C for 20-30 minutes [9].
- Cool slides for 20-30 minutes at room temperature.
- Rinse with PBS or TBS (pH 7.4-7.6).
Peroxidase Blocking: Incubate with 3% hydrogen peroxide in methanol for 10 minutes to quench endogenous peroxidase activity [9].
- Rinse with wash buffer (PBS or TBS with 0.025% Tween-20).
Protein Blocking: Incubate with protein block (1-5% BSA, non-fat dry milk, or serum from the secondary antibody species) for 30 minutes to reduce non-specific binding [9].
Primary Antibody Incubation:
- Apply optimized concentration of primary antibody diluted in antibody diluent.
- Incubate in a humidified chamber for 1 hour at room temperature or overnight at 4°C for enhanced sensitivity [9].
- Rinse with wash buffer (3 × 5 minutes).
Secondary Antibody and Detection System:
- Apply enzyme-conjugated secondary antibody or polymer detection system for 30-60 minutes at room temperature [11].
- Rinse with wash buffer (3 × 5 minutes).
Chromogen Development:
- Prepare DAB solution: 20mg DAB + 3mg hydrogen peroxide in 100mL of 50mM Tris-HCl buffer, pH 7.6 [9].
- Incubate with DAB solution for 3-10 minutes, monitoring development under a microscope.
- Stop reaction by immersing in distilled water.
Counterstaining and Mounting:
- Counterstain with Mayer's hematoxylin for 10-30 seconds [9].
- Rinse in running tap water for 5 minutes to blue the nuclei.
- Dehydrate through graded ethanols (70%, 80%, 95%, 100% - 30 seconds each) and clear in xylene (3 × 2 minutes).
- Mount with permanent mounting medium and coverslip.
Multiplex Chromogenic IHC Protocol
This protocol enables the simultaneous detection of two or more antigens on a single tissue section through sequential staining with different chromogens [13].
First Antigen Detection:
- Complete steps 4.1.2.1-4.1.2.7 for the first primary antibody.
- Use DAB (brown) as the first chromogen [13].
Antibody Stripping:
- Incubate slides in stripping buffer (e.g., glycine-HCl buffer, pH 2.2) for 1-2 hours to dissociate primary-secondary antibody complexes [13].
- Rinse thoroughly with wash buffer.
Second Antigen Detection:
Counterstaining and Mounting:
- Counterstain lightly with hematoxylin.
- Aqueous mounting medium may be required for alcohol-soluble chromogens [13].
Research Reagent Solutions
Table: Essential Reagents for Chromogenic IHC
| Reagent Category | Specific Examples | Function | Technical Notes |
|---|---|---|---|
| Primary Antibodies | Rabbit monoclonal, Mouse monoclonal | Binds specifically to target antigen | Validate for FFPE compatibility; optimize concentration via titration [9] |
| Detection Systems | Envision Flex (Agilent), Simple Stain Max (Nichirei), Novolink (Leica) | Links primary antibody to enzyme for signal generation | Polymer systems offer superior sensitivity over ABC/LSAB methods [9] |
| Enzyme Conjugates | Horseradish Peroxidase (HRP), Alkaline Phosphatase (AP) | Catalyzes chromogen conversion | HRP is robust; AP requires TBS buffer (PBS inhibits) [10] [9] |
| Chromogens | DAB, Fast Red, AEC, BCIP/NBT | Forms visible precipitate at antigen site | DAB is permanent and alcohol-insoluble; others vary in stability [10] [11] |
| Antigen Retrieval | Citrate buffer (pH 6.0), Tris-EDTA (pH 9.0) | Reverses formaldehyde cross-linking | pH and heating method critically impact retrieval efficiency [9] |
| Blocking Reagents | BSA, normal serum, casein | Reduces non-specific antibody binding | Match serum species to secondary antibody host [9] |
| Amplification Systems | Tyramide Signal Amplification (TSA) | Enhances sensitivity for low-abundance targets | Can increase detection 100-fold; risk of high background [10] [9] |
Comparative Analysis: Chromogenic vs. Fluorescent Detection
Table: Chromogenic vs. Fluorescent Detection Comparative Analysis
| Parameter | Chromogenic IHC | Fluorescent IHC |
|---|---|---|
| Sensitivity | High sensitivity with amplification methods (ABC, polymer) [11] | Lower inherent sensitivity, but tyramide amplification available [15] |
| Multiplexing Capacity | Limited to 2-3 targets due to color mixing; requires spatial separation [10] | Superior; 5+ targets possible with spectral separation [15] [12] |
| Co-localization Analysis | Challenging; opaque chromogens obscure underlying signals [10] | Excellent; precise co-localization with spectral imaging [15] |
| Signal Stability | Long-term (years); resistant to photobleaching [11] | Limited (weeks-months); susceptible to photobleaching [15] |
| Equipment Requirements | Standard brightfield microscope [11] | Fluorescence microscope with specific filter sets [15] |
| Spatial Resolution | Limited by chromogen precipitate size ("fuzziness") [15] | High resolution; suitable for subcellular localization [15] |
| Quantification Capability | Semi-quantitative; enzymatic nature prevents true quantification [15] | Highly quantitative with appropriate standards and imaging [15] |
| Technical Complexity | More processing steps; enzyme substrates required [15] | Fewer processing steps; no enzyme reactions needed [15] |
Advanced Applications and Multiplexing Strategies
Multiplex Chromogenic IHC
The development of chromogenic multiplexing has expanded the analytical capabilities of brightfield microscopy, allowing simultaneous detection of multiple biomarkers within tissue architecture [10]. Successful implementation requires careful consideration of several factors:
Biomarker Expression Patterns: Select markers expressed in distinct cellular compartments (nuclear, cytoplasmic, membranous) to facilitate clear discrimination between signals [10].
Chromogen Selection Strategy: Employ high-contrast color combinations with minimal spectral overlap. Traditional pairings include DAB (brown) with Fast Red (red) or Vector Blue (blue) [10]. Newer chromogen technologies such as DISCOVERY Purple, Yellow, and Teal provide additional options with narrower absorption spectra that enable color mixing effects for co-localization studies [10].
Staining Sequence: Always apply the least robust chromogen first when sequential staining is employed, followed by more stable precipitates in subsequent rounds [13].
Translucent Chromogens for Co-localization
Recent innovations in chromogen technology have introduced translucent chromogens with narrow absorption spectra that enable brightfield co-localization analysis previously only possible with fluorescence microscopy [10]. When these chromogens deposit in the same subcellular compartment, they produce distinct color shifts that indicate protein co-localization:
- DISCOVERY Purple + DISCOVERY Yellow: Fiery red/orange color shift [10]
- DISCOVERY Teal + DISCOVERY Purple: Indigo blue to deep purple color [10]
- DISCOVERY Teal + DISCOVERY Yellow: Leafy green appearance [10]
This translucency phenomenon occurs because narrow-absorption chromogens leave more of the visual spectrum available for other dyes to occupy when deposited in the same physical space, allowing color mixing to be observed rather than simple occlusion [10].
Troubleshooting and Technical Considerations
Common Pitfalls and Solutions
High Background Staining:
Weak or Absent Signal:
Endogenous Enzyme Activity:
Antibody Cross-Reactivity in Multiplexing:
Special Considerations for Tissue Types
Tissues with Endogenous Pigments (e.g., melanin in melanoma): Use chromogens with colors distinct from the endogenous pigment. DAB may be difficult to differentiate from melanin; red or purple chromogens provide better contrast [10].
Tissues with High Endogenous Biotin (e.g., liver, kidney): Avoid biotin-based detection systems (ABC, LSAB) as they produce high background. Instead, use biotin-free polymer systems [9].
Frozen Sections: Often exhibit higher background due to suboptimal fixation. Increase blocking time and consider using Fab fragment secondary antibodies to reduce non-specific binding [13].
Chromogenic IHC remains an indispensable methodology in both research and diagnostic pathology, offering robust, reproducible detection of protein biomarkers with standard laboratory equipment. The enzyme-based color deposition mechanism provides a stable, permanent record of antigen expression that integrates seamlessly with traditional histopathological assessment. While fluorescent detection methods excel in multiplexing capacity and co-localization studies, chromogenic IHC maintains distinct advantages in signal permanence, accessibility, and established interpretive frameworks. Ongoing innovations in chromogen chemistry, particularly the development of translucent chromogens with narrow absorption spectra, continue to expand the applications of brightfield multiplexing. By understanding the fundamental principles, optimized protocols, and appropriate applications outlined in this technical review, researchers can effectively leverage chromogenic IHC to address diverse experimental questions in biomedical research and drug development.
Within the broader research on chromogenic versus fluorescent detection in IHC, understanding the physical principles of fluorescence is paramount for selecting the appropriate detection method. Fluorescent detection relies on the conjugation of antibodies to fluorophores, which are photoreactive chemical compounds that absorb light at a specific wavelength and re-emit it at a longer wavelength [16] [17]. This mechanism provides a powerful tool for the highly sensitive, multiplexed detection of multiple protein targets within a single tissue sample, a key advantage over chromogenic methods which are limited by color overlap [5]. The efficacy of this process is governed by the fluorophore's excitation and emission properties, its quantum yield, and its stability in the experimental environment.
The Jablonski Diagram and Stokes Shift
The process of fluorescence can be effectively visualized using a Jablonski energy diagram [17]. Upon absorbing a photon of light, a fluorophore's electrons are elevated from a ground state to a higher-energy, vibrational excited state in a femtoseconds-scale process [17]. This excited state is unstable. The electrons first rapidly lose vibrational energy to the surrounding environment as heat, relaxing to the lowest excited singlet state. From this state, the electrons then return to the ground state, emitting the energy difference as a photon of light [17].
A fundamental property of this process is the Stokes Shift, which denotes that the emitted photon has a longer wavelength (lower energy) than the absorbed photon [17]. This energy difference is due to the initial loss of vibrational energy. The greater the Stokes shift, the easier it is to separate the intense excitation light from the weaker emitted fluorescence using optical filters, which is critical for achieving high specimen contrast in microscopy [17].
Quantitative Measures of Fluorescence Efficiency
The efficiency of a fluorophore is quantitatively described by its molecular extinction coefficient and its fluorescence quantum yield [17]. The molecular extinction coefficient indicates how efficiently a fluorophore absorbs excitation light at a specific wavelength [17]. The fluorescence quantum yield (Φ) is defined as the ratio of the number of photons emitted to the number of photons absorbed [18]. It is calculated as:
Φ = kf / (kf + Σknr)
Where:
- kf is the rate constant for radiative relaxation (fluorescence).
- Σknr is the sum of the rate constants for all non-radiative relaxation processes (e.g., heat loss, resonance energy transfer) [18].
A quantum yield of 1.0 (or 100%) describes a theoretically perfect process where every absorbed photon results in an emitted photon. In practice, quantum yields below 1 are standard due to energy losses through non-radiative pathways [18]. The intrinsic brightness of a fluorophore is a function of both its extinction coefficient and its quantum yield [17].
Table 1: Fluorescence Quantum Yields of Common Fluorophores
| Compound | Solvent | Excitation Wavelength (nm) | Emission Wavelength (nm) | Quantum Yield (Φ) |
|---|---|---|---|---|
| Fluorescein | Water | 496 | 515 | 0.95 ± 0.03 [18] |
| Fluorescein | Water | 437 | 515 | 0.92 [17] |
| Rhodamine B | Ethanol | 555 | 627 | 0.97 [17] |
| Rhodamine 6G | Ethanol | 488 | - | 0.94 [18] |
| Quinine | 0.1 M HClO₄ | 347.5 | - | 0.60 ± 0.02 [18] |
| Acridine Orange | Ethanol | 493 | 535 | 0.46 [17] |
| Tryptophan | Water | 280 | - | 0.13 ± 0.01 [18] |
| Eosin | Water | 521 | 544 | 0.16 [17] |
Experimental Protocol for Fluorescent IHC
The following protocol is adapted for fluorescent detection in formalin-fixed, paraffin-embedded (FFPE) tissue sections [19].
Sample Preparation and Staining Workflow
The entire process, from sample preparation to imaging, can be summarized in the following workflow:
Detailed Protocol Steps
1. Sample Preparation (FFPE Tissue Sections)
- Deparaffinization and Rehydration: Incubate slides in two changes of xylene for 3 minutes each. Rehydrate through a series of ethanol solutions (100%, 100%, 95%, 70%, 50%) for 3 minutes each. Rinse in running water for 10 minutes. Do not allow slides to dry out from this point forward [19].
- Antigen Retrieval (Heat-Induced Epitope Retrieval - HIER): Boil slides in 10 mM sodium citrate buffer (pH 6.0), maintaining temperature at approximately 98°C for 20 minutes using a pressure cooker, microwave, or steamer. Cool slides completely before proceeding [19].
2. Blocking and Antibody Staining
- Blocking Non-specific Binding: Draw a border around the tissue section using a hydrophobic pen. Permeabilize tissue by adding wash buffer (1X PBS with 0.025% Triton X-100) and incubating for 10 minutes at room temperature. Incubate with blocking buffer (e.g., serum or protein solution) for 1 hour at room temperature in a humidity chamber [19].
- Primary Antibody Incubation: Dilute the primary antibody in blocking buffer. The optimal dilution must be determined empirically via a dilution series. Incubate tissue sections with the antibody solution overnight at 4°C in a humidity chamber [19].
- Secondary Antibody Incubation: Wash sections three times with wash buffer for 10 minutes each. Dilute the fluorophore-conjugated secondary antibody in blocking buffer (typical commercial dilutions range from 1:500 to 1:1000). Incubate tissue sections with this solution for 1–2 hours at room temperature. Wash sections three times with wash buffer for 10 minutes each, protected from light [19].
3. Counterstaining and Mounting
- Counterstaining (Optional): To stain cell nuclei, incubate sections with DAPI (0.5 μg/mL) for 5 minutes at room temperature, followed by a 5-minute wash [19].
- Mounting: Rinse slides in distilled water to remove excess salts. Dab away excess moisture and apply an anti-fade mounting medium to preserve the fluorescent signal. Mount coverslips and seal edges with nail polish, particularly if using an inverted microscope. Store slides at 4°C in the dark [19].
Buffers and Reagents
- 10X Phosphate Buffered Saline (PBS)
- Wash Buffer: 1X PBS + 0.025% Triton X-100 [19].
- Blocking Buffer: 1-5% serum (from the species of the secondary antibody) or 1% Bovine Serum Albumin (BSA) in wash buffer [19].
- 10 mM Sodium Citrate Buffer (pH 6.0) for antigen retrieval [19].
- Anti-fade Mounting Medium [19].
The Scientist's Toolkit: Essential Research Reagents
Table 2: Key Reagents for Fluorescent IHC
| Item | Function/Benefit |
|---|---|
| Fluorophore-conjugated Secondary Antibodies | Binds to primary antibody to deliver the fluorescent signal. Enables multiplexing with different colors [20]. |
| Anti-fade Mounting Media (e.g., with DABCO, n-propyl gallate) | Reduces photobleaching (fading) by inhibiting photochemical reactions, thereby preserving signal intensity during storage and imaging [17]. |
| DAPI (4',6-diamidino-2-phenylindole) | A common nuclear counterstain that binds to double-stranded DNA, emitting blue fluorescence. Helps visualize tissue architecture and cellular location [19]. |
| Hydrophobic Pen | Creates a liquid-repellent barrier around the tissue section, allowing for minimal reagent volumes to be used during staining steps [19]. |
| Permeabilization Agent (e.g., Triton X-100) | A detergent that creates pores in cell membranes, allowing antibodies to access intracellular targets [19]. |
| Tyramide Signal Amplification (TSA) Reagents | Enzyme-mediated system that deposits numerous fluorophore-labeled tyramide molecules at the target site, dramatically amplifying the signal for detecting low-abundance proteins [5]. |
Critical Considerations for Experimental Design
Fluorescence Microscopy and Filter Configuration
In fluorescence microscopy, the overlap between the higher-wavelength end of the excitation spectrum and the lower-wavelength end of the emission spectrum must be managed. This is achieved using a filter cube comprising three elements: an excitation filter (allows only the excitation wavelength to pass), a dichromatic beamsplitter (reflects excitation light onto the specimen and transmits emitted light), and an emission (or barrier) filter (blocks stray excitation light and allows only the emission wavelength to pass) [17]. Proper filter selection is critical for achieving high signal-to-noise ratio.
Technical Challenges and Mitigation
- Photobleaching: The irreversible decomposition of fluorescent molecules due to light exposure in the presence of oxygen, leading to diminished signal [17]. Mitigation: Use anti-fade mounting reagents and minimize light exposure during experiments and storage [17].
- Autofluorescence: Some tissue types (e.g., spleen, kidney) or fixatives like glutaraldehyde can emit light naturally, creating background signal [5]. Mitigation: Use multispectral imaging systems to separate the specific signal from background autofluorescence [5].
- Environmental Effects: A fluorophore's quantum yield is highly sensitive to its local environment. Variables such as solvent polarity (hydrophobicity), pH, ionic concentration, and the presence of quenching agents can profoundly alter fluorescence intensity and lifetime [17]. For example, the quantum yield of ANS probe molecules can increase from ~0.002 in aqueous buffer to nearly 0.4 when in a nonpolar environment or bound to albumin [18].
Comparison with Chromogenic Detection
While this article focuses on the fluorescent mechanism, its utility is best understood in contrast to chromogenic detection. The following table summarizes key differences relevant to a research thesis comparing the two methodologies.
Table 3: Fluorescent vs. Chromogenic IHC at a Glance
| Feature | Fluorescent IHC | Chromogenic IHC |
|---|---|---|
| Detection Mechanism | Light emission from excited fluorophores [21]. | Enzymatic (e.g., HRP) conversion of substrate into an insoluble, colored precipitate [16]. |
| Multiplexing Capacity | High (5-10+ markers) with spectral separation [5]. | Low (3-5 markers) due to color blending [5]. |
| Sensitivity | High, especially with signal amplification (TSA) [5]. | Generally high when paired with amplification (ABC, LSAB) [16]. |
| Signal Durability | Prone to fading; requires anti-fade agents [16] [17]. | Permanent, stable for years [16] [5]. |
| Quantitative Analysis | Excellent; offers a wide, linear signal range for accurate quantification [5]. | Basic; semi-quantitative at best due to precipitate density [5]. |
| Instrumentation | Requires fluorescence microscope or scanner [5]. | Standard brightfield microscope [5]. |
| Best for Co-localization | Excellent; multiple markers can be independently analyzed and overlaid [16]. | Poor; overlapping stains can blend, yielding confusing results [16]. |
Direct vs. Indirect Detection Methods for Signal Amplification
Immunohistochemistry (IHC) is an indispensable technique that combines immunological, biochemical, and histological principles to detect specific antigens within tissue samples [22]. The core principle of IHC relies on the specific binding of antibodies to target antigens, allowing for the visualization and localization of proteins within the morphological context of tissue [22]. Detection and signal amplification systems are critical components that determine the sensitivity, specificity, and overall success of IHC experiments, particularly in research and drug development settings where accurate protein localization and quantification are paramount.
The choice between direct and indirect detection methods represents a fundamental decision point in IHC experimental design, with significant implications for signal strength, protocol complexity, and multi-target detection capabilities. This application note provides a comprehensive comparison of these methodologies, detailed protocols for implementation, and practical guidance for researchers navigating the complexities of IHC detection systems within the broader context of chromogenic versus fluorescent detection research.
Fundamental Principles of IHC Detection
Antibody-Antigen Interactions in IHC
IHC detection systems leverage the highly specific binding between antibodies and their target antigens to identify proteins of interest within tissue architecture. This specific interaction forms the foundation upon which all detection methods are built [22]. The primary antibody recognizes and binds to a specific epitope on the target antigen, and this binding event is then visualized through various detection systems that amplify the signal to detectable levels [22].
Two main types of antibodies are utilized in IHC: monoclonal and polyclonal. Monoclonal antibodies recognize a single epitope on the antigen, providing high specificity but potentially lower signal, while polyclonal antibodies recognize multiple epitopes, often resulting in higher sensitivity but increased potential for cross-reactivity [22]. The choice between monoclonal and polyclonal antibodies depends on the specific application requirements for specificity versus signal intensity.
Detection System Classifications
IHC detection methods can be classified according to several criteria. The primary distinction lies between direct and indirect methods, which differ in their number of procedural steps and signal amplification capabilities [23]. Additionally, detection systems can be categorized based on the label type used for visualization, with chromogenic and fluorescent detection being the two principal approaches [15] [24].
Chromogenic detection utilizes enzymes such as horseradish peroxidase (HRP) or alkaline phosphatase (AP) that convert soluble substrates into insoluble colored precipitates at the antigen site [24]. In contrast, fluorescent detection employs fluorophores that emit light of specific wavelengths when excited by light of appropriate wavelength [15]. Each approach offers distinct advantages and limitations in terms of sensitivity, multiplexing capability, and experimental requirements.
Direct Detection Methods
Principle and Workflow
Direct detection methods represent the simplest IHC approach, involving a single incubation step where a primary antibody directly conjugated to a detection label (enzyme or fluorophore) binds to the target antigen [23]. This method is also referred to as the one-step method due to its minimal procedural requirements. The conjugation of the detection label to the primary antibody eliminates the need for secondary antibody incubation, streamlining the overall process.
The fundamental workflow for direct detection includes: (1) incubation with the labeled primary antibody, (2) washing to remove unbound antibody, and (3) visualization through chromogenic development or fluorescence microscopy [15]. For chromogenic detection, an additional substrate incubation step is required for enzyme-based labels [24].
Diagram 1: Direct detection method workflow
Experimental Protocol for Direct Detection
Materials Required:
- Formalin-fixed, paraffin-embedded (FFPE) or frozen tissue sections
- Labeled primary antibody (HRP-conjugated or fluorophore-conjugated)
- Appropriate buffer (phosphate-buffered saline, PBS or Tris-buffered saline, TBS)
- Blocking solution (e.g., 1% bovine serum albumin in PBS)
- Substrate solution (for chromogenic detection: DAB, AEC, etc.)
- Counterstain (hematoxylin for chromogenic, DAPI for fluorescent)
- Appropriate mounting medium
Methodology:
- Tissue Preparation: Cut tissue sections at 3-5 μm thickness. For FFPE tissues, perform deparaffinization and rehydration through xylene and graded alcohol series [22].
- Antigen Retrieval: Perform heat-induced or enzymatic epitope retrieval as required for the target antigen [9].
- Blocking: Incubate sections with blocking solution for 30 minutes at room temperature to reduce non-specific binding [9].
- Primary Antibody Incubation: Apply directly conjugated primary antibody at optimal dilution in blocking buffer. Incubate for 1-2 hours at room temperature or overnight at 4°C [15].
- Washing: Wash slides 3×5 minutes with appropriate buffer.
- Signal Detection:
- Chromogenic: Incubate with appropriate enzyme substrate (e.g., DAB for HRP) until desired stain intensity develops [24].
- Fluorescent: Proceed directly to mounting if fluorophore-conjugated.
- Counterstaining and Mounting: Apply appropriate counterstain, dehydrate (chromogenic only), clear (chromogenic only), and mount with compatible mounting medium [24].
Advantages and Limitations
Direct detection offers several advantages, including rapid protocol completion due to fewer steps, reduced potential for cross-reactivity without secondary antibodies, and minimal background staining in optimized conditions [23]. These characteristics make it particularly suitable for detecting highly expressed antigens and for multiplexing applications where multiple targets are visualized simultaneously [25].
However, this method suffers from significant limitations, including potentially lower signal intensity due to the absence of signal amplification, limited options for commercially available conjugated primary antibodies, and the expense of conjugating primary antibodies in-house [23]. The reduced sensitivity makes direct detection unsuitable for detecting low-abundance antigens, which represents a substantial constraint for many research applications.
Indirect Detection Methods
Principle and Workflow
Indirect detection methods employ a two-step approach that introduces a secondary antibody for signal amplification [23]. In this system, an unlabeled primary antibody binds specifically to the target antigen, followed by a labeled secondary antibody that recognizes and binds to the primary antibody. This configuration allows multiple secondary antibodies to attach to each primary antibody, significantly amplifying the signal compared to direct methods.
The indirect approach encompasses several specific techniques with varying levels of complexity and amplification, including standard secondary antibody methods, avidin-biotin complex (ABC) systems, polymer-based methods, and tyramide signal amplification (TSA) systems [9] [24]. Each of these variations offers different degrees of sensitivity and optimization requirements.
Diagram 2: Indirect detection method workflow
Common Indirect Detection Systems
Standard Secondary Antibody Method
The simplest indirect approach uses a fluorophore- or enzyme-conjugated secondary antibody directed against the species and immunoglobulin type of the primary antibody. This method typically provides 5-10 fold signal amplification compared to direct detection, as multiple secondary antibodies can bind to a single primary antibody [23].
Avidin-Biotin Complex (ABC) Method
The ABC method utilizes the high-affinity interaction between avidin (or streptavidin) and biotin [24]. In this system, a biotinylated secondary antibody is applied, followed by a pre-formed complex of avidin/streptavidin conjugated with multiple enzyme molecules. This creates extensive signal amplification, though it may increase background due to endogenous biotin in certain tissues [24].
Labeled Streptavidin-Biotin (LSAB) Method
The LSAB method is a variation of the ABC technique that uses enzyme-conjugated streptavidin to bind to biotinylated secondary antibodies [24]. Streptavidin has a more neutral isoelectric point than avidin and lacks carbohydrate groups, resulting in reduced non-specific tissue binding and lower background staining [24].
Polymer-Based Methods
Polymer methods employ dextran or other polymer backbones to which multiple enzyme molecules and secondary antibodies are attached [24]. These systems offer enhanced sensitivity without requiring biotin, thus eliminating issues with endogenous biotin activity. Recent micro-polymer methods use smaller detection complexes for better tissue penetration and reduced background [26] [9].
Tyramide Signal Amplification (TSA)
TSA systems, also known as catalyzed signal amplification (CSA), utilize the catalytic activity of HRP to deposit numerous biotin- or fluorophore-labeled tyramine molecules at the antigen site [9]. This method provides extremely high sensitivity, capable of detecting low-abundance antigens, but requires careful optimization to minimize background staining [9].
Experimental Protocol for Indirect Detection
Materials Required:
- Formalin-fixed, paraffin-embedded (FFPE) or frozen tissue sections
- Unlabeled primary antibody
- Labeled secondary antibody (HRP-conjugated, AP-conjugated, or fluorophore-conjugated)
- Blocking solution (appropriate normal serum or protein block)
- Appropriate buffers (PBS or TBS)
- Antigen retrieval solutions
- Substrate solution (DAB, AEC, etc., for chromogenic detection)
- Counterstain and mounting medium
Methodology:
- Tissue Preparation and Antigen Retrieval: Follow steps 1-3 as described for direct detection [22] [9].
- Primary Antibody Incubation: Apply unlabeled primary antibody at optimal dilution. Incubate for 1-2 hours at room temperature or overnight at 4°C [9].
- Washing: Wash slides 3×5 minutes with appropriate buffer.
- Secondary Antibody Incubation: Apply species-specific labeled secondary antibody at optimal dilution. Incubate for 30-60 minutes at room temperature [23].
- Washing: Wash slides 3×5 minutes with appropriate buffer.
- Signal Amplification (if using ABC, polymer, or TSA systems): Apply appropriate amplification reagents according to manufacturer's instructions [24].
- Signal Detection: Proceed with chromogenic or fluorescent detection as described in the direct method protocol [24].
- Counterstaining and Mounting: Apply appropriate counterstain and mount with compatible medium [24].
Advantages and Limitations
Indirect detection methods offer significant advantages, including substantial signal amplification through multiple secondary antibody binding, increased sensitivity for detecting low-abundance antigens, and greater flexibility through the wide availability of conjugated secondary antibodies [23]. The approach is also more cost-effective as unlabeled primary antibodies are less expensive, and a single conjugated secondary antibody can be used with multiple primaries from the same species [23].
The limitations of indirect detection include longer protocol duration with additional incubation and washing steps, increased potential for cross-reactivity and non-specific background staining, and possible interference from endogenous biotin or immunoglobulins in certain tissues [23] [24]. These factors necessitate more extensive optimization and control experiments to ensure specificity.
Comparative Analysis of Detection Methods
Performance Characteristics Comparison
Table 1: Comprehensive comparison of direct and indirect detection methods
| Parameter | Direct Detection | Indirect Detection | Polymer-Based Methods | ABC Method |
|---|---|---|---|---|
| Sensitivity | Low to moderate | Moderate to high | High | Very high |
| Signal Amplification | None (1:1) | 5-10 fold | 10-50 fold | 50-100 fold |
| Protocol Steps | Minimal (simpler) | Multiple (complex) | Multiple (complex) | Extensive (most complex) |
| Protocol Duration | Shorter (1-2 hours) | Longer (2-4 hours) | Longer (2-4 hours) | Longest (3-5 hours) |
| Background Staining | Lower | Moderate | Low to moderate | Higher (endogenous biotin) |
| Multiplexing Capability | Excellent | Good with optimization | Good with optimization | Limited |
| Cross-reactivity Potential | Low | Higher | Moderate | Moderate to high |
| Cost-effectiveness | Lower for small-scale | Higher for small-scale | Moderate | Moderate |
| Recommended Use Cases | Highly expressed antigens, multiplexing | Routine IHC, moderate expression targets | Low abundance targets, FFPE tissues | Extremely low abundance targets |
Chromogenic vs. Fluorescent Detection in IHC
The choice between chromogenic and fluorescent detection impacts the performance and application of both direct and indirect methods. Each approach offers distinct advantages that make it suitable for specific research scenarios.
Table 2: Chromogenic versus fluorescent detection methods
| Characteristic | Chromogenic Detection | Fluorescent Detection |
|---|---|---|
| Signal Type | Colored precipitate | Light emission |
| Sensitivity | Usually higher due to amplification [24] | Lower for single labeling, high with TSA |
| Signal Stability | Long-term (years) [24] | Limited (weeks to months with antifade) [15] |
| Spatial Resolution | Limited by enzyme diffusion | High, especially with confocal microscopy [15] |
| Multiplexing Capability | Limited to 2-3 targets [25] | Excellent (5+ targets with spectral separation) [15] |
| Microscope Requirements | Standard brightfield microscope | Fluorescence microscope with specific filters [15] |
| Quantification | Semi-quantitative, challenging | Highly quantitative with appropriate software [15] |
| Background Issues | Endogenous enzyme activity | Autofluorescence, non-specific binding |
| Permanent Record | Yes, does not fade | Fades over time, requires digital preservation |
| Compatible Tissue Types | All types, including autofluorescent tissues | Optimal with low autofluorescence tissues |
Advanced Applications and Multiplexing Strategies
Multiplex IHC Detection Systems
Multiplex IHC enables simultaneous detection of multiple antigens within a single tissue section, providing critical information about cellular interactions, cell populations, and protein co-localization. The successful implementation of multiplex IHC requires careful selection of detection systems and visualization methods [25].
For chromogenic multiplexing, careful selection of chromogen colors with sufficient contrast is essential. Lighter chromogens are generally easier to visualize when multiple targets are present, and the sequence of chromogen application must be optimized to prevent masking of previous signals [25]. DAB, producing a permanent brown precipitate, often serves as an excellent choice for one target, complemented by red (AEC) or blue (BCIP/NBT) chromogens for additional targets [24].
Fluorescent multiplexing offers greater flexibility for detecting multiple targets, with the main consideration being minimal spectral overlap between fluorophores [15]. Proper experimental design must ensure that secondary antibodies are species-specific to prevent cross-reactivity, or alternatively, employ direct conjugation of fluorophores to primary antibodies [25].
Special Considerations for Drug Development Applications
In drug development, IHC serves crucial roles in target validation, pharmacodynamic biomarker assessment, and patient stratification [22]. Detection methods must provide robust, reproducible results that can withstand regulatory scrutiny. Key considerations include:
- Validation of Detection Systems: Antibodies and detection systems must be thoroughly validated using appropriate positive and negative controls [9].
- Quantification Requirements: Fluorescent detection often provides superior quantification capabilities for determining target expression levels [15].
- Reproducibility Across Laboratories: Standardized protocols and detection systems are essential for multi-center trials [22].
- Archival Stability: Chromogenic detection using DAB provides permanent slides that can be stored for years, which is valuable for regulatory documentation [24].
Troubleshooting and Optimization Guidelines
Common Pitfalls and Solutions
Both direct and indirect detection methods present specific challenges that require systematic troubleshooting:
High Background Staining:
- Direct method causes: Overconcentrated primary antibody, insufficient blocking.
- Indirect method causes: Endogenous biotin activity (in ABC systems), cross-reactive secondary antibodies, insufficient washing.
- Solutions: Optimize antibody concentrations, include additional blocking steps (e.g., endogenous biotin block for ABC methods), increase washing stringency [9] [24].
Weak or Absent Signal:
- Direct method causes: Inadequate primary antibody concentration, loss of antigenicity, inappropriate label.
- Indirect method causes: Incompatible secondary antibody, enzyme inhibition, expired substrates.
- Solutions: Perform antibody titration experiments, optimize antigen retrieval, verify reagent activity with positive controls [9].
Inconsistent Results:
- Causes: Variable staining conditions, improper reagent storage, section thickness variations.
- Solutions: Standardize protocols, aliquot antibodies to avoid freeze-thaw cycles, implement rigorous quality control measures [9].
Quality Control and Validation
Robust quality control is essential for reliable IHC results, particularly in research and drug development contexts. The following controls should be implemented:
- Positive Controls: Tissues known to express the target antigen to validate protocol and reagents [22] [9].
- Negative Controls: Omission of primary antibody to assess background staining [22].
- Isotype Controls: Irrelevant antibodies of the same isotype to evaluate non-specific binding.
- Tissue Controls: Tissues known to lack the target antigen to verify specificity.
Validation of detection systems should demonstrate sensitivity, specificity, and reproducibility using independent methods where possible [9]. For quantitative applications, establishment of linear dynamic range and limit of detection is critical.
Research Reagent Solutions
Table 3: Essential reagents for IHC detection systems
| Reagent Category | Specific Examples | Function | Application Notes |
|---|---|---|---|
| Enzymes | Horseradish Peroxidase (HRP) | Catalyzes chromogen precipitation | Most common; requires peroxidase block [24] |
| Alkaline Phosphatase (AP) | Catalyzes chromogen precipitation | Alternative to HRP; different substrate options [24] | |
| Chromogens | DAB (3,3'-Diaminobenzidine) | Forms brown precipitate | Most common; alcohol-insoluble; permanent [24] |
| AEC (3-Amino-9-ethylcarbazole) | Forms red precipitate | Alcohol-soluble; requires aqueous mounting [24] | |
| BCIP/NBT | Forms blue/purple precipitate | For AP systems; organic solvent stable [24] | |
| Fluorophores | FITC, Alexa Fluor 488 | Green fluorescence | Common choice for first target [15] |
| TRITC, Alexa Fluor 594 | Red fluorescence | Good separation from green fluorophores [15] | |
| Cy5, Alexa Fluor 647 | Far-red fluorescence | Minimal tissue autofluorescence [15] | |
| Amplification Systems | Avidin-Biotin Complex (ABC) | Signal amplification | High sensitivity; endogenous biotin issues [24] |
| Polymer-Based Systems | Signal amplification | Biotin-free; compact size [26] [24] | |
| Tyramide Signal Amplification | Extreme amplification | Ultra-sensitive; requires optimization [9] | |
| Blocking Reagents | Normal Serum | Reduces non-specific binding | Should match secondary antibody species [9] |
| BSA or Protein Block | Reduces non-specific binding | Generic protein block [9] | |
| Mounting Media | Organic Media (e.g., Permount) | Permanent mounting | For alcohol-insoluble chromogens (DAB) [24] |
| Aqueous Media | Temporary mounting | For alcohol-soluble chromogens (AEC) [24] | |
| Antifade Media | Preserves fluorescence | Essential for fluorescent detection [15] |
The selection between direct and indirect detection methods for IHC represents a critical decision point that significantly influences experimental outcomes. Direct methods offer simplicity, speed, and minimal background, making them ideal for detecting highly expressed antigens and multiplexing applications. Indirect methods provide substantial signal amplification, flexibility, and sensitivity, which are essential for detecting low-abundance targets but require more complex protocols and rigorous optimization.
Chromogenic and fluorescent detection methods each present complementary advantages, with chromogenic IHC providing permanent, easily visualized results using standard microscopy, while fluorescent detection enables superior multiplexing capabilities and quantification potential. The ongoing development of novel detection systems, including improved polymer methods and advanced amplification technologies, continues to expand the capabilities of IHC for research and drug development applications.
Researchers should base their selection of detection methods on specific experimental requirements, including target abundance, required sensitivity, equipment availability, and intended application. Proper validation, optimization, and implementation of appropriate controls remain essential for generating reliable, reproducible results that advance scientific understanding and drug development efforts.
Immunohistochemistry (IHC) stands as a cornerstone technique in biological research and clinical diagnostics, enabling the visualization of protein distribution within the context of intact tissue architecture [27]. The evolution of detection methodologies from simple enzyme conjugates to sophisticated advanced fluorophores has profoundly expanded our ability to investigate complex biological systems. This application note traces the historical progression of IHC detection systems, framed within a broader thesis comparing chromogenic versus fluorescent approaches. We provide detailed protocols and resource tables to equip researchers, scientists, and drug development professionals with practical tools for implementing these techniques in their investigative work.
The foundational principle of IHC—exploiting the specific recognition of an antibody for its antigen—remains unchanged since its inception [27]. However, the methods for visualizing this interaction have undergone revolutionary transformation. Early techniques relied on enzymes that produced visible precipitates, while modern approaches employ fluorophores with exquisite sensitivity and multiplexing capabilities [28] [15]. Understanding this evolution is critical for selecting appropriate detection methods for specific research questions, particularly in complex applications like cancer microenvironment analysis [29].
Historical Development of Detection Methods
Early Chromogenic Foundations
The genesis of immunohistochemistry dates to 1942, when Albert H. Coons and colleagues developed the first fluorescently-labeled antibody to visualize pneumococcal bacteria in tissues [1] [27]. This pioneering work established the fundamental principle of using labeled antibodies for antigen localization. Reflecting on his achievement, Coons notably observed that "fluorescent antibodies, whatever their scientific merits, are very attractive under the microscope. They shine in the dark, a brilliant greenish-yellow glow" [1].
Despite this fluorescent beginning, chromogenic methods gained early prominence due to their practicality and compatibility with standard brightfield microscopy. The 1960s witnessed a pivotal advancement with the introduction of enzyme-conjugated antibodies, particularly those coupled with horseradish peroxidase (HRP) and alkaline phosphatase (AP) [1]. These enzymes catalyzed reactions that converted soluble substrates into insoluble, colored precipitates at the antigen site, providing a permanent record that could be visualized with conventional light microscopy [28] [5].
A significant methodological refinement came from Nakane in 1968, who demonstrated that antibodies bound to antigens on slides could be eluted with low-pH glycine-hydrochloride buffer, enabling sequential detection of multiple antigens on the same specimen [29]. This breakthrough established the foundation for multiplexed imaging approaches that would be refined in subsequent decades.
The Fluorescence Revolution
The late 20th century witnessed a resurgence in fluorescence detection, driven by parallel advancements in fluorophore chemistry and microscopy instrumentation [15]. Early fluorophores suffered from limitations including photobleaching (fading upon light exposure), broad emission spectra that hampered multiplexing, and autofluorescence in biological tissues [30] [28].
The development of advanced fluorophores—such as the Alexa Fluor series, cyanine dyes (Cy3, Cy5, Cy7), and other synthetic compounds—addressed these limitations with superior photostability, narrower emission spectra, and enhanced brightness [15]. These properties enabled researchers to simultaneously visualize multiple targets through spectral separation, giving rise to sophisticated multiplexing approaches that have transformed spatial biology research [5] [29].
Technical innovations in signal amplification further enhanced fluorescence sensitivity. Tyramide signal amplification (TSA) technology, which utilizes horseradish peroxidase to catalyze the deposition of fluorophore-labeled tyramide compounds near the antigen-antibody complex, can increase signal intensity by 10- to 100-fold compared to conventional immunofluorescence [5] [29]. This heightened sensitivity proved essential for detecting low-abundance targets in formalin-fixed, paraffin-embedded (FFPE) tissues.
Contemporary Multiplexing Paradigms
The 21st century has witnessed the emergence of highly multiplexed imaging platforms that transcend traditional dichotomies of chromogenic versus fluorescence detection. These can be broadly categorized into single-shot and multicycle imaging approaches [29].
Mass spectrometry-based methods like Multiplexed Ion Beam Imaging (MIBI) and Imaging Mass Cytometry (IMC) utilize antibodies tagged with rare earth metal isotopes rather than enzymes or fluorophores [29]. These techniques can detect over 40 targets simultaneously through time-of-flight mass spectrometry, virtually eliminating spectral overlap concerns that challenge fluorescence methods [29].
Oligonucleotide-barcoded antibody systems such as the PhenoCycler (formerly CODEX) and SignalStar employ DNA-conjugated primary antibodies that are detected through successive rounds of fluorescent reporter hybridization, imaging, and dehybridization [29]. These systems can profile 50+ markers while preserving tissue integrity through minimal staining and destaining cycles.
Modern iterative fluorescence methods—including Tissue-Based Cyclic Immunofluorescence (t-CyCIF) and Iterative Bleaching Extends Multiplexity (IBEX)—leverage conventional fluorophore-conjugated antibodies but employ chemical or photobleaching techniques to inactivate fluorescence between imaging cycles [29]. These approaches represent an accessible entry point to highly multiplexed imaging as they can be implemented with standard laboratory microscopes and antibody reagents.
The following diagram illustrates the evolutionary pathway of IHC detection technologies from their origins to contemporary multiplexed platforms:
Comparative Analysis of Detection Technologies
Performance Characteristics
The evolution from enzyme conjugates to advanced fluorophores has produced detection technologies with distinct performance characteristics, advantages, and limitations. The table below provides a quantitative comparison of key parameters across this technological progression:
Table 1: Performance Comparison of IHC Detection Technologies
| Technology | Multiplexing Capacity | Sensitivity | Spatial Resolution | Signal Stability | Instrumentation Requirements |
|---|---|---|---|---|---|
| Chromogenic IHC | 1-3 targets [5] | Medium [1] | Limited by precipitate diffusion [15] | Years (permanent) [5] [15] | Standard brightfield microscope [28] [12] |
| Conventional Immunofluorescence | 3-5 targets [5] | Medium-High [15] | High (confocal capable) [15] | Weeks to months (with antifade) [15] | Fluorescence microscope [12] [15] |
| Tyramide Signal Amplification | 5-7 targets [29] | High (10-100x amplification) [5] [29] | High (subcellular) [29] | Months (with careful storage) [5] | Fluorescence microscope with spectral imaging [29] |
| Mass Spectrometry Imaging | 40+ targets [29] | High (no background) [29] | 0.4-1 μm/pixel [29] | Not applicable (metal tags) | Specialized mass cytometer [29] |
| Oligonucleotide-Based Multiplexing | 50+ targets [29] | High [29] | High (subcellular) [29] | Tissue preserved through cycles | Automated staining/imaging system [29] |
Methodological Trade-offs
The selection of appropriate detection technology involves balancing multiple methodological considerations:
Sensitivity versus Multiplexing Capacity: Chromogenic methods employing avidin-biotin complex (ABC) or labeled streptavidin-biotin (LSAB) amplification can provide exceptional sensitivity for detecting low-abundance targets [28]. However, this comes at the cost of limited multiplexing capacity due to color overlap constraints [5]. Conversely, fluorescence-based multiplexing enables simultaneous detection of numerous markers but may require signal amplification for low-expression targets [15] [29].
Spatial Resolution versus Throughput: Chromogenic precipitates can diffuse from the enzymatic source, creating "fuzziness" that limits precise subcellular localization [15]. Fluorescence detection enables high-resolution confocal microscopy but typically requires more sophisticated instrumentation and longer imaging times [15]. Mass spectrometry-based approaches provide high spatial resolution without diffraction limitations but have lower throughput and limited accessibility [29].
Signal Stability versus Quantitative Capability: Chromogenic signals form permanent deposits that remain stable for years, facilitating archiving and retrospective studies [5] [15]. However, the enzymatic reaction kinetics make truly quantitative analysis challenging [15]. Fluorescence signals permit more accurate quantification through linear signal response but are susceptible to photobleaching over time, even with antifade mounting media [28] [15].
Advanced Fluorophores and Nanoparticles in Modern IHC
Novel Labeling Approaches
The frontier of IHC detection continues to advance with the development of novel labeling approaches that transcend conventional fluorophores. Gold nanoparticles represent a particularly promising alternative, offering advantages including greater signal stability and minimal photobleaching compared to organic fluorophores [30]. These nanoparticles scatter light efficiently, creating high signal-to-noise ratios that are easily distinguishable from biological background [30].
The performance of nanoparticle labels is strongly influenced by their physical characteristics. Research comparing 2.2, 10, and 40 nm diameter gold nanoparticles demonstrated that signal-to-noise ratios vary significantly with particle diameter [30]. Importantly, nanoparticle conjugates exhibit different labeling efficiencies depending on subcellular location—they perform well for extracellular and subplasma membrane epitopes but encounter challenges when targeting extended intracellular structures like keratin networks in the cytoplasm [30].
Multiplexed Imaging Applications
Advanced fluorophores have enabled sophisticated multiplexed imaging applications that reveal complex cellular interactions within tissue microenvironments. These approaches are particularly valuable in cancer immunotherapy research, where understanding the spatial relationships between immune cells and tumor cells is critical for predicting treatment response [5] [29].
The following workflow diagram illustrates a typical multicycle fluorescent multiplexing protocol using iterative staining and imaging:
Fluorescent multiplexing excels in co-localization studies where determining whether different proteins reside in the same cellular compartment is essential [28] [12]. Whereas overlapping chromogenic stains produce ambiguous blended colors, fluorescent signals from properly-separated fluorophores can be independently analyzed and precisely overlaid to determine protein co-localization with high confidence [28] [15].
Detailed Experimental Protocols
Chromogenic IHC Protocol for FFPE Tissues
This protocol details a standard chromogenic detection procedure for formalin-fixed, paraffin-embedded (FFPE) tissue sections using horseradish peroxidase (HRP) conjugation and 3,3'-diaminobenzidine (DAB) development [31].
Materials & Reagents:
- FFPE tissue sections (4-7 μm thickness)
- Xylene and ethanol series (100%, 95%, 70%)
- Hydrogen peroxide (3% in methanol)
- Citrate buffer (10 mM, pH 6.0) or EDTA buffer (1 mM, pH 8.0)
- Blocking solution (10% normal serum, 1% BSA in PBS)
- Primary antibody specific to target antigen
- Biotinylated secondary antibody
- HRP-streptavidin complex
- DAB substrate solution
- Hematoxylin counterstain
- Aqueous mounting medium
Procedure:
- Deparaffinization and Rehydration:
- Incubate slides in xylene for 5 minutes, 3 times.
- Transfer through graded ethanol series: 100% (twice), 95%, 70% - 2 minutes each.
- Rinse in distilled water for 5 minutes.
Antigen Retrieval:
- Place slides in preheated citrate buffer (pH 6.0).
- Heat using microwave oven, water bath, or pressure cooker for 10-20 minutes.
- Cool slides for 20-30 minutes at room temperature.
- Rinse with PBS (pH 7.4).
Peroxidase Blocking:
- Incubate with 3% hydrogen peroxide in methanol for 10 minutes.
- Rinse with PBS, 3 times for 2 minutes each.
Blocking:
- Apply serum blocking solution for 30 minutes at room temperature.
- Drain excess blocking solution (do not rinse).
Primary Antibody Incubation:
- Apply optimized concentration of primary antibody.
- Incubate for 30-60 minutes at room temperature or overnight at 4°C.
- Rinse with PBS, 3 times for 2 minutes each.
Secondary Antibody Incubation:
- Apply biotinylated secondary antibody for 30 minutes at room temperature.
- Rinse with PBS, 3 times for 2 minutes each.
HRP Complex Formation:
- Apply HRP-streptavidin complex for 30 minutes at room temperature.
- Rinse with PBS, 3 times for 2 minutes each.
Chromogenic Development:
- Prepare DAB substrate solution according to manufacturer's instructions.
- Apply to tissue sections and monitor development (typically 30 seconds to 5 minutes).
- Stop reaction by immersing in distilled water.
Counterstaining and Mounting:
- Counterstain with hematoxylin for 30-60 seconds.
- Rinse in running tap water for 5 minutes.
- Dehydrate through graded ethanol series (70%, 95%, 100%) and xylene.
- Mount with aqueous mounting medium and coverslip.
Multiplex Immunofluorescence Protocol with Sequential Staining
This protocol describes a multicycle fluorescence approach for detecting 3-5 targets on the same FFPE tissue section through sequential staining, imaging, and antibody elution [29].
Materials & Reagents:
- FFPE tissue sections (4-7 μm thickness)
- Antigen retrieval buffer (citrate or EDTA)
- Blocking solution (10% normal serum, 1% BSA, 0.1% Triton-X in PBS)
- Primary antibodies from different host species
- Species-specific fluorophore-conjugated secondary antibodies
- Glycine-HCl elution buffer (pH 2.0) or commercial antibody elution buffer
- Antifade mounting medium with DAPI
- Fluorescence microscope with appropriate filter sets
Procedure:
- Initial Tissue Preparation:
- Perform deparaffinization, rehydration, and antigen retrieval as described in steps 1-3 of the chromogenic protocol.
- Incubate with serum blocking solution for 1 hour at room temperature.
First Staining Cycle:
- Apply first primary antibody and incubate for 1 hour at room temperature or overnight at 4°C.
- Rinse with PBS-T (PBS with 0.1% Tween-20), 3 times for 5 minutes each.
- Apply appropriate fluorophore-conjugated secondary antibody and incubate for 1 hour at room temperature.
- Rinse with PBS-T, 3 times for 5 minutes each.
Initial Image Acquisition:
- Apply antifade mounting medium with DAPI and coverslip.
- Acquire images of the first target using appropriate excitation/emission wavelengths.
- Note reference points for subsequent image registration.
Antibody Elution:
- Carefully remove coverslip and immerse slide in elution buffer for 10-15 minutes.
- Rinse thoroughly with PBS-T, 3 times for 5 minutes each.
- Verify elution efficiency by re-imaging using the same settings.
Subsequent Staining Cycles:
- Repeat steps 2-4 for each additional primary antibody.
- Use spectrally distinct fluorophores with minimal emission overlap.
- Include no-primary antibody controls to confirm specific staining.
Final Image Processing:
- Align and register all image sets using reference points.
- Perform channel merging and quantitative analysis.
Researcher's Toolkit: Essential Reagents and Materials
Table 2: Essential Research Reagents for IHC Detection Methods
| Reagent Category | Specific Examples | Function | Application Notes |
|---|---|---|---|
| Fixatives | Formalin, Paraformaldehyde, Methanol, Acetone | Preserve tissue architecture and antigenicity | Aldehyde fixatives provide better morphology; precipitative fixatives better preserve some epitopes [1] |
| Antigen Retrieval Reagents | Citrate buffer (pH 6.0), EDTA buffer (pH 8.0), Tris-EDTA (pH 9.0), Proteinase K | Reverse formaldehyde cross-linking and expose epitopes | pH optimization is antibody-dependent; basic buffers generally more effective for nuclear antigens [27] [31] |
| Blocking Reagents | Normal serum, BSA, Non-fat dry milk, Avidin/Biotin blocking kits | Reduce non-specific antibody binding | Use serum from species matching secondary antibody; biotin blocking essential for tissues with endogenous biotin [28] [31] |
| Enzyme Substrates | DAB (brown), AEC (red), BCIP/NBT (blue), Vector VIP (purple) | Generate colored precipitate at antigen site | DAB provides permanent staining; alcohol-soluble substrates require aqueous mounting [28] [5] |
| Fluorophores | Alexa Fluor series, DyLight series, ATTO dyes, Qdot nanocrystals | Emit light at specific wavelengths upon excitation | Prioritize bright, photostable fluorophores with minimal spectral overlap [15] [32] |
| Signal Amplification Systems | Tyramide Signal Amplification (TSA), Enzyme-mediated amplification, Nanogold with silver enhancement | Enhance detection sensitivity for low-abundance targets | TSA enables extreme sensitivity but requires careful optimization to prevent background [5] [29] |
| Mounting Media | Aqueous mounting media, Organic mounting media, Antifade reagents | Preserve staining and optimize microscopy | Use antifade reagents for fluorescence; aqueous media for alcohol-soluble chromogens [15] |
The evolution from enzyme conjugates to advanced fluorophores represents a paradigm shift in immunohistochemical detection capabilities. While chromogenic methods remain valuable for single-target analysis in diagnostic settings and resource-limited environments, fluorescent approaches have unlocked unprecedented multiplexing capacity for research applications [12] [5]. The ongoing development of nanomaterial-based labels, mass spectrometry imaging, and oligonucleotide-barcoded antibodies promises to further expand these capabilities, enabling increasingly comprehensive spatial profiling of complex biological systems [30] [29].
Selection of appropriate detection technology must be guided by experimental objectives, with consideration of multiplexing requirements, sensitivity thresholds, instrumentation access, and analytical endpoints. Chromogenic IHC offers simplicity and permanence, while fluorescence enables quantification and multiplexing [28] [15]. Emerging technologies now transcend this traditional dichotomy, providing researchers with an expanding toolkit for spatial molecular characterization [29]. As these technologies continue to evolve, they will undoubtedly yield deeper insights into tissue organization and function, particularly in complex pathological contexts like the tumor microenvironment [29].
Choosing Your Method: Applications in Research and Diagnostics
In the evolving landscape of immunohistochemistry (IHC), researchers and diagnostic pathologists must continually make strategic decisions about detection methodologies. Chromogenic IHC remains a cornerstone technique in clinical diagnostics and routine pathology, offering distinct advantages for specific applications. This article provides a comprehensive framework for selecting chromogenic detection by examining its fundamental principles, optimal use cases, experimental protocols, and comparative benefits against fluorescent alternatives within the broader context of IHC research.
Fundamental Principles of Chromogenic IHC
Chromogenic immunohistochemistry utilizes enzyme-labeled antibodies to visualize target antigens through a catalytic reaction that produces a colored, insoluble precipitate at the antigen site. This methodology typically employs enzymes such as horseradish peroxidase (HRP) or alkaline phosphatase (AP) which react with chromogenic substrates to generate visible signals detectable by standard brightfield microscopy [33] [10].
The core detection mechanism involves a multi-step process. Initially, a primary antibody binds specifically to the target antigen in the tissue specimen. Subsequently, an enzyme-conjugated secondary antibody or polymer system targets the primary antibody. Finally, upon addition of a chromogen substrate, the conjugated enzyme catalyzes a reaction that deposits a colored precipitate at the antigen site [10]. The most widely utilized chromogen is 3,3'-diaminobenzidine (DAB), which produces a robust brown precipitate that is highly stable, insoluble in water and alcohol, and permanent [10] [34]. Other common chromogens include 3-amino-9-ethylcarbazole (AEC) which yields a red product, and newer chromogen options that produce purple, yellow, blue, green, and teal colors [10] [35].
Key Applications and Decision Framework
When to Prioritize Chromogenic IHC
Chromogenic IHC offers particular advantages in specific research and diagnostic scenarios:
Clinical diagnostics and archival purposes: Chromogenic signals, particularly DAB, demonstrate exceptional long-term stability, allowing stained slides to be archived for years or even decades without significant signal degradation [35] [9]. This permanence is crucial for clinical records, clinical trials, and retrospective studies.
Routine pathology assessment: For evaluating single biomarkers where spatial co-localization is not required, chromogenic IHC provides clear, interpretable results on standard brightfield microscopes [33] [9]. The widespread availability of brightfield microscopy in clinical settings makes chromogenic IHC more accessible than fluorescence-based methods.
Tissues with inherent autofluorescence: Chromogenic detection avoids interpretation challenges posed by tissue autofluorescence from elements such as collagen, elastin, lipofuscin, red blood cells, and adipocytes [35].
Low-multiplexing needs: While fluorescence excels at high-plex multiplexing, chromogenic IHC can effectively visualize 2-3 biomarkers simultaneously when targets reside in distinct cellular compartments [10] [9].
High-sensitivity requirements: When paired with appropriate signal amplification protocols such as avidin-biotin complex (ABC) or labeled streptavidin-biotin (LSAB), chromogenic methods can achieve superior sensitivity for detecting low-abundance targets compared to basic fluorescence detection [33].
Decision Factors for Method Selection
Table 1: Key Decision Factors for Selecting Chromogenic IHC
| Factor | Choose Chromogenic IHC When | Choose Fluorescent IHC When |
|---|---|---|
| Protein Abundance | Targeting low-abundance proteins with signal amplification [33] | Targeting moderately to highly abundant proteins |
| Multiplexing Needs | Assessing 1-3 targets, especially in different cellular compartments [33] [10] | Assessing 3+ targets or needing precise co-localization [33] [35] |
| Sample Preservation | Long-term archiving is required [35] | Short-term analysis is sufficient |
| Equipment Access | Only brightfield microscopy available [35] | Fluorescence microscopy accessible |
| Tissue Type | Tissues with high autofluorescence [35] | Frozen sections or tissues with low autofluorescence |
| Quantification Needs | Semi-quantitative analysis is sufficient | Precise quantitative analysis required [15] |
Experimental Protocols
Chromogenic IHC Staining Protocol for Formalin-Fixed Paraffin-Embedded (FFPE) Tissue Sections
The following protocol has been optimized for FFPE tissue sections, the most common specimen type in diagnostic pathology [34] [9]:
Reagents Required:
- Wash Buffer: 1X PBS (0.145 M NaCl, 0.0027 M KCl, 0.0081 M Na2HPO4, 0.0015 M KH2PO4, pH 7.4)
- Incubation Buffer: 1% bovine serum albumin, 1% normal serum, 0.3% Triton X-100, and 0.01% sodium azide in PBS
- Primary Antibodies
- Cell and Tissue Staining Kit (including Biotinylated Secondary Antibodies, Serum Blocking Reagent, Peroxidase Blocking Reagent, Avidin Blocking Reagent, Biotin Blocking Reagent, High Sensitivity Streptavidin-HRP Conjugate, and Chromogen Solution)
- Hematoxylin Counterstain
- Aqueous Mounting Medium
- Antigen Retrieval Reagents (if required)
Protocol Steps:
Deparaffinization and Rehydration:
- Immerse slides in xylene (mixed isomers) 2 times for 10 minutes each
- Immerse slides in 100% alcohol 2 times for 10 minutes each
- Immerse slides in 95% alcohol for 5 minutes
- Immerse slides in 70% alcohol for 5 minutes
- Immerse slides in 50% alcohol for 5 minutes
- Rinse with deionized H₂O
- Rehydrate with wash buffer for 10 minutes [34]
Antigen Retrieval (if required):
- Perform heat-mediated antigen retrieval by steaming slides in citrate buffer (pH 6.0) or Tris-EDTA buffer (pH 9.0) for 30 minutes at 100°C
- Cool slides to room temperature [36]
Blocking:
- Block endogenous peroxidase activity with peroxidase blocking reagent (3% H₂O₂) for 5-15 minutes
- Block non-specific binding with serum blocking reagent for 15 minutes
- Block endogenous biotin with avidin blocking reagent for 15 minutes, followed by biotin blocking reagent for 15 minutes [34]
Antibody Incubation:
- Apply primary antibody diluted in Incubation Buffer and incubate overnight at 2-8°C
- Rinse with wash buffer and wash 3 times for 5 minutes each
- Apply biotinylated secondary antibodies for 30-60 minutes
- Rinse with wash buffer 3 times for 15 minutes each [34]
Detection:
- Apply High Sensitivity Streptavidin-HRP conjugate (HSS-HRP) for 30 minutes
- Wash 3 times in wash buffer for 2 minutes each
- Apply DAB Chromogen Solution and incubate for 3-20 minutes, monitoring staining intensity microscopically
- Rinse with wash buffer 3 times for 10 minutes each [34]
Counterstaining and Mounting:
Figure 1: Chromogenic IHC Workflow for FFPE Tissue Sections
Essential Research Reagent Solutions
Table 2: Essential Reagents for Chromogenic IHC
| Reagent Category | Specific Examples | Function | Technical Notes |
|---|---|---|---|
| Chromogens | DAB, AEC, Fast Red, DISCOVERY Purple/Red/Yellow [10] | Enzyme substrate producing colored precipitate | DAB is permanent and alcohol-insoluble; AEC is alcohol-soluble [34] |
| Enzyme Systems | Horseradish Peroxidase (HRP), Alkaline Phosphatase (AP) [10] | Catalyzes chromogen conversion | HRP more common; use TBS (not PBS) with AP systems [9] |
| Detection Systems | Polymer-based systems, ABC, LSAB [33] [9] | Signal generation and amplification | Polymer systems avoid endogenous biotin interference [9] |
| Blocking Reagents | Animal serum, BSA, endogenous enzyme blockers [34] | Reduce non-specific background | Use serum from secondary antibody host species [37] |
| Antigen Retrieval | Citrate buffer (pH 6.0), Tris-EDTA (pH 9.0) [36] | Expose masked epitopes | Required for most FFPE tissues; pH depends on antibody [36] |
| Counterstains | Hematoxylin, Methyl Green, Nuclear Fast Red [35] | Provide morphological context | Hematoxylin most common; avoid with nuclear targets [34] |
Advanced Chromogenic Applications
Multiplex Chromogenic IHC
While traditionally limited in multiplexing capacity compared to fluorescence, advances in chromogen technology have enabled multiplex chromogenic IHC for simultaneous detection of 2-3 targets. Successful implementation requires careful experimental design:
- Biomarker selection: Choose targets expressed in distinct cellular compartments (e.g., membrane, cytoplasm, nucleus) to facilitate interpretation [10]
- Chromogen selection: Employ chromogens with contrasting colors and consider using new translucent chromogens (Purple, Yellow, Teal) that enable color mixing for co-localization studies [10]
- Staining sequence: Always detect the least abundant antigen first followed by more abundant targets to prevent signal exhaustion [36]
For complex multiplexing beyond 3 targets, sequential chromogenic IHC (scIHC) approaches can be employed where multiple rounds of staining, imaging, and signal removal are performed on the same tissue section, enabling analysis of 10+ biomarkers [36].
Chromogenic IHC in Diagnostic Pathology
In diagnostic pathology, chromogenic IHC serves several critical functions [9]:
- Tumor classification and histogenesis determination: Using cell-specific markers (e.g., cytokeratins for epithelial differentiation)
- Predictive biomarker assessment: Evaluating therapeutic targets such as hormone receptors in breast cancer (ER, PgR) and HER2
- Prognostic marker evaluation: Assessing proliferation indices (Ki-67) and mutation status (p53)
- Infectious disease identification: Detecting pathogenic organisms within tissues
Troubleshooting and Optimization
Addressing Common Challenges
- High background staining: Implement appropriate blocking steps for endogenous enzymes, biotin, and non-specific protein interactions [34] [9]
- Weak or absent signal: Optimize antigen retrieval method and pH; verify antibody specificity and concentration; extend incubation times [34]
- Non-specific nuclear staining: Ensure proper antibody dilution and specificity; consider alternative primary antibodies [9]
- Endogenous biotin interference: Use polymer-based detection systems instead of avidin-biotin methods, particularly in kidney, liver, or frozen tissues [33] [9]
Figure 2: Chromogenic IHC Troubleshooting Guide
Chromogenic IHC remains an indispensable methodology in clinical diagnostics and routine pathology, offering permanent specimens, compatibility with standard brightfield microscopy, and robust detection of single biomarkers. While fluorescent techniques excel in multiplexing and co-localization studies, chromogenic detection provides unparalleled stability for archival purposes and widespread accessibility in diagnostic settings. The continued development of novel chromogens and signal amplification systems ensures that chromogenic IHC will maintain its vital role in both research and clinical pathology, particularly for standardized diagnostic applications requiring long-term specimen preservation. Researchers should select detection methodologies based on their specific experimental requirements, equipment availability, and intended application, with chromogenic IHC representing the optimal choice for many fundamental and diagnostic pathology applications.
In the broader context of chromogenic versus fluorescent detection methods for immunohistochemistry (IHC), fluorescent IHC emerges as the superior technique for advanced research applications requiring multiplexing and co-localization studies. While chromogenic IHC remains valuable for single-marker detection and traditional pathology, fluorescent IHC enables researchers to visualize complex cellular interactions and multiple targets simultaneously within their native tissue architecture [5]. This capability is particularly crucial in immuno-oncology and drug development, where understanding the tumor immune microenvironment (TIME) – including the spatial relationships between immune cells, tumor cells, and checkpoint markers – directly informs therapeutic strategies and biomarker discovery [38] [39].
The fundamental distinction lies in detection methodology: fluorescent IHC uses antibody-conjugated fluorophores that emit light at specific wavelengths when excited, whereas chromogenic IHC relies on enzymes to produce colored precipitates at antigen sites [40] [11]. This technical difference translates into significant practical advantages for fluorescence when investigating complex biological questions requiring multiple parallel detections.
Technical Comparison: Fluorescent vs. Chromogenic IHC
The decision between fluorescent and chromogenic IHC involves balancing multiple technical considerations against research objectives. The following table summarizes the key distinguishing factors:
Table 1: Comprehensive Comparison of Fluorescent and Chromogenic IHC
| Feature | Fluorescent IHC | Chromogenic IHC |
|---|---|---|
| Multiplexing Capacity | 5-10+ markers simultaneously [5] | Typically 3-5 markers maximum [5] |
| Co-localization Studies | Excellent; allows precise identification of multiple targets within the same subcellular compartment [40] [11] | Poor; overlapping colors obscure co-localization and blended stains can be misleading [40] [5] |
| Quantitative Capability | High; broad linear dynamic range enables accurate quantitation of marker intensity [41] [15] | Low; limited dynamic range provides, at best, semi-quantitative data [41] |
| Sensitivity | High, especially with tyramide signal amplification (TSA) [5] | High with signal amplification (e.g., ABC, LSAB methods) [11] |
| Signal Stability | Moderate; susceptible to photobleaching over time, requires antifade mounting media [5] [15] | High; stained slides are stable for years [5] [15] |
| Instrumentation | Requires fluorescence microscopes or scanners with specific filters [5] [15] | Standard brightfield microscopes (widely available) [5] |
| Spectral Resolution | High with narrow emission spectra; requires careful fluorophore selection to minimize bleed-through [41] [11] | Low with broad absorption spectra; color separation can be challenging [41] |
| Data Output | High-resolution, quantifiable images suitable for sophisticated digital analysis [15] | Qualitative or semi-quantitative images familiar for pathological assessment [41] |
| Best Applications | Complex cellular phenotyping, spatial biology, co-localization, quantitative studies [41] [39] | Diagnostic pathology, single-target analysis, morphology-focused studies [5] |
For research requiring the simultaneous detection of multiple targets – such as characterizing different immune cell populations (e.g., T cells, B cells, macrophages) alongside functional and checkpoint markers (e.g., PD-1, PD-L1, Ki-67) – fluorescent IHC provides unparalleled capability [38] [39]. Its superior quantitative nature and capacity for co-localization make it indispensable for studying protein interactions and complex cellular phenotypes within the tissue microenvironment.
Advanced Multiplexing Techniques and Technologies
Beyond standard multiplex fluorescent IHC, several cutting-edge platforms enable highly multiplexed tissue analysis, each with distinct operational parameters and output capabilities:
Table 2: Advanced Highly Multiplexed Tissue Imaging Platforms
| Technology | Principle | Markers | Imaging Area | Key Advantage | Key Limitation |
|---|---|---|---|---|---|
| Tissue-Based Mass Spectrometry (MIBI-TOF, IMC) | Metal-tagged antibodies detected by mass spectrometry [41] | 40+ [41] | ROI (1mm²), tiling possible [41] | No signal fading/autofluorescence; quantitative [41] | Extremely costly instrumentation; extensive training [41] |
| Digital Spatial Profiling (DSP) | UV-cleavable DNA barcodes on antibodies [41] | 40-50 (theoretically ~800) [41] | ROI (0.28mm²) [41] | Extremely high plex capability; fast staining (1 hour) [41] | No image produced; ROI-dependent [41] |
| Cyclic Immunofluorescence | Iterative staining/imaging/ dye inactivation [41] | 30-60 [41] | Up to whole slide [41] | High multiplexing on standard platforms | Lengthy process for many cycles |
| CODEX | DNA barcoded antibodies with fluorescent reporter detection by indexing [38] | 40+ [38] | Up to whole slide [6] | High multiplex with whole-slide imaging | Specialized instrumentation required |
These technologies demonstrate how the principles of fluorescent detection are being leveraged and enhanced to achieve unprecedented levels of multiplexing. For instance, DSP does not produce a conventional image but instead generates quantitative, spatially-resolved data for dozens of markers, representing a significant shift in analytical approach [41]. The choice among these methods depends on the specific research question, required level of multiplexing, available instrumentation, and analytical preferences.
Experimental Protocol: Standard Multiplex Fluorescent IHC
The following detailed protocol for multiplex fluorescent IHC is adapted from established methodologies [42] and can be performed with standard laboratory equipment.
Research Reagent Solutions and Materials
Table 3: Essential Reagents and Materials for Multiplex Fluorescent IHC
| Item Category | Specific Examples | Function/Purpose |
|---|---|---|
| Tissue Sections | Cryosections (4-14 µm) or FFPE sections (4-5 µm) mounted on SuperFrost slides [42] | Preserved tissue for analysis; thickness affects antibody penetration and image clarity |
| Fixatives | 4% Paraformaldehyde (PFA), Formalin [1] [42] | Preserves tissue architecture and antigenicity |
| Antigen Retrieval Buffers | Citrate-based buffer (pH 6.0), Tris/EDTA buffer (pH 9.0) [42] | Reverses formaldehyde-induced cross-linking to expose epitopes |
| Blocking Solution | 2-5% normal serum from secondary antibody host species [42] | Reduces non-specific antibody binding |
| Primary Antibodies | Mouse anti-CD3, Rabbit anti-CD8, Rat anti-FOXP3, etc. [39] | Bind specifically to target proteins of interest |
| Secondary Antibodies | Species-specific antibodies conjugated to fluorophores (e.g., Alexa Fluor 488, 594, 647) [15] [42] | Bind to primary antibodies and provide detectable signal |
| Nuclear Counterstain | DAPI, Hoechst stain [15] | Labels all nuclei for cell identification and segmentation |
| Mounting Medium | ProLong Gold, other anti-fade mounting media [42] | Preserves fluorescence and prepares slides for microscopy |
Detailed Step-by-Step Procedure
Day 1: Sample Preparation and Primary Antibody Incubation
Tissue Preparation:
- For FFPE tissues: Deparaffinize by immersing slides in xylene (2 x 5 min), then rehydrate through a graded ethanol series (100%, 95%, 70% - 2 x 3 min each). Rinse in distilled water [42].
- For frozen tissues: Air-dry cryosections for 2 hours at room temperature. Rehydrate in 1x PBS (2 x 15 min). Optionally, post-fix in 4% PFA for 20 minutes [42].
Antigen Retrieval: For most FFPE tissues and some fixed frozen tissues, heat-induced epitope retrieval (HIER) is required. Immerse slides in pre-heated retrieval buffer (e.g., pH 6 or pH 9) and incubate at 97°C for 20 minutes (FFPE) or 60-70°C for 10 minutes (frozen). Cool slides to room temperature in the buffer, then rinse with wash buffer [42].
Peroxidase Quenching (Optional): Incubate slides in 0.3% H₂O₂ in PBS for 15 minutes (paraffin) or 5 minutes (cryo) to quench endogenous peroxidase activity, especially critical if using HRP-based signal amplification. Rinse in PBS [42].
Blocking: Circle the tissue section with a hydrophobic pen. Apply 2% normal serum from the host species of the secondary antibodies (e.g., normal goat serum) and incubate for 30 minutes at room temperature in a humidified chamber to block non-specific binding sites [42].
Primary Antibody Incubation: Prepare a cocktail of primary antibodies from different host species (or different isotypes if from the same species) diluted in an appropriate antibody diluent. Apply the cocktail to the tissue section (approximately 180 µL/slide) and incubate overnight at 4°C in a humidified chamber [42].
Day 2: Secondary Antibody Detection and Mounting
Washing: Rinse slides thoroughly with wash buffer (e.g., PBS or TBS with 0.025% Triton X-100) for 3 x 5 minutes at room temperature to remove unbound primary antibodies [42].
Secondary Antibody Incubation: Prepare a cocktail of fluorophore-conjugated secondary antibodies, each specific to the host species/isotype of the corresponding primary antibody. Dilute the cocktail in buffer, apply to the tissue, and incubate for 1 hour at room temperature (or 30 minutes at 37°C) in the dark [42].
Washing: Wash slides with buffer for 2 x 10 minutes in the dark to remove unbound secondary antibodies [42].
Counterstaining and Mounting: Apply a nuclear counterstain such as DAPI (if not already included in secondary antibodies) for a few minutes, rinse briefly. Mount coverslips using an anti-fade mounting medium (e.g., ProLong Gold). Allow the mounting medium to cure for 24 hours at 4°C in the dark [42].
Storage and Imaging: Store finished slides at 4°C in the dark. Image using a fluorescence or multispectral microscope equipped with appropriate filter sets for the fluorophores used. For long-term storage, keep slides at -20°C to preserve fluorescence [15] [42].
Diagram 1: Multiplex Fluorescent IHC Workflow. The two-day protocol involves sequential steps of tissue preparation, antibody incubation, and detection to achieve specific multiplex staining.
Critical Optimization and Validation Steps
- Antibody Validation: The success of multiplex fluorescent IHC hinges on using highly validated, specific antibodies. Employ strategies like genetic knockout validation, independent method correlation, and biological specificity testing to confirm antibody performance [41].
- Comprehensive Controls: Include several control experiments:
- Single-stain controls: Stain individual markers on separate sections to verify expected patterns [42].
- Isotype controls: Use irrelevant antibodies of the same isotype to assess non-specific binding.
- Secondary antibody controls: Apply secondary antibodies alone to check for non-specific tissue binding [42].
- Adsorption controls: Pre-incubate primary antibodies with their target peptides to block binding and confirm specificity [42].
- Spectral cross-talk controls: Image each fluorophore with other channels' filter sets to detect and correct for bleed-through [6].
- Fluorophore Selection: Choose fluorophores with minimal spectral overlap, matching their brightness to antigen abundance. Consider using a nuclear stain (DAPI/Hoechst) for cell segmentation and spatial analysis [11] [15].
Fluorescent IHC is the unequivocal method of choice for research requiring multiplex detection and co-localization studies. Its capacity to simultaneously visualize multiple targets within the spatial context of tissue architecture provides insights that are simply unattainable with chromogenic methods. As drug development increasingly focuses on combinatorial immunotherapies and complex biomarker signatures, the ability to precisely characterize cellular phenotypes, functional states, and spatial relationships within the tumor microenvironment becomes paramount. By adopting the detailed protocols and best practices outlined in this application note, researchers and drug development professionals can robustly implement fluorescent IHC to generate quantitative, high-quality data that advances our understanding of disease mechanisms and therapeutic responses.
Multiplex immunohistochemistry (mIHC) represents a pivotal advancement beyond traditional "one marker per slide" immunohistochemistry, enabling the simultaneous detection of multiple antigens on a single tissue section [43]. This technological evolution provides researchers and drug development professionals with unprecedented capability to explore complex biological environments, particularly the tumor microenvironment (TME), where understanding the spatial relationships between different cell types—such as immune cells and tumor cells—is essential for unraveling disease mechanisms and therapeutic responses [43] [6]. The choice between chromogenic and fluorescent detection methods forms a fundamental strategic decision in experimental design, with each approach offering distinct advantages and limitations that must be carefully considered within the context of specific research objectives, available instrumentation, and intended applications [5].
The growing importance of mIHC in immuno-oncology is underscored by evidence suggesting its potential superior predictive value compared to other biomarker modalities. A meta-analysis pooling data from over 8,000 patients across more than 10 cancer types revealed that multiplex IHC/immunofluorescence (IF) assays outperformed PD-L1 IHC, tumor mutation burden, and gene expression profiling in predicting response to anti-PD-1/PD-L1 therapies [6]. This performance advantage is largely attributed to the technology's ability to reveal spatial biology—including cellular protein co-expression, localization, and arrangement—that correlates strongly with clinical outcomes [6] [44]. As immuno-oncology continues to revolutionize cancer treatment, with immune checkpoint inhibitors offering durable responses for some patients but remaining ineffective for most, the need for robust multiplexed tissue analysis platforms becomes increasingly urgent for both research and clinical translation [44].
Fundamental Principles: Chromogenic versus Fluorescent Detection
Chromogenic mIHC
Chromogenic multiplex IHC operates on enzyme-mediated precipitation principles, typically utilizing horseradish peroxidase (HRP) or alkaline phosphatase (AP) to catalyze the deposition of colored substrates—such as 3,3'-diaminobenzidine (DAB, brown) or AEC (red)—at the site of antigen-antibody complexes [5] [43]. These colored precipitates are visible under standard brightfield microscopy, making the technique readily compatible with conventional pathology workflows and infrastructure [5]. The chromogenic signals are generally permanent, with stained slides retaining their interpretability for years, facilitating archival preservation and retrospective studies [5]. However, this method faces inherent limitations in multiplexing capacity due to the broad absorption spectra of chromogens and the challenge of color separation, typically allowing simultaneous detection of 3-5 markers before color blending compromises accurate interpretation [5] [43]. This constraint makes chromogenic mIHC less ideal for complex co-localization studies where multiple markers may occupy the same cellular compartment [5].
Fluorescent mIHC
Fluorescent multiplex IHC employs fluorophore-conjugated antibodies or tyramide signal amplification (TSA) systems to generate specific emission signals upon excitation at characteristic wavelengths [5] [43]. This approach enables substantially higher multiplexing capacity—typically detecting 5-8 markers with TSA-based methods and up to 30-60 markers with non-TSA-based cyclical staining approaches—through spectral separation and computational unmixing techniques [43] [6]. The method provides a wide dynamic range for quantification, supporting precise, single-cell level analysis of protein expression levels [5]. A significant advantage of fluorescent mIHC lies in its superior capability for co-localization studies, as spectral unmixing algorithms can distinguish multiple markers within the same subcellular compartment without signal blending [5]. However, these advantages come with requirements for specialized fluorescence microscopy or multispectral imaging systems, concerns about photobleaching over time, and challenges with tissue autofluorescence, particularly in certain tissue types like spleen or kidney [5].
Table 1: Core Characteristics of Chromogenic versus Fluorescent mIHC
| Feature | Chromogenic mIHC | Fluorescent mIHC |
|---|---|---|
| Detection Principle | Enzyme-mediated color precipitation [5] | Fluorophore emission upon excitation [5] |
| Visualization | Brightfield microscopy [5] | Fluorescence/multispectral microscopy [5] |
| Multiplexing Capacity | 3-5 markers [5] [43] | 5-10+ markers (TSA-based); 30-60 (cyclical approaches) [43] [6] |
| Signal Durability | Permanent, archival-stable [5] | Subject to photobleaching over time [5] |
| Quantitative Capability | Basic, semi-quantitative [5] | Highly quantitative, wide dynamic range [5] |
| Co-localization Studies | Limited by color mixing [5] | Excellent with spectral separation [5] |
| Instrument Requirements | Standard brightfield microscope [5] | Fluorescence microscope or multispectral scanner [5] |
| Best Applications | Clinical diagnostics, routine pathology, budget-limited studies [5] | Research requiring high-plex analysis, spatial biology studies, drug development [5] |
Experimental Design and Panel Development Strategies
Panel Design Considerations
Successful multiplex IHC panel development requires meticulous planning and validation. A rational antibody panel must be designed to avoid cross-reactivity, with particular attention to species and isotype compatibility when employing secondary detection schemes [43]. For fluorescent panels, fluorophore selection must consider spectral overlap to minimize cross-talk, with advanced multispectral imaging and computational unmixing enabling analysis of markers with closely related emission spectra [43]. Panel validation should begin with each antibody tested as a single stain to confirm specificity and optimal dilution before combining markers, followed by comprehensive panel-wise optimization for signal-to-noise ratio, staining sequence, and antigen retrieval compatibility [43]. Rigorous antibody validation is critical to avoid false positives and signal cross-talk, employing strategies including testing on positive and negative control tissues or cell lines, using isotype controls, and ideally, verification with genetically modified knockout models [43].
Sample Preparation Fundamentals
Proper sample preparation establishes the foundation for successful multiplex IHC, regardless of detection method. The process begins with appropriate tissue fixation, most commonly using cross-linking fixatives like formaldehyde or paraformaldehyde to maintain native tissue architecture [45]. For formalin-fixed paraffin-embedded (FFPE) tissues—the most common specimen type in IHC—antigen retrieval is a critical step to reverse formaldehyde-induced protein cross-links that mask epitopes [45]. Heat-induced epitope retrieval (HIER) using citrate (pH 6.0) or EDTA (pH 8.0) buffers under controlled heating conditions (microwave, water bath, or pressure cooker) effectively unmasks a wide range of epitopes, though the optimal method and buffer should be empirically determined for each antibody [45]. Following antigen retrieval, careful optimization of blocking conditions helps minimize non-specific background staining, while appropriate permeabilization enables intracellular antigen detection when required [45].
Diagram 1: Comprehensive Workflow for Multiplex IHC. This diagram illustrates the shared initial sample preparation steps followed by method-specific protocols for chromogenic and fluorescent detection approaches.
Detailed Methodologies: Chromogenic mIHC Protocols
Sequential Chromogenic Staining Protocol
The sequential chromogenic staining approach enables detection of multiple markers through careful optimization of enzyme substrates and antibody stripping between rounds. The following protocol has been optimized for FFPE tissues:
Deparaffinization and Antigen Retrieval: Bake slides at 60°C for 30 minutes, followed by deparaffinization in xylene and rehydration through graded ethanol series. Perform heat-induced epitope retrieval in appropriate buffer (citrate pH 6.0 or EDTA pH 8.0) using a microwave oven (recommended), water bath, or pressure cooker [45].
Peroxidase Blocking and Protein Block: Incubate slides with 3% hydrogen peroxide for 15 minutes to quench endogenous peroxidase activity, followed by protein block (e.g., 5% normal serum or protein-free block) for 30 minutes to reduce non-specific binding [45].
Primary Antibody Incubation: Apply optimized concentration of primary antibody diluted in antibody diluent and incubate overnight at 4°C or for 1-2 hours at room temperature.
HRP-Secondary Detection: Incubate with species-specific HRP-conjugated secondary antibody or polymer system for 30 minutes at room temperature [5].
Chromogen Development: Apply chromogen substrate (e.g., DAB, AEC) for precise timing determined during optimization (typically 1-10 minutes), monitoring development under microscope [5] [43].
Antibody Elution: For sequential staining, apply gentle antibody elution buffer (e.g., glycine-HCl pH 2.0) or heat treatment to remove primary-secondary antibody complexes without damaging the deposited chromogen [43].
Repeat Staining Cycle: Return to step 3 with the next primary antibody, repeating until all markers have been stained.
Counterstaining and Mounting: Apply hematoxylin counterstain (optional), dehydrate through graded alcohols and xylene, and mount with permanent mounting medium [5] [45].
Simultaneous Chromogenic Staining with Enzyme Inactivation
An alternative approach employs simultaneous application of multiple primary antibodies followed by sequential detection with enzyme inactivation:
Primary Antibody Cocktail: Apply optimized mixture of primary antibodies from different host species simultaneously overnight at 4°C.
Sequential Enzyme Development: Detect first marker using HRP-conjugated secondary and chromogen development, followed by HRP inactivation with sodium azide or hydrogen peroxide.
Secondary Detection System: Apply AP-conjugated secondary antibody for second species and develop with compatible chromogen (e.g., Fast Red, Vector Blue).
Additional Markers: Repeat inactivation and detection cycles for additional markers as needed.
Counterstaining and Mounting: Apply hematoxylin, dehydrate, and permanently mount as above.
Table 2: Chromogen Combinations for Multiplex IHC
| Chromogen 1 | Chromogen 2 | Chromogen 3 | Compatibility | Best Applications |
|---|---|---|---|---|
| DAB (brown) | Fast Red (red) | Vector Blue (blue) | Excellent | 3-plex with good color separation |
| DAB (brown) | AEC (red) | Vina Green (green) | Good (avoid red/green for colorblind) | General 3-plex applications |
| DAB (brown) | Vector VIP (purple) | - | Excellent | High contrast 2-plex |
| Permanent Red | DAB (brown) | - | Good | 2-plex with hematoxylin counterstain |
Detailed Methodologies: Fluorescent mIHC Protocols
Tyramide Signal Amplification (TSA) Multiplexing
Tyramide Signal Amplification provides exceptional sensitivity for detecting low-abundance targets and enables high-plex capability through sequential staining with antibody stripping:
Deparaffinization and Antigen Retrieval: Process slides as described in section 4.1, with optimized retrieval condition for the entire antibody panel.
Peroxidase Blocking and Protein Block: Incubate with 3% hydrogen peroxide followed by protein block as in chromogenic protocol.
Primary Antibody Incubation: Apply first primary antibody overnight at 4°C or 1-2 hours at room temperature.
HRP-Secondary Incubation: Incubate with species-specific HRP-conjugated secondary antibody for 30 minutes at room temperature.
Tyramide-Fluorophore Conjugation: Apply tyramide conjugated to fluorophore (e.g., Opal dye system) diluted in amplification buffer for 5-10 minutes [43] [44]. The HRP enzyme catalyzes the covalent deposition of activated tyramide onto electron-rich tyrosine residues adjacent to the antigen site, providing substantial signal amplification (up to 100-fold compared to conventional methods) [43].
Antibody Stripping: Heat slides in retrieval buffer to remove primary-secondary antibody complexes while leaving the covalently-bound tyramide signal intact [43].
Repeat Staining Cycles: Return to step 3 with the next primary antibody, using different fluorophore-conjugated tyramide for each cycle.
Counterstaining and Mounting: Apply nuclear counterstain (e.g., DAPI), and mount with anti-fade mounting medium to reduce photobleaching [5].
Direct Fluorescence Multiplexing
For simpler panels or when using commercially validated kits, direct fluorescence multiplexing offers a streamlined workflow:
Primary Antibody Cocktail: Apply optimized mixture of directly-conjugated primary antibodies overnight at 4°C.
Counterstaining and Washing: Apply DAPI nuclear stain for 5-10 minutes, wash thoroughly.
Mounting: Apply anti-fade mounting medium and coverslip.
Imaging: Acquire images using fluorescence microscope or scanner with appropriate filter sets for each fluorophore.
Diagram 2: Spectral Overlap Considerations in Fluorescent mIHC. This diagram illustrates the challenge of fluorophore emission spectrum overlap and the necessity of multispectral imaging with computational unmixing for accurate signal separation in multiplexed panels.
The Scientist's Toolkit: Essential Research Reagents and Materials
Table 3: Essential Research Reagents for Multiplex IHC
| Reagent Category | Specific Examples | Function | Key Considerations |
|---|---|---|---|
| Primary Antibodies | Recombinant monoclonal antibodies [43] | Specific recognition of target epitopes | Validate for IHC application; check species/isotype for multiplexing; prefer recombinant for lot-to-lot consistency [43] |
| Detection Systems | HRP/AP polymers; Tyramide Signal Amplification (TSA) kits [5] [43] | Signal generation and amplification | TSA provides 100-fold sensitivity enhancement; enables high-plex cyclic staining [43] |
| Chromogenic Substrates | DAB (brown); AEC (red); Vector VIP (purple) [5] [43] | Enzyme-mediated color precipitation | Consider color separation for multiplexing; DAB is permanent and alcohol-resistant [5] |
| Fluorophores | Opal dyes; Alexa Fluor series [44] | Fluorescent signal generation | Match to microscope filter sets; consider spectral overlap; Opal dyes optimized for TSA [44] |
| Antigen Retrieval Buffers | Citrate (pH 6.0); EDTA (pH 8.0); Tris-EDTA [45] | Epitope unmasking after fixation | pH optimization critical for different antibodies; citrate suits most targets [45] |
| Blocking Reagents | Normal serum; protein-free blocking solutions [45] | Reduce non-specific background | Match serum species to secondary antibodies; protein-free blocks minimize interference [45] |
| Mounting Media | Permanent mounting media (chromogenic); Anti-fade media (fluorescent) [5] [45] | Slide preservation and signal protection | Anti-fade essential for fluorescent signal preservation; permanent media for chromogenic [5] |
| Automation Platforms | Automated stainers; Slide scanners [6] | Standardization and throughput | Essential for clinical translation; improves reproducibility and throughput [6] |
Image Acquisition and Analysis Strategies
Image Acquisition Modalities
The selection of appropriate image acquisition methods is critical for extracting meaningful data from multiplex IHC experiments:
Brightfield Imaging for Chromogenic mIHC: Whole slide scanning using brightfield scanners with consistent lighting conditions and 20x-40x objectives sufficient for most applications [6]. Color calibration slides recommended for quantitative comparisons across batches.
Multispectral Imaging for Fluorescent mIHC: Acquisition using multispectral imaging systems that capture the complete emission spectrum at each pixel location [6] [44]. This enables precise spectral unmixing of overlapping fluorophore signals through reference spectral libraries collected from single-stained controls [6] [44].
Region of Interest (ROI) Selection: Strategic selection of representative regions is essential for reproducible analysis. For heterogeneous tissues like tumors, sampling should include both tumor core and invasive margin, with minimum 5 high-power fields (0.33-0.64 mm² each) recommended [6]. Whole slide imaging is preferable when possible to avoid selection bias and capture tissue heterogeneity [6].
Image Analysis Workflows
Robust computational analysis pipelines transform multiplex IHC images into quantitative biological data:
Color Deconvolution (Chromogenic): Computational separation of overlapping chromogen signals using algorithms that leverage their distinct absorption spectra [6]. This generates separate channels for each marker, enabling quantitative analysis similar to fluorescence [6].
Spectral Unmixing (Fluorescent): Mathematical separation of fluorophore signals based on their characteristic emission spectra, correcting for autofluorescence and cross-talk [6] [44].
Tissue and Cell Segmentation: Identification of tissue regions (tumor, stroma, necrosis) and individual cell boundaries using nuclear markers (DAPI, hematoxylin) as reference [6]. Machine learning approaches improve accuracy in complex tissues.
Cell Phenotyping and Quantification: Classification of cells based on marker expression profiles and quantification of cell densities, spatial distributions, and cellular interactions [6].
Spatial Analysis: Advanced algorithms to characterize cellular spatial relationships, including nearest-neighbor analyses, spatial clustering, and compartment-specific cell densities [6] [44].
The strategic selection between chromogenic and fluorescent multiplex IHC approaches should be guided by specific research objectives, available resources, and intended applications. Chromogenic mIHC offers a practical pathway for laboratories with standard pathology infrastructure to implement limited-plex panels, particularly for clinical validation studies where permanent staining and familiarity with brightfield morphology are advantageous [5]. In contrast, fluorescent mIHC provides superior multiplexing capacity and quantitative capability essential for comprehensive spatial biology studies, particularly in immuno-oncology research where understanding complex cellular interactions within the tumor microenvironment predicts therapeutic response [6] [44].
As the field advances toward clinical translation, standardization and validation become increasingly critical. The Society for Immunotherapy of Cancer has developed best practice guidelines for staining validation and image analysis to promote reproducibility across laboratories [6]. Analytical performance targets should aim for coefficient of variation approximately 10% for detecting truly positive cells, comparable to established protein measurement assays like ELISA [44]. With proper implementation and validation, multiplex IHC platforms—whether chromogenic or fluorescent—provide powerful tools for unraveling complex biological processes, discovering novel biomarkers, and ultimately advancing personalized medicine approaches in the era of immunotherapy.
In Immunohistochemistry (IHC), signal amplification is a critical process for enhancing the detection of low-abundance targets, preserving the spatial context of proteins within tissue architecture [1]. These techniques are foundational to both chromogenic and fluorescent detection methodologies, enabling researchers to push the boundaries of sensitivity and multiplexing in biomedical research [5]. The choice between chromogenic and fluorescent detection systems fundamentally shapes experimental design, with each offering distinct advantages for specific applications in basic research and clinical diagnostics [46] [5].
The Avidin-Biotin Complex (ABC), Labeled Streptavidin-Biotin (LSAB), and Tyramide Signal Amplification (TSA) represent three pivotal amplification strategies that have dramatically improved IHC sensitivity [46]. The ABC method leverages the high-affinity interaction between avidin and biotin to form a large complex with multiple enzyme molecules [47]. LSAB refines this approach using streptavidin, which offers neutral isoelectric points that reduce non-specific binding [46]. TSA, a more recent development, utilizes the catalytic activity of horseradish peroxidase (HRP) to generate and deposit numerous labeled tyramide molecules at the antigen site, providing exceptional signal enhancement [48] [49]. Understanding the principles, applications, and practical implementation of these techniques is essential for researchers designing IHC experiments, particularly when working with challenging targets or pursuing multiplexed analysis of protein co-localization and interaction.
Principles and Mechanisms
Avidin-Biotin Complex (ABC)
The Avidin-Biotin Complex technique capitalizes on the exceptionally strong non-covalent interaction between avidin (or streptavidin) and biotin (vitamin B7), which has one of the highest known binding affinities in nature (Kd ≈ 10^−15 M) [47]. In this method, a biotinylated secondary antibody is first applied to the tissue section following primary antibody binding. Separately, a pre-formed complex is created between avidin (or streptavidin) and biotinylated enzyme molecules (typically HRP or alkaline phosphatase). When this complex is applied to the tissue, the avidin component binds with high affinity to the biotin on the secondary antibody, resulting in a large ternary complex containing multiple enzyme molecules [47]. Each enzyme molecule can then catalyze the conversion of many substrate molecules, leading to substantial signal amplification compared to direct detection methods. The primary distinction between ABC and LSAB lies in the formation of this pre-formed complex, which typically yields higher enzyme-to-antibody ratios and consequently greater signal amplification.
Labeled Streptavidin-Biotin (LSAB)
The Labeled Streptavidin-Biotin method operates on similar principles but employs a more streamlined approach. Rather than utilizing a pre-formed complex, LSAB directly employs enzyme-conjugated streptavidin molecules [46]. After incubation with a biotinylated secondary antibody, the enzyme-labeled streptavidin is applied, which binds directly to the biotin molecules on the secondary antibody. This approach typically offers faster staining times than ABC methods while maintaining high sensitivity. A key advantage of LSAB is the use of streptavidin (from Streptomyces avidinii) rather than avidin (from egg white), as streptavidin has a near-neutral isoelectric point that minimizes non-specific electrostatic interactions with tissue components, thereby reducing background staining [46]. This characteristic makes LSAB particularly valuable for tissues with endogenous biotin, such as liver and kidney, though additional blocking steps may still be required in these applications.
Tyramide Signal Amplification (TSA)
Tyramide Signal Amplification represents a more recent technological advancement that provides exponential signal enhancement through HRP-catalyzed activation and deposition of labeled tyramide molecules [48] [49]. In this process, HRP (typically conjugated to a secondary antibody) activates tyramide molecules in the presence of hydrogen peroxide, converting them into highly reactive radical intermediates. These activated tyramide species rapidly form covalent bonds with electron-rich amino acids (primarily tyrosine residues) on proteins in the immediate vicinity of the HRP-labeled antigen-antibody complex [49]. This deposition results in the localization of numerous reporter molecules (fluorophores or haptens) at the site of the target antigen, enabling dramatic signal amplification that can exceed conventional methods by 10- to 100-fold [49]. The covalent nature of tyramide deposition also enables sequential multiplexed staining, as the signal remains stable through subsequent antibody stripping steps, allowing researchers to detect multiple targets using primary antibodies from the same host species [49].
Figure 1: Comparative Mechanisms of ABC, LSAB, and TSA Signal Amplification. Each technique employs a distinct approach for signal amplification following primary antibody binding. ABC utilizes a pre-formed avidin-biotin-enzyme complex, LSAB employs enzyme-labeled streptavidin, and TSA generates reactive tyramide intermediates for covalent deposition [46] [49] [47].
Comparative Analysis of Amplification Techniques
The selection of an appropriate signal amplification method requires careful consideration of multiple parameters, including target abundance, required sensitivity, multiplexing needs, and available instrumentation. Each technique offers distinct advantages and limitations that make it suitable for specific experimental contexts.
Performance Characteristics and Applications
Table 1: Comparative Analysis of Signal Amplification Techniques for IHC
| Parameter | ABC | LSAB | TSA |
|---|---|---|---|
| Signal Amplification Factor | High (30-100x) [47] | Moderate to High (20-50x) [46] | Very High (100-1000x) [49] |
| Sensitivity | Excellent for medium to high abundance targets [47] | Excellent, suitable for many applications [46] | Exceptional, ideal for low abundance targets [49] |
| Multiplexing Compatibility | Limited in chromogenic format [5] | Limited in chromogenic format [5] | Excellent, enables sequential multiplexing [49] |
| Background Issues | Potential for endogenous biotin interference [46] | Reduced non-specific binding vs ABC [46] | Requires careful optimization to prevent non-specific deposition [49] |
| Protocol Complexity | Moderate (requires complex formation) [47] | Simple and rapid [46] | Complex, requires multiple optimization steps [49] |
| Best Applications | Chromogenic IHC with medium abundance targets [47] | Routine IHC with reduced background concerns [46] | Low abundance targets, multiplex fluorescence, co-localization studies [48] [49] |
Technical Considerations for Implementation
Each amplification method presents unique technical considerations that impact experimental design and implementation. For ABC and LSAB techniques, the presence of endogenous biotin represents a significant concern, particularly in tissues such as liver, kidney, and frozen sections where biotin-containing enzymes are abundant [46]. This limitation necessitates appropriate blocking steps using sequential avidin/biotin blocking solutions or potentially switching to alternative amplification methods for problematic tissues. Additionally, the size of the ABC complex (approximately 400-500 kDa) may limit tissue penetration in some applications, potentially reducing sensitivity for some intracellular epitopes.
TSA methods, while offering superior sensitivity, introduce their own technical challenges. The enzymatic reaction must be carefully controlled with respect to time, temperature, and tyramide concentration to prevent non-specific deposition and high background staining [49]. The order of antibody application in multiplexed TSA experiments requires empirical optimization, as epitopes may be differently affected by multiple rounds of heat-induced retrieval [49]. Furthermore, TSA-based detection typically requires specialized instrumentation for fluorescence imaging or spectral unmixing in multiplex applications, representing additional resource considerations [5] [41].
Experimental Protocols
ABC Immunohistochemistry Protocol
The following protocol outlines the standard procedure for ABC-based detection in formalin-fixed, paraffin-embedded (FFPE) tissue sections, with an estimated completion time of 2 days [1] [50].
Materials and Reagents:
- Primary antibody specific to target antigen
- Biotinylated secondary antibody (host-specific)
- ABC reagent (commercial kits available)
- Appropriate blocking serum
- Hydrogen peroxide (3%)
- Chromogenic substrate (DAB, AEC, or similar)
- Hematoxylin counterstain
- Mounting medium
Procedure:
- Tissue Preparation and Antigen Retrieval:
Blocking and Primary Antibody Incubation:
- Block endogenous peroxidase activity with 3% H₂O₂ for 10 minutes [50] [49].
- Block non-specific binding with appropriate normal serum (2-5% in buffer) for 30 minutes at room temperature [50].
- Incubate with optimized primary antibody dilution in antibody diluent overnight at 4°C in a humidified chamber [50].
ABC Complex Formation and Application:
Detection and Visualization:
Troubleshooting Notes:
- High background may indicate insufficient blocking; increase serum concentration or include avidin/biotin blocking steps [46] [50].
- Weak signal may require increased primary antibody concentration or extended incubation time [50].
TSA-based Multiplex Immunofluorescence Protocol
This protocol describes the procedure for fluorescent multiplex IHC using TSA technology, enabling detection of 3-8 targets on a single FFPE tissue section with an estimated completion time of 2-3 days [49].
Materials and Reagents:
- Primary antibodies from the same host species (if performing sequential staining)
- HRP-conjugated secondary antibodies (species-specific)
- Fluorophore-conjugated tyramide reagents (TSA Plus kits)
- SignalStain Boost IHC Detection Reagent (HRP) or equivalent
- ProLong Gold Antifade Reagent with DAPI
- Antigen retrieval buffer (citrate or EDTA)
- Stripping buffer (10 mM sodium citrate, pH 6.0)
Procedure:
- Slide Preparation and Antigen Retrieval:
Primary and Secondary Antibody Incubation:
- Block with 3% H₂O₂ for 10 minutes to quench endogenous peroxidase activity [49].
- Incubate with first primary antibody diluted in antibody diluent for 1 hour at room temperature or overnight at 4°C in a humidified chamber [49].
- Wash with TBST (2 × 3 minutes) [49].
- Incubate with appropriate HRP-conjugated secondary antibody for 30 minutes at room temperature protected from light [49].
Tyramide Signal Amplification:
Antibody Stripping and Sequential Staining:
- For multiplexing, perform antibody stripping by heating slides in 10 mM sodium citrate buffer (pH 6.0) at sub-boiling temperatures for 10 minutes, then cool for 30 minutes [49].
- Confirm antibody removal by checking for absence of signal before proceeding to next cycle [51].
- Repeat steps 2-4 for each additional target, using different fluorophore-conjugated tyramides [49].
Nuclear Counterstaining and Mounting:
Critical Optimization Parameters:
- Antibody Titration: Empirically determine optimal primary antibody dilution for each target, as TSA amplification may allow significantly higher dilutions than conventional IHC [49].
- Order Optimization: Test antibody application order to ensure epitopes are not compromised by multiple retrieval cycles; typically, place most sensitive antigens earlier in the sequence [49].
- Fluorophore Pairing: Assign brightest fluorophores to lowest abundance targets to balance signal intensity across markers [49].
- Stripping Validation: Confirm complete antibody removal between cycles to prevent cross-talk; hybridization oven-based stripping at 98°C (HO-AR-98) may preserve tissue integrity better than microwave methods for fragile tissues [51].
Figure 2: TSA-based Multiplex Immunofluorescence Workflow. This sequential staining approach enables detection of multiple targets using primary antibodies from the same host species. Antibody stripping between cycles removes primary and secondary antibodies while leaving covalently-deposited tyramide signals intact [51] [49].
Research Reagent Solutions
Successful implementation of signal amplification techniques requires high-quality reagents and optimized detection systems. The following table outlines essential components for establishing these methods in research and diagnostic applications.
Table 2: Essential Reagents for Signal Amplification Techniques
| Reagent Category | Specific Examples | Function | Application Notes |
|---|---|---|---|
| Amplification Systems | ABC kits, LSAB kits, TSA Plus kits | Signal enhancement | TSA kits available with fluorescein, Cy3, Cy5 fluorophores [49] |
| Enzyme Conjugates | HRP-conjugated secondary antibodies, AP-conjugated secondary antibodies | Catalyst for detection | HRP used for ABC, LSAB, and TSA; AP as alternative [5] |
| Chromogenic Substrates | DAB (brown), AEC (red), Vector Blue, Vector Red | Color precipitation | DAB provides permanent staining; alcohol-soluble substrates require aqueous mounting [5] |
| Blocking Reagents | Normal serum, BSA, Avidin/Biotin blocking kits | Reduce non-specific binding | Use serum from species unrelated to secondary antibody host [50] |
| Antigen Retrieval Buffers | Citrate (pH 6.0), EDTA (pH 8.0), Tris-EDTA | Epitope unmasking | EDTA generally more robust for cross-linked epitopes [49] |
| Mounting Media | Aqueous mounting media, Resin-based media, Anti-fade reagents (ProLong Gold) | Slide preservation | Anti-fade essential for fluorescence; resin-based for chromogenic [50] [49] |
Signal amplification techniques represent fundamental tools in modern immunohistochemistry, each offering unique capabilities that extend the sensitivity and multiplexing potential of protein detection in tissue contexts. The ABC method provides robust amplification through the high-affinity avidin-biotin interaction, while LSAB offers streamlined protocols with reduced background. TSA technology delivers exceptional sensitivity for challenging targets and enables sophisticated multiplexing approaches that are revolutionizing spatial biology research.
The choice between these amplification strategies must be guided by experimental objectives, target characteristics, and available resources. As IHC continues to evolve toward higher-plex spatial profiling, TSA-based methods particularly offer exciting opportunities for unraveling cellular interactions in health and disease. By understanding the principles, applications, and practical implementation details of these amplification techniques, researchers can optimize their experimental designs to generate reliable, reproducible data that advances our understanding of protein localization and expression in complex biological systems.
In the context of chromogenic versus fluorescent immunohistochemistry (IHC) research, the initial choice between Formalin-Fixed Paraffin-Embedded (FFPE) and frozen tissue sections is a critical determinant of experimental success. This decision directly influences the feasibility, sensitivity, and quantitative accuracy of subsequent detection methods [52] [53]. FFPE tissues, preserved through formalin fixation and paraffin embedding, excel in preserving morphological detail for pathological analysis, making them a mainstay for chromogenic detection in clinical diagnostics [52]. In contrast, frozen tissues, prepared through rapid snap-freezing, superiorly preserve labile epitopes and native biomolecules, offering a significant advantage for sensitive multiplex fluorescent detection [52] [54]. This application note delineates the properties, protocols, and optimal applications of these two sample preparation methods, providing a framework for researchers to align their tissue preparation with their IHC detection goals.
Comparative Analysis: FFPE vs. Frozen Tissues
The choice between FFPE and frozen tissues involves balancing multiple factors, including biomolecule preservation, structural integrity, storage requirements, and compatibility with downstream detection techniques. The table below provides a detailed, quantitative comparison to guide this decision.
Table 1: Comprehensive Comparison of FFPE and Frozen Tissue Properties
| Characteristic | FFPE Tissues | Frozen Tissues |
|---|---|---|
| Preservation Method | Formalin fixation, ethanol dehydration, paraffin embedding [52] [55] | Snap-freezing in liquid nitrogen or isopentane, embedded in OCT compound [52] [54] |
| Nucleic Acid Quality | Degraded; cross-linked and fragmented [52] [53] | High-quality; intact DNA and RNA preserved in their natural state [52] [53] |
| Protein State | Denatured; cross-linked, potential epitope masking [52] [53] | Native conformation; antigens and enzymes often remain active [52] [53] |
| Morphology Preservation | Excellent; fine cellular architecture well-preserved [52] | Good to Moderate; potential for ice crystal artifacts [54] |
| Room Temperature Storage | Stable for decades [52] | Not possible; degrades quickly at room temperature [52] |
| Long-Term Storage | Room temperature (after processing) [52] | ≤ -80°C [52] |
| Best for Chromogenic IHC | Excellent; standard for clinical pathology and single-plex staining [52] [5] | Good; requires post-sectioning fixation [54] |
| Best for Fluorescent IHC / Multiplexing | Limited (3-5 markers); requires extensive optimization and antigen retrieval [5] | Excellent (5-10+ markers); superior for co-localization studies and sensitive detection [54] [5] |
| Typical Sectioning Thickness | 3 - 10 µm [55] | 5 - 8 µm [54] |
| Cost & Infrastructure | Low cost; requires microtome, standard lab equipment [52] | Higher cost; requires cryostat, -80°C freezers, liquid nitrogen [52] |
Experimental Protocols
Protocol for FFPE Sample Preparation and Staining (IHC-P)
The following protocol for IHC on paraffin-embedded sections (IHC-P) is optimized for balancing morphology with antigen accessibility, a prerequisite for both chromogenic and fluorescent detection [56] [55].
Stage 1: Fixation and Embedding
- Fixation: Immediately upon collection, immerse tissue in 10% Neutral Buffered Formalin (NBF) for 18-24 hours at 4°C. Note: Under-fixation causes edge staining and degradation, while over-fixation masks epitopes [55].
- Dehydration & Clearing: Process the fixed tissue through a series of ethanol washes (50% to 100%) followed by xylene (or a safer alternative) to remove water and lipids [55].
- Embedding: Infiltrate the tissue with molten paraffin wax (at 50-60°C) using a vacuum oven or automated system. Orient the tissue in a mold, fill with fresh paraffin, and cool to form a solid block [52] [55].
Stage 2: Sectioning and Deparaffinization
- Sectioning: Trim the paraffin block and cut thin sections of 3-10 µm using a microtome. Float sections on a 40-45°C water bath to flatten, then mount onto glass slides. Dry slides overnight at 37°C [55].
- Deparaffinization & Rehydration: Prior to staining, sequentially incubate slides in:
Critical: Do not let slides dry out from this point forward, as this causes high non-specific background [55].
Stage 3: Antigen Retrieval and Staining
- Antigen Retrieval: For most formalin-fixed tissues, this step is essential to break methylene cross-links and expose epitopes [55].
- Heat-Induced Epitope Retrieval (HIER): Submerge slides in 10mM Sodium Citrate Buffer (pH 6.0) and heat in a microwave or steamer until boiling. Continue boiling for 15 minutes, then cool at room temperature for 20 minutes [56].
- Enzymatic Retrieval: As an alternative, submerge slides in Proteinase K (20 µg/mL) or Trypsin for 10-20 minutes at 37°C [56].
- Immunostaining:
- Blocking: Wash slides in PBS. Block endogenous peroxidase activity with 0.3% H₂O₂ (15-40 minutes) if using HRP-based detection. Block non-specific protein binding with 10% normal serum from the secondary antibody host species for 1 hour [56].
- Antibody Incubation: Incubate with primary antibody diluted in blocking buffer for 2 hours at room temperature or overnight at 4°C. Wash in PBS. Incubate with an enzyme-conjugated (e.g., HRP) or fluorophore-conjugated secondary antibody for 1 hour at room temperature [56].
- Detection:
- Chromogenic: Incubate with a substrate like DAB until brown color develops. Monitor carefully under a microscope [56].
- Fluorescent: Proceed to mounting if the secondary antibody is fluorophore-conjugated.
- Counterstaining & Mounting: Counterstain nuclei with Hematoxylin (for chromogenic) or DAPI (for fluorescent). Dehydrate chromogenic sections through graded alcohols and xylene, then mount with a permanent medium. Mount fluorescent sections with an aqueous, anti-fade mounting medium [56] [57].
Figure 1: FFPE sample preparation and staining involves extensive processing to preserve morphology and make antigens accessible for detection.
Protocol for Frozen Sample Preparation and Staining (IHC-F)
This protocol for IHC on frozen sections (IHC-F) prioritizes the preservation of antigenicity and is ideal for labile targets and multiplex fluorescent IHC [54] [57].
Stage 1: Snap-Freezing and Embedding
- Preparation: Chill isopentane in a metal container surrounded by dry ice. The isopentane should be cold but not completely frozen [54].
- Embedding: Place fresh, unfixed tissue in a mold and completely surround it with Optimal Cutting Temperature (OCT) compound [54].
- Snap-Freezing: Using forceps, hold the tissue mold in the cold isopentane bath for 10-20 seconds until the OCT block turns opaque. Store the frozen block at -80°C until sectioning [52] [54].
Stage 2: Cryosectioning
- Equilibration: Transfer the frozen tissue block to a cryostat and equilibrate at -20°C overnight [54].
- Sectioning: Trim the block to expose the tissue surface. Cut sections at 5-8 µm thickness using a cryostat [54].
- Mounting: Collect sections with a brush or directly onto room temperature slides. Air-dry the mounted sections briefly (e.g., 15 minutes) at room temperature [54] [57].
Stage 3: Fixation and Staining
- Fixation: Fix the air-dried sections by immersing them in a suitable fixative for 10-15 minutes at room temperature. The choice depends on the target antigen:
- Washing: Wash fixed slides three times for 5-10 minutes in Tris-Buffered Saline (TBS) or PBS [57].
- Immunostaining:
- Blocking: Incubate sections in a protein blocking buffer (e.g., 10% normal serum with 0.3% Triton X-100) for 1 hour at room temperature. For biotinylated antibodies, perform an endogenous avidin/biotin block [54] [57].
- Antibody Incubation: Incubate with primary antibody diluted in incubation buffer overnight at 4°C. Wash and incubate with fluorophore-conjugated secondary antibody for 1 hour at room temperature in the dark [57].
- Counterstaining & Mounting: Counterstain nuclei with DAPI if desired. Wash and mount slides with an aqueous, anti-fade mounting medium. Store slides at 4°C in the dark prior to imaging [54] [57].
Figure 2: Frozen sample preparation uses rapid freezing to preserve antigens, with fixation and staining performed on sections.
The Scientist's Toolkit: Essential Reagents and Materials
Successful IHC relies on a suite of specialized reagents and tools. The following table details key solutions and their specific functions in the experimental workflow.
Table 2: Key Research Reagent Solutions for IHC
| Reagent / Material | Function / Application |
|---|---|
| 10% Neutral Buffered Formalin (NBF) | Standard cross-linking fixative for FFPE; preserves morphology but can mask epitopes [55] [1]. |
| Optimal Cutting Temperature (OCT) Compound | Water-soluble embedding medium used to support tissue during cryosectioning [54]. |
| Phosphate Buffered Saline (PBS) / Tris Buffered Saline (TBS) | Isotonic buffers used for washing tissues and diluting reagents [56] [57]. |
| Normal Serum (e.g., Goat, Donkey) | Used as a protein block to reduce non-specific binding of secondary antibodies [56] [54]. |
| Sodium Citrate Buffer (pH 6.0) | Common buffer for Heat-Induced Epitope Retrieval (HIER) to unmask antigens in FFPE tissue [56]. |
| Proteinase K / Trypsin | Enzymes for proteolytic antigen retrieval, an alternative to HIER for certain epitopes [56]. |
| Primary Antibody (Monoclonal/Polyclonal) | Binds specifically to the target antigen of interest. Requires rigorous validation for IHC [56] [1]. |
| Enzyme-Conjugated Secondary Antibody (e.g., HRP) | Binds to the primary antibody and catalyzes a chromogenic reaction (e.g., with DAB) for visualization [56] [58]. |
| Fluorophore-Conjugated Secondary Antibody | Binds to the primary antibody and emits light at a specific wavelength upon excitation for fluorescent detection [58] [1]. |
| DAB (3,3'-Diaminobenzidine) | Chromogenic substrate for HRP; produces a brown, insoluble precipitate that is permanent and viewable by brightfield microscopy [56] [5]. |
| Hematoxylin | A basic dye used as a nuclear counterstain in chromogenic IHC [56]. |
| DAPI (4',6-diamidino-2-phenylindole) | A fluorescent stain that binds strongly to DNA, used as a nuclear counterstain in fluorescent IHC [57]. |
Concluding Recommendations for IHC Research
The strategic selection of sample preparation methodology is foundational to robust IHC data, particularly within a thesis investigating chromogenic and fluorescent detection.
- For Chromogenic IHC Research: FFPE is the gold standard. Its superior morphology and compatibility with brightfield microscopy make it ideal for single-plex protein localization, clinical pathology, and studies requiring archival tissue analysis. Its limitations in multiplexing and potential for epitope masking must be acknowledged [52] [5].
- For Fluorescent IHC and Multiplexing Research: Frozen tissues are generally superior. The preservation of native biomolecules and reduced epitope masking enables highly sensitive detection of multiple targets simultaneously. This is crucial for complex applications like tumor microenvironment mapping or co-localization studies, despite the challenges of more demanding storage and sectioning [52] [54] [5].
- Guiding Principle: FFPE prioritizes structure, while frozen prioritizes antigenicity. By carefully considering the research objectives—whether they lean towards morphological clarity or sensitive, multi-target biomolecular analysis—scientists can make an informed choice that ensures the integrity and success of their IHC experiments.
Solving Common Challenges in IHC Detection
Combating Autofluorescence in Tissues and Quenching Techniques
Autofluorescence is a pervasive challenge in immunohistochemistry (IHC), particularly in fluorescence-based detection methods. It refers to the background fluorescence emitted by endogenous molecules within biological samples, which is not the result of staining with a specific fluorescent probe [59]. This nonspecific signal can severely reduce assay sensitivity by increasing background noise and may even completely mask the specific signal from antibody-conjugated fluorophores, potentially leading to inaccurate data interpretation [59]. The issue is most prominent in the green channel, where it can interfere with common fluorophores such as Alexa Fluor 488 and fluorescein isothiocyanate (FITC), as well as the detection of green fluorescent protein (GFP) [59]. Within the broader context of chromogenic versus fluorescent IHC research, managing autofluorescence is crucial for leveraging the multiplexing capabilities and quantitative potential of fluorescence methods while maintaining signal fidelity.
Effective management of autofluorescence begins with identifying its origins, which can be categorized as either endogenous to the tissue or introduced during sample processing.
Many endogenous biological molecules naturally autofluoresce. Key contributors include [59]:
- Lipofuscin: A pigmented byproduct of intracellular catabolism that accumulates over time in post-mitotic cells like neurons and myocytes.
- Collagen and Elastin: Structural components of the extracellular matrix.
- Flavins (e.g., riboflavin, FMN, FAD) and NADH: Metabolic coenzymes with essential roles in cellular energy production.
- Heme: An iron-containing complex found in hemoproteins like hemoglobin.
- Aromatic amino acids: Phenylalanine, tryptophan, and tyrosine.
- Melanin: A pigment produced by melanocytes in the skin, hair, and iris.
Autofluorescence can also be introduced through common laboratory reagents and procedures [59] [1]:
- Aldehyde fixatives (e.g., formaldehyde, paraformaldehyde, glutaraldehyde) can yield autofluorescence by reacting with amine groups to form fluorescent Schiff's bases [59] [60].
- Plastic microplates and cell culture flasks.
- Media supplements like Fetal Bovine Serum (FBS) and Phenol Red.
Detecting and Evaluating Autofluorescence
Before implementing quenching techniques, it is essential to evaluate the level and spectral characteristics of autofluorescence in your specific sample type.
The recommended method is to run an unstained control [59]. This involves preparing a sample identical to the experimental ones but omitting the fluorescently-labeled reagent. This control should be observed using all available microscope filter sets or laser lines to map the autofluorescence profile. For multiplexed experiments, an unstained tissue sample is a mandatory control for subsequent spectral unmixing [61].
Table 1: Common Autofluorescence Sources and Their Spectral Profiles
| Source | Primary Emission Region | Commonly Interferes With |
|---|---|---|
| Lipofuscin [59] | Broad spectrum (yellow-red) | Multiple channels, especially green and red |
| Collagen & Elastin [59] | Green | FITC, Alexa Fluor 488, GFP |
| NADH [59] | Blue/green | DAPI, CF450, Pacific Blue |
| Flavins [59] | Green | FITC, Alexa Fluor 488 |
| Aldehyde-induced [59] | Broad spectrum | All channels, but can be reduced |
Established Quenching Techniques: Protocols and Applications
Several physical and chemical methods have been developed to mitigate autofluorescence. The choice of method depends on the sample type, the source of autofluorescence, and the antigens and fluorophores being used.
Chemical Quenching
Chemical treatments are among the most common and practical approaches for reducing autofluorescence.
Sudan Black B Protocol
Sudan Black B is a lipophilic dye that effectively quenches autofluorescence from lipids and lipofuscin [59] [62].
- After completing the immunostaining procedure and final buffer washes, incubate the tissue sections with a solution of 0.1-0.3% Sudan Black B in 70% ethanol for 10-20 minutes at room temperature [59].
- Wash the sections thoroughly with phosphate-buffered saline (PBS) or your preferred buffer to remove excess dye.
- Mount the slides with an appropriate antifade mounting medium and proceed to imaging.
Note: It is crucial to perform a pilot test, as over-incubation can potentially quench the specific immunofluorescence signal [62].
Borohydride Reduction Protocol
This method is particularly effective for reducing autofluorescence induced by aldehyde fixatives, which is a primary concern for IHC [59] [60].
- Following tissue sectioning and deparaffinization (if using FFPE tissue), wash slides in PBS.
- Treat sections with a freshly prepared solution of sodium borohydride (NaBH4) at 1 mg/mL in PBS for 30-60 minutes on ice [60]. Caution: This reaction produces hydrogen gas, so do not seal the container.
- Wash the slides extensively with PBS (e.g., 3 x 5 minutes) before proceeding with standard immunostaining protocols.
Photobleaching with Chemical Assistance
A powerful and recently described method uses strong white light in the presence of chemicals to rapidly photobleach autofluorescence [61].
- Reagent Preparation:
- Prepare a working autofluorescence solution of 4.5% hydrogen peroxide and 24 mM NaOH in PBS [61].
- Procedure:
- After antigen retrieval and permeabilization, rinse samples with PBS.
- Place slides in a clear container covered with the working autofluorescence solution.
- Illuminate with white light for 30 minutes. Do not use UV light, as it can destroy certain antigens [61].
- Wash slides 3 times with PBST before proceeding to the blocking step.
Strategic and Instrumental Approaches
Beyond direct chemical treatment, strategic choices in fluorophore selection and instrumentation can circumvent autofluorescence.
- Selecting Far-Red and Near-Infrared Fluorophores: Since tissue autofluorescence is most intense in the green spectrum, shifting detection to the far-red and near-infrared (NIR) regions (e.g., with Alexa Fluor 647, 680, 750) can dramatically improve the signal-to-noise ratio [59] [60].
- Spectral Imaging and Unmixing: This advanced fluorescence microscopy technique acquires the entire emission spectrum at every pixel. Computational "unmixing" can then distinguish the unique spectral signature of specific fluorophores from the broad spectrum of autofluorescence, effectively subtracting it digitally [5].
- Fluorescence Lifetime Imaging Microscopy (FLIM): This technique separates signals based on the fluorescence lifetime (how long the fluorophore remains excited) rather than just color. A 2025 study demonstrated that high-speed FLIM can robustly separate autofluorescence from immunofluorescence signals by leveraging their distinct lifetime profiles, a method that is not affected by the spectral overlap that challenges other techniques [62].
Table 2: Comparison of Major Autofluorescence Quenching Techniques
| Technique | Mechanism of Action | Best For | Advantages | Limitations |
|---|---|---|---|---|
| Sudan Black B [59] | Non-covalent binding to and quenching of lipophilic structures. | Lipofuscin, lipids, general tissue autofluorescence. | Highly effective for specific sources; simple protocol. | Can quench specific signal if over-used; requires ethanol. |
| Borohydride Reduction [59] [60] | Reduces fluorescent Schiff's bases formed by aldehyde fixation. | Aldehyde-fixed tissues (most FFPE and PFA-fixed samples). | Targets a major source of autofluorescence directly. | Generates gas bubbles; requires fresh preparation. |
| Photobleaching (H2O2/NaOH + Light) [61] | Chemical and light-induced oxidation and degradation of fluorophores. | Broad-spectrum autofluorescence in robust samples. | Rapid and effective; treats the entire sample uniformly. | Harsh conditions may damage some antigens or epitopes. |
| Spectral Unmixing [5] | Digital separation of signals based on unique emission spectra. | Multiplexed samples with overlapping signals. | Non-destructive; powerful for complex experiments. | Requires specialized and expensive imaging systems. |
| FLIM [62] | Separation of signals based on fluorescence lifetime decay kinetics. | All sample types, especially where spectral separation is impossible. | Provides a physical parameter independent of intensity/concentration. | Requires highly specialized and costly FLIM instrumentation. |
The Scientist's Toolkit: Essential Reagents and Materials
Table 3: Research Reagent Solutions for Autofluorescence Quenching
| Reagent / Material | Function / Application | Example / Notes |
|---|---|---|
| Sudan Black B [59] | Chemical quencher for lipofuscin and lipid-related autofluorescence. | Prepare a 0.1-0.3% solution in 70% ethanol. |
| Sodium Borohydride (NaBH4) [59] [60] | Reducing agent to neutralize aldehyde-induced fluorescence. | Use a fresh 1 mg/mL solution in PBS or TBS. |
| Hydrogen Peroxide & NaOH Solution [61] | Chemical component for photobleaching-based autofluorescence reduction. | Working solution: 4.5% H2O2 and 24 mM NaOH in PBS. |
| Pontamine Sky Blue / Trypan Blue [60] [62] | Alternative chemical quenchers for general tissue autofluorescence. | Less commonly used than Sudan Black B. |
| Near-Infrared Fluorophore-conjugated Antibodies [59] [60] | Strategic detection to avoid the high autofluorescence in the green channel. | Alexa Fluor 647, 680, 750; Cy5, Cy7. |
| Sodium Citrate / EDTA Buffer [60] [63] | Antigen retrieval buffers; choice can affect autofluorescence and signal. | pH 6.0 Citrate or pH 9.0 EDTA are standard for HIER. |
Experimental Workflow for Autofluorescence Management
The following diagram illustrates a logical, step-by-step workflow for diagnosing and addressing autofluorescence in an IHC experiment, integrating the protocols and strategies detailed in this note.
IHC Autofluorescence Management Workflow
Within the ongoing research comparing chromogenic and fluorescent IHC, autofluorescence remains a significant hurdle that can compromise the advantages of fluorescence detection. No single method for combating autofluorescence is universally ideal. The choice between chromogenic and fluorescent detection may, in fact, be influenced by the inherent autofluorescence of the target tissue; chromogenic IHC is inherently immune to this problem and may be preferable for severely autofluorescent tissues when multiplexing is not required [5] [64]. However, for researchers committed to fluorescence, a combination of careful experimental design, including the use of appropriate controls, and the strategic application of the quenching protocols outlined herein, is essential. By systematically evaluating autofluorescence and applying a targeted quenching strategy, researchers can significantly improve the quality, reliability, and interpretability of their fluorescent IHC data.
Preventing Photobleaching of Fluorophores and Signal Fading
Within the broader comparison of chromogenic versus fluorescent detection methods in immunohistochemistry (IHC), a significant practical challenge for researchers is photobleaching – the irreversible loss of fluorescence signal upon light exposure. Unlike chromogenic detection, which produces stable, permanent precipitates ideal for long-term archival storage, fluorescent signals are inherently transient [65] [5]. This fading compromises quantitative analysis, threatens experimental reproducibility, and represents a key operational disadvantage when balanced against the superior multiplexing capabilities of fluorescence. This application note details the mechanisms of photobleaching and provides validated, actionable protocols to mitigate signal degradation, enabling researchers to leverage the full power of fluorescent IHC with greater reliability and data integrity.
Quantitative Impact of Photobleaching on Data Integrity
Understanding the precise quantitative effects of photobleaching is essential for appreciating its risks. A 2025 study systematically measured how illumination time and fluorophore choice alter critical morphometric parameters in neuronal and microglial cells [66].
Table 1: Impact of Illumination Time on Fluorescence Signal and Morphological Data [66]
| Illumination Time | Mean Fluorescence Intensity | Number of Detectable Neuronal Profiles | Microglial Area Coverage | Fractal Dimension (Complexity) |
|---|---|---|---|---|
| 0 s (Control) | 100% | 100% | 100% | 100% |
| 30 s | ≈ 70% | ≈ 95% | ≈ 90% | ≈ 98% |
| 60 s | ≈ 50% | ≈ 90% | ≈ 85% | ≈ 95% |
| 300 s (5 min) | ≈ 25% | ≈ 80% | ≈ 75% | ≈ 90% |
| 900 s (15 min) | < 10% | ≈ 70% | ≈ 60% | ≈ 80% |
The data reveal that mean fluorescence intensity is the most vulnerable parameter, suffering rapid and severe decay. While cell counting is more resilient, it still degrades with prolonged exposure. Critically, complex morphological features, such as the intricate arborization of microglial cells quantified by fractal analysis, are also significantly altered by photobleaching [66]. This demonstrates that fading does not just dim signals; it can actively distort the scientific interpretation of cellular shape and complexity. Furthermore, the photostability of fluorophores varies; for instance, Alexa Fluor 488 Plus exhibits increased resistance to fading compared to standard Alexa Fluor 546 [66].
Proven Methodologies to Minimize Photobleaching
Protocol 1: Chemical-Assisted Photobleaching for Autofluorescence Reduction
A primary source of noise in fluorescent IHC is tissue autofluorescence (AF). This protocol uses intense light and a chemical agent to pre-bleach AF prior to antibody staining, significantly improving the signal-to-noise ratio [67].
- Objective: Suppress tissue autofluorescence in formalin-fixed paraffin-embedded (FFPE) tissue sections.
- Key Principle: High-power, multispectral LED illumination in the presence of hydrogen peroxide (H₂O₂) catalytically accelerates the bleaching of endogenous fluorophores without completely destroying the target antigenicity [67].
- Materials:
- Workflow:
- Procedure:
- Tissue Preparation: Process FFPE tissue sections through standard deparaffinization and rehydration steps [67].
- Bleaching Setup: Submerge the tissue slide in the freshly prepared bleaching solution within a Petri dish.
- Illumination: Place the dish under the LED array and illuminate for 1 to 3 hours. Note: Without H₂O₂, this process can require 24 hours or more [67].
- Post-Bleaching Processing: Rinse the slide thoroughly with PBS before proceeding to standard antigen retrieval and immunofluorescence staining protocols.
- Technical Notes: This pre-bleaching treatment is highly effective at reducing AF that interferes with detection, particularly in tissues prone to high background, such as liver, kidney, and spleen [65] [67].
Protocol 2: Optimized Imaging and Mounting to Preserve Signal
This protocol focuses on preserving signal during the imaging process itself through the use of photostable reagents and careful microscopy practices.
- Objective: Acquire high-fidelity images while minimizing fluorophore photobleaching during observation.
- Key Principle: Limit the total photon exposure to the sample by controlling illumination and using mounting media that reduces fading [66].
- Materials:
- Workflow:
- Procedure:
- Mounting: After immunostaining, apply an antifade mounting medium and seal the coverslip edges with clear nail polish to prevent evaporation and oxygen permeation, which exacerbates bleaching.
- Microscope Setup: Before imaging the experimental slide, use a dedicated control section to set all acquisition parameters (e.g., exposure time, lamp power, camera gain). This prevents unnecessary pre-imaging exposure of the sample [66].
- Image Acquisition: Use the lowest possible light intensity and shortest exposure time necessary to detect the signal. When capturing multiple channels or Z-stacks, use automated software to ensure speed and consistency across samples.
Advanced Technique: FLIM for Autofluorescence Suppression
For the most challenging cases, Fluorescence Lifetime Imaging Microscopy (FLIM) offers a powerful digital solution that does not rely on chemical or photonic quenching.
- Principle: FLIM distinguishes specific immunofluorescence (IF) from background autofluorescence (AF) based on their distinct fluorescence lifetime decay profiles, not just their emission spectra. AF typically has a shorter, broader lifetime distribution, while fluorophores like CF450 have a longer, narrower lifetime [62].
- Implementation: A high-speed FLIM system using GPU-accelerated phasor analysis can separate these signals in real-time. The fractional contribution of the specific IF signal in a mixed pixel is calculated geometrically in the phasor plot based on its distance to reference points for pure IF and pure AF [62].
- Advantage: This method effectively "subtracts" autofluorescence digitally without damaging the sample or bleaching the signal, providing a robust autofluorescence-free image that shows excellent correlation with traditional IHC [62].
The Scientist's Toolkit: Essential Reagent Solutions
Table 2: Key Research Reagents for Photobleaching Prevention
| Reagent / Material | Function / Description | Example Product |
|---|---|---|
| Antifade Mounting Medium | Reduces photobleaching by scavenging free radicals and minimizing oxygen exposure; critical for image preservation. | Fluoromount-G [66] |
| Photostable Fluorophores | Engineered fluorescent dyes with enhanced resistance to photobleaching for more reliable quantification. | Alexa Fluor 488 Plus [66] |
| Bleaching Solution (H₂O₂/NaOH) | Chemical-assisted pre-bleaching to suppress tissue autofluorescence prior to antibody staining. | 4.5% H₂O₂, 20 mM NaOH in PBS [67] |
| High-Power LED Array | Provides intense, multispectral light required for efficient photobleaching of autofluorescence. | Multi-band LED grow light panel [67] |
| FLIM System | Advanced microscope system that separates specific signal from autofluorescence via fluorescence lifetime. | GPU-accelerated high-speed FLIM [62] |
Addressing Chromogen Overlap and Mixed Color Issues
In the broader context of chromogenic versus fluorescent detection methods for immunohistochemistry (IHC), researchers face a fundamental challenge: chromogen overlap and mixed color issues [68]. While chromogenic detection (IHC) offers permanent slides compatible with brightfield microscopy, its utility in multiplexing (detecting multiple targets simultaneously) is severely limited by color blending that can obscure specific signal localization [68] [7]. In contrast, fluorescent detection (IF/IHF) allows for superior multiplexing capabilities with independent signal analysis but requires specialized equipment and suffers from signal fading over time [24] [7]. This application note details the sources of chromogen overlap and provides validated protocols to minimize its impact, enabling researchers to make informed choices between detection methodologies based on their experimental goals.
The Problem of Chromogen Overlap
Chromogenic detection relies on enzymes such as Horseradish Peroxidase (HRP) or Alkaline Phosphatase (AP) converting soluble substrates into insoluble colored precipitates at the antigen site [68] [24]. When attempting to visualize more than one target in a single sample, these colored deposits can physically overlap or blend in the same cellular compartment.
The core issue is that overlapping chromogenic stains will either blend into a mixed color or lie directly on top of one another, making it difficult or impossible to determine the precise cellular co-localization of different targets [68]. This physical mixing is a fundamental limitation of chromogenic chemistry, whereas fluorescent markers with distinct emission spectra can be analyzed independently even when targets co-localize [68]. The problem is exacerbated when using chromogens with similar hues or when the target proteins are expressed in the same subcellular location.
Quantitative Comparison of Common Chromogens
Table 1: Properties of Common Chromogens for Multiplex IHC
| Enzyme | Chromogen | Color | Mounting Media | Suitability for Multiplexing |
|---|---|---|---|---|
| HRP | DAB | Brown | Organic [24] | Good, intense permanent signal [24] |
| HRP | AEC | Red | Aqueous [24] | Good, contrasts well with blue [24] |
| AP | BCIP/NBT | Blue/Black | Organic [24] | Good, intense color [24] |
| AP | Fast Red TR | Red | Aqueous [24] | Fair, prone to fading [24] |
| HRP | StayYellow | Yellow | Aqueous [24] | Excellent, alternative color [24] |
| AP | StayGreen | Green | Organic [24] | Excellent, alternative color [24] |
Experimental Strategies to Minimize Chromogen Overlap
Strategic Approach 1: Careful Chromogen Selection
The most effective first step is selecting chromogens with distinctly different colors that provide high visual contrast when viewed together. Combinations like DAB (brown) with Fast Blue BB (blue) or StayYellow (yellow) with StayGreen (green) create more distinguishable signals than combinations with similar hues [24]. Consider the relative abundance of your targets—using a more intense chromogen like DAB for low-abundance targets and less intense options for highly expressed proteins can help balance signal perception [68].
Strategic Approach 2: Sequential Staining with Intervening Blocking Steps
For multiplexing with primary antibodies from different species, implement a rigorous sequential staining protocol:
- Apply first primary antibody raised in species A (e.g., rabbit) and incubate overnight at 4°C [19].
- Detect with appropriate enzyme-conjugated secondary (e.g., anti-rabbit HRP) and develop with first chromogen (e.g., DAB) [19] [69].
- Apply intense blocking after first chromogen development:
- Option A: Antibody elution using low-pH buffer or heat treatment to remove first primary/secondary antibody complex [24].
- Option B: Denaturation of first enzyme (HRP/AP) by heating or chemical inhibition to prevent cross-reactivity in subsequent rounds [24].
- Option C: Species-specific blocking when using same-species primaries: incubate with unconjugated secondary antibody from species A to block any remaining binding sites [24].
- Apply second primary antibody raised in species B (e.g., mouse) and incubate overnight at 4°C [19].
- Detect with different enzyme-conjugated secondary (e.g., anti-mouse AP) and develop with second chromogen (e.g., Fast Red) [24].
Strategic Approach 3: Technical Replication and Controls
Always include single-stained controls for each target alone to reference the pure chromogen color, plus a mixed control where all targets are stained simultaneously to verify that individual signals remain distinguishable [69]. Isotype controls help identify non-specific background staining that could contribute to color confusion [69].
Table 2: Detection System Comparison for Multiplexing
| Parameter | Chromogenic IHC | Fluorescent IF/IHF | Ultra-high-plex IF |
|---|---|---|---|
| Max Markers/Slide | 1-2 [7] | 2-8 [7] | 10-60 [7] |
| Co-localization Analysis | Limited [68] | Excellent [68] [7] | Superior [7] |
| Signal Stability | Permanent, archivable [24] [7] | Moderate (photobleaching risk) [68] [7] | Moderate (software-corrected) [7] |
| Equipment Needed | Brightfield microscope [7] | Fluorescence microscope [7] | Advanced scanner + AI analytics [7] |
| Best Application | Diagnostic workflows, archiving [7] | Spatial biology, co-localization [68] [7] | Tumor microenvironment, complex panels [7] |
Detailed Experimental Protocols
Protocol 1: Sequential Chromogenic IHC for 2-Plex Detection
This protocol optimizes chromogen separation using heat-induced epitope retrieval and sequential staining with antibody elution between rounds.
Research Reagent Solutions:
- Primary Antibodies: Rabbit anti-Target A and Mouse anti-Target B
- Detection System: HRP-based and AP-based polymer detection kits
- Chromogens: DAB (brown) and Fast Red (red)
- Blocking Solution: 1% BSA, 1% normal serum, 0.3% Triton X-100 in PBS [19]
- Antigen Retrieval Buffer: Citrate buffer (pH 6.0) or EDTA buffer (pH 8.0) [19]
Methodology:
- Deparaffinization and Antigen Retrieval:
- Bake FFPE slides at 60°C for 1 hour [19].
- Deparaffinize in xylene (2 changes, 3 minutes each) [19].
- Rehydrate through graded ethanol series (100%, 100%, 95%, 70%, 50%) for 3 minutes each [19].
- Perform Heat-Induced Epitope Retrieval (HIER) by boiling in citrate buffer (pH 6.0) for 20 minutes at approximately 98°C [19].
- Cool slides for 30 minutes at room temperature.
First Immunostaining Round:
- Block endogenous peroxidase with 3% H₂O₂ for 15 minutes [69].
- Apply protein block with serum blocking reagent for 15 minutes [69].
- Incubate with Rabbit anti-Target A diluted in incubation buffer overnight at 4°C [19] [69].
- Detect with anti-rabbit HRP polymer for 30 minutes at room temperature [24].
- Develop with DAB chromogen for 3-10 minutes, monitoring intensity under microscope [69].
- Rinse with wash buffer 3 times for 10 minutes each [69].
Antibody Elution and Blocking:
Second Immunostaining Round:
- Block endogenous alkaline phosphatase with levamisole solution (for intestinal AP) for 10 minutes.
- Incubate with Mouse anti-Target B diluted in incubation buffer overnight at 4°C [19] [69].
- Detect with anti-mouse AP polymer for 30 minutes at room temperature [24].
- Develop with Fast Red chromogen for 10-20 minutes until red color develops [24].
- Rinse with wash buffer 3 times for 10 minutes each [69].
Counterstaining and Mounting:
Protocol 2: Direct Fluorescent Detection as an Alternative
When chromogenic overlap cannot be resolved, fluorescent detection provides a superior alternative for multiplexing.
Research Reagent Solutions:
- Primary Antibodies: Species-matched or directly conjugated antibodies
- Fluorophore-conjugated Secondaries: Alexa Fluor dyes with minimal spectral overlap
- Blocking Solution: 1% BSA, 1% normal serum, 0.3% Triton X-100 in PBS [19]
- Mounting Medium: Anti-fade mounting medium with DAPI [19] [24]
Methodology:
- Sample Preparation: Follow standard deparaffinization and antigen retrieval as in Protocol 1 [19].
- Blocking: Block with serum blocking reagent for 1 hour at room temperature [19].
- Primary Antibody Incubation: Incubate with primary antibody cocktail (multiple species) overnight at 4°C [19].
- Secondary Antibody Incubation: Incubate with fluorophore-conjugated secondary antibodies (e.g., anti-rabbit Alexa Fluor 488, anti-mouse Alexa Fluor 555) for 1-2 hours at room temperature, protected from light [19].
- Counterstaining and Mounting:
Workflow Visualization
Diagram 1: Experimental planning workflow
The Scientist's Toolkit
Table 3: Essential Reagents for Resolving Chromogen Overlap
| Reagent/Category | Specific Examples | Function/Purpose |
|---|---|---|
| Chromogen Pairs | DAB (brown) + Fast Blue BB (blue) [24] | Provides high color contrast for distinct signal separation |
| Enzyme Blockers | Hydrogen Peroxide (HRP blocker), Levamisole (AP blocker) [69] | Prevents cross-reactivity between detection systems |
| Antibody Elution Solutions | Low-pH buffer (pH 2.0), Heat treatment in citrate buffer [24] | Removes bound antibodies between staining rounds |
| Species-Specific Blockers | Normal serum, Unconjugated secondary antibodies [24] | Blocks residual binding sites when using same-species primaries |
| Polymer Detection Systems | HRP-polymer, AP-polymer [24] | Non-biotin systems reduce background in problematic tissues |
| Mounting Media | Organic (for DAB), Aqueous (for AEC/Fast Red) [24] | Preserves chromogen signal without dissolving precipitate |
Chromogen overlap presents a significant limitation for multiplex chromogenic IHC, particularly when investigating co-localized targets in complex tissues [68]. The protocols and strategies outlined here enable researchers to push the boundaries of chromogenic multiplexing through careful chromogen selection, rigorous sequential staining, and appropriate controls. However, when experimental requirements exceed the practical limits of chromogenic detection (typically >2 targets), fluorescent methods offer a powerful alternative with superior multiplexing capacity and unambiguous signal discrimination [68] [7]. The choice between these detection modalities should be guided by experimental goals, equipment availability, and the need for long-term sample preservation versus multiplexing capability.
Optimizing Antigen Retrieval for Formalinfixed ParaffinEmbedded (FFPE) Tissues
The development of antigen retrieval (AR) techniques represents a pivotal milestone in immunohistochemistry (IHC), effectively dividing its timeline into pre-AR and post-AR eras [70]. For more than two decades, the simple yet revolutionary method of boiling formalin-fixed paraffin-embedded (FFPE) tissue sections in water has dramatically extended the utility of IHC in both research and diagnostic pathology [70]. The significance of this technique stems from its ability to reverse the masking effect of formalin fixation, which preserves tissue morphology but creates protein cross-linkages that obscure antigenic sites, making them inaccessible to antibodies [71] [72].
The theoretical foundation for heat-induced antigen retrieval was established through chemical studies from the 1940s demonstrating that formalin-protein cross-linkages could be disrupted by heating above 100°C or by strong alkaline treatment [70]. This counterintuitive approach—using boiling temperatures to restore rather than destroy antigenicity—has since become universally adopted in pathology and morphology-based sciences, enabling researchers and diagnosticians to unlock the vast potential of archival FFPE tissue collections for both clinical and translational research [70]. The optimization of AR protocols is particularly crucial when considering the choice between chromogenic and fluorescent detection methods, as the efficiency of epitope retrieval directly impacts signal strength, background noise, and ultimately, the reliability of experimental and diagnostic results.
Principles and Mechanisms of Antigen Retrieval
Chemical Basis of Formalin Fixation and Epitope Masking
Formalin fixation preserves tissue morphology through the formation of methylene bridges between proteins, creating cross-linkages that stabilize tissue architecture but mask antigenic epitopes [71] [72]. The process begins when formaldehyde reacts with tissue proteins to create formaldehyde adducts in the form of hydroxymethyl groups. These groups subsequently react over hours to days with other tissue proteins to form methylene bridges (protein cross-links) [72]. The specific types of cross-links depend on which amino acid side chains are involved, with lysine and cysteine being particularly susceptible [73].
Research has revealed that antibodies useful for FFPE tissues predominantly bind to linear epitopes—contiguous stretches of approximately five to seven amino acids in the native protein [72]. When an irrelevant large protein is present during formalin-induced cross-linking, immunoreactivity is completely abrogated as cross-linking the irrelevant protein to the peptide epitopes sterically blocks antibodies from bonding [72]. Antigen retrieval works by dissociating these irrelevant proteins and restoring immunoreactivity, likely through hydrolytic cleavage of formaldehyde cross-links, unfolding of epitopes, and calcium ion extraction [71].
Visualization of Antigen Retrieval Mechanism
The following diagram illustrates the molecular mechanism of formalin fixation and the subsequent antigen retrieval process:
Diagram 1: Molecular mechanism of antigen retrieval in FFPE tissues.
Antigen Retrieval Methods and Protocols
Heat-Induced Epitope Retrieval (HIER)
Heat-induced epitope retrieval is the most widely used antigen retrieval method, employing high temperatures and specific buffers to break formalin-induced cross-links [71]. The selection of appropriate HIER buffer with optimal pH and composition is crucial for maximizing antigen retrieval efficiency while minimizing tissue damage [71].
Table 1: Common Antigen Retrieval Buffer Compositions
| Buffer Type | Composition | pH | Optimal For | Storage |
|---|---|---|---|---|
| Sodium Citrate | 10 mM Sodium citrate, 0.05% Tween 20 | 6.0 | Many nuclear and cytoplasmic antigens | 3 months at room temperature or longer at 4°C |
| Tris-EDTA | 10 mM Tris base, 1 mM EDTA, 0.05% Tween 20 | 9.0 | More challenging antigens, especially membrane proteins | 3 months at room temperature or longer at 4°C |
| EDTA | 1 mM EDTA | 8.0 | Various antigens, alternative to citrate | 3 months at room temperature |
Pressure Cooker Method
The pressure cooker method provides rapid, uniform heating and is often considered the gold standard for HIER [71]. The protocol involves adding antigen retrieval buffer to the pressure cooker and bringing it to a boil while simultaneously deparaffinizing and rehydrating tissue sections. Once boiling, transfer slides to the pressure cooker and secure the lid. As soon as the cooker reaches full pressure, time for 3 minutes. After pressure release, run cold water over the cooker for 10 minutes to cool slides before proceeding with immunohistochemical staining [71].
Microwave Method
The microwave method offers a more accessible alternative, though it requires careful monitoring to prevent uneven heating and buffer evaporation [71]. After deparaffinizing and rehydrating sections, place slides in microwaveable vessel with sufficient antigen retrieval buffer. Heat in a domestic microwave at full power until the solution comes to a boil, then continue boiling for 20 minutes. For scientific microwaves, program to maintain 98°C for 20 minutes. Monitor constantly for evaporation and do not allow slides to dry out. After 20 minutes, remove the vessel and run cold tap water into it for 10 minutes to cool slides [71].
Steamer Method
The vegetable steamer method provides gentler heating at approximately 95-100°C without vigorous boiling [71]. Set up the vegetable steamer according to manufacturer instructions and preheat. Pre-heat antigen retrieval buffer to boiling in a separate flask. Put the container that will hold the rack of slides into the vegetable steamer, carefully add the hot buffer, followed by the rack of slides. Close the lid and maintain for 20 minutes. When time has elapsed, remove the vessel and run cold tap water into it for 10 minutes [71].
Enzymatic Antigen Retrieval
Enzymatic retrieval employs proteases such as proteinase K, trypsin, or pepsin to digest masking proteins and disrupt cross-links formed during fixation [71]. While effective for some antigens, enzymatic treatment carries a higher risk of tissue damage or non-specific staining compared to HIER and may damage tissue morphology, particularly with over-digestion [71]. Optimization of enzyme concentration and incubation time is essential, typically requiring empirical testing for each antigen-antibody combination.
Optimization Parameters for Antigen Retrieval
Systematic evaluation of protein extraction parameters reveals a quantitatively relevant corridor of optimal antigen retrieval that balances sufficient epitope unmasking with tissue preservation [73]. Key optimization parameters include:
Table 2: Antigen Retrieval Optimization Parameters
| Parameter | Optimization Range | Impact on Staining | Considerations |
|---|---|---|---|
| Temperature | 95-125°C | Critical for breaking cross-links | Higher temperatures improve retrieval but may damage tissue or epitopes |
| Time | 3-40 minutes | Affects completeness of retrieval | Pressure cooker requires shorter times (3 min) vs. microwave (20 min) |
| Buffer pH | 6.0-9.0 | Impacts efficiency for different antigens | Lower pH (citrate) suits many antigens; higher pH (Tris-EDTA) for challenging targets |
| Buffer Additives | Tween 20, EDTA | Reduces surface tension, chelates ions | Tween 20 minimizes section drying; EDTA helps in calcium ion extraction |
| Cooling Rate | 10-30 minutes | Allows epitope reformation | Rapid cooling may affect epitope conformation |
Integration with Detection Methods: Chromogenic vs Fluorescent
The choice between chromogenic and fluorescent detection methods significantly impacts the optimization requirements for antigen retrieval protocols. Each method presents unique advantages and limitations that must be considered during experimental design.
Chromogenic Detection
Chromogenic detection relies on enzymatic reactions (typically horseradish peroxidase or alkaline phosphatase) that convert soluble substrates into insoluble, colored precipitates at antigen sites [15] [74]. This method dominates clinical settings due to its familiarity, excellent morphological context, and permanent staining that permits long-term slide storage [74] [12]. Chromogenic detection benefits from signal amplification strategies like the avidin-biotin complex (ABC) method, which can form large complexes that greatly enhance target signal [15]. However, chromogenic methods suffer from limitations in multiplexing capabilities, as overlapping chromogen deposits can mask adjacent antigens and complicate analysis [74] [12].
Fluorescent Detection
Fluorescent detection utilizes fluorophore-conjugated antibodies or probes that emit light at specific wavelengths when excited by appropriate light sources [15] [74]. This approach enables superior multiplexing capabilities, allowing researchers to simultaneously detect multiple antigens in the same tissue section through careful selection of fluorophores with non-overlapping emission spectra [15] [12]. Fluorescent methods also provide better image quality for high-resolution microscopy, including confocal applications, and offer superior capabilities for protein co-localization studies and quantitative analysis [15]. However, fluorescent signals are prone to photobleaching over time and require more expensive imaging equipment [74].
Table 3: Comparison of Chromogenic vs. Fluorescent Detection Methods
| Characteristic | Chromogenic Detection | Fluorescent Detection |
|---|---|---|
| Sensitivity | High, especially with ABC amplification | Generally lower, but improved with tyramide signal amplification |
| Multiplexing | Limited to 2-3 targets due to color overlap | Excellent, capable of 5+ targets with spectral separation |
| Resolution | Limited by precipitate diffusion | High, suitable for subcellular localization |
| Signal Stability | Excellent (years with proper storage) | Limited (weeks to months, susceptible to photobleaching) |
| Equipment Needs | Standard brightfield microscope | Fluorescence microscope with specific filter sets |
| Quantitation | Semi-quantitative, challenging | Highly quantitative with appropriate software |
| Background | Low with optimized protocols | Autofluorescence can be problematic in some tissues |
| Cost | Relatively inexpensive | Higher due to specialized equipment and reagents |
Antigen Retrieval Considerations for Detection Method
The interaction between antigen retrieval and detection method choice is crucial for assay success. Heat-induced epitope retrieval has been shown to enhance immunofluorescence intensity while reducing autofluorescence in some applications [70]. For chromogenic detection, particularly when using signal amplification methods like ABC or LSAB, optimal antigen retrieval is essential to ensure sufficient sensitivity while minimizing background [74]. Researchers should note that tissues with high endogenous biotin (liver, kidney) or frozen sections may produce high background with chromogenic detection, making fluorescent detection a preferable alternative in these cases [74].
Advanced Applications and Future Directions
Protein Extraction for Proteomic Analysis
The principles of antigen retrieval have been successfully extended to protein extraction from FFPE tissues for proteomic analysis [70] [73]. Systematic evaluation of extraction parameters demonstrates that commercially available extraction buffers may show reduced extraction of membrane proteins and come at considerably increased costs compared to optimized laboratory formulations [73]. The optimal extraction corridor balances temperature, duration, and buffer composition to maximize protein yield while maintaining integrity for downstream analysis. This application is particularly valuable for translational research, as it enables biomarker discovery and validation using vast archives of FFPE tissues with associated clinical follow-up data [70] [73].
Integration with Molecular Diagnostics
Recent advances have demonstrated the feasibility of integrating molecular analyses with traditional IHC in FFPE tissues. For example, comprehensive workflows now enable HPV genotyping, viral load assessment, and multiple HPV genotype co-infections analysis from the same FFPE specimens used for histological evaluation [75]. This approach enhances diagnostic accuracy in triage settings by combining molecular diagnostics with conventional morphological examinations, allowing for better patient stratification and more personalized clinical management [75].
Artificial Intelligence and Digital Pathology
The optimization of antigen retrieval protocols becomes increasingly important in the context of artificial intelligence and digital pathology applications. Deep learning models for predicting clinical outcomes (such as colorectal cancer recurrence) rely on consistent, high-quality staining of FFPE tissues to extract meaningful features [76]. Variations in antigen retrieval can introduce pre-analytical variables that compromise model performance and generalizability. Standardized AR protocols are thus essential for robust computational pathology applications.
Essential Research Reagent Solutions
The following table summarizes key reagents and materials essential for implementing optimized antigen retrieval protocols:
Table 4: Essential Research Reagents for Antigen Retrieval Protocols
| Reagent/Material | Function | Application Notes |
|---|---|---|
| Sodium Citrate | Buffer component for HIER | Optimal for many nuclear antigens at pH 6.0 |
| Tris-EDTA | Buffer component for HIER | Superior for challenging antigens at pH 9.0 |
| Proteinase K | Enzymatic retrieval | Requires careful titration to preserve morphology |
| Tween 20 | Surfactant | Reduces surface tension, prevents section drying |
| EDTA | Chelating agent | Enhances retrieval by calcium ion extraction |
| Pressure Cooker | Heating device | Provides rapid, uniform heating for consistent results |
| Scientific Microwave | Heating device | Programmable temperature control for reproducibility |
| Fluorophore-conjugated Antibodies | Fluorescent detection | Enable multiplexing; require optimized AR for epitope preservation |
| HRP-conjugated Antibodies | Chromogenic detection | Compatible with signal amplification methods |
| Antifade Mounting Medium | Fluorescent slide preservation | Reduces photobleaching for long-term fluorescence retention |
Workflow Integration Diagram
The following diagram illustrates the complete workflow for FFPE tissue processing, integrating antigen retrieval with subsequent detection methods:
Diagram 2: Comprehensive workflow for antigen retrieval and detection in FFPE tissues.
Optimizing antigen retrieval for FFPE tissues remains a critical step in maximizing the utility of immunohistochemical applications in both research and diagnostic contexts. The choice between heat-induced and enzymatic retrieval methods should be guided by the specific antigen-antibody combination, while the selection of chromogenic versus fluorescent detection must align with the experimental goals, whether they prioritize morphological context or multiplexing capability. As IHC continues to evolve alongside proteomic, genomic, and digital pathology advancements, standardized and optimized antigen retrieval protocols will remain fundamental to generating reliable, reproducible, and biologically meaningful data from precious FFPE tissue resources.
Managing Background Staining and Ensuring Specificity with Proper Controls
In the context of chromogenic versus fluorescent immunohistochemistry (IHC) research, managing background staining and ensuring antibody specificity represent fundamental challenges that directly impact data reliability and interpretation. Immunohistochemistry serves as a critical technique for visualizing protein localization and abundance within tissue architecture, but its utility depends entirely on the specificity of staining and minimization of background interference [1]. The choice between chromogenic detection, which uses enzymes to generate colored precipitates, and fluorescent detection, which employs fluorophore-conjugated antibodies, introduces distinct considerations for background management and control strategies [7] [5].
Background staining, whether from non-specific antibody binding, endogenous enzymes, or tissue autofluorescence, obscures specific signal and compromises data quality. Simultaneously, without proper validation, antibodies may bind off-target epitopes, generating false-positive results that lead to erroneous conclusions [77]. This application note provides a systematic framework for identifying, troubleshooting, and preventing these issues through optimized protocols and comprehensive control strategies, specifically contextualized within the chromogenic versus fluorescent IHC paradigm.
Understanding and Classifying Background Staining
Background staining in IHC falls into distinct categories with different underlying mechanisms. Proper identification is essential for selecting appropriate corrective measures.
Chromogenic IHC Background
In chromogenic IHC, background typically manifests as a diffuse, evenly distributed coloration throughout the tissue section. Common causes include:
- High Primary Antibody Concentration: Excessive antibody leads to non-specific binding to unrelated epitopes [78].
- Insufficient Blocking: Inadequate blockage of endogenous peroxidases (if using HRP-based systems) or biotin (if using ABC systems) creates widespread signal [78].
- Hydrophobic Interactions: Antibodies interact non-specifically with tissue proteins and lipids [78].
- Over-development: Prolonged chromogen incubation generates precipitate beyond the target sites [78].
- Tissue Drying: Allowing sections to dry during processing causes irreversible non-specific antibody binding [78].
Fluorescent IHC Background
Fluorescent IHC background appears as a generalized glow or specific structures emitting signal across multiple channels. Primary sources include:
- Autofluorescence: Natural emission from certain tissue components when excited by light, with common culprits being collagen, elastin, lipofuscin in aged tissues, and certain fixative-induced fluorescence [77] [78].
- Non-specific Antibody Binding: Similar to chromogenic IHC, antibodies binding to off-target sites [77].
- Secondary Antibody Cross-Reactivity: Secondary antibodies binding non-specifically to tissue elements [77].
Table 1: Troubleshooting Guide for Background Staining in Chromogenic and Fluorescent IHC
| Problem Cause | Manifestation | Corrective Action |
|---|---|---|
| High Antibody Concentration | Diffuse background across entire tissue [78] | Titrate antibody; find optimal dilution [78] |
| Insufficient Blocking | Even background; specific structures in endogenous enzyme-rich areas [78] | Use peroxidase block (H₂O₂); avidin/biotin block; normal serum block [78] |
| Hydrophobic Interactions | Patchy, non-uniform background [78] | Add detergent (0.05% Tween-20) to buffers [78] |
| Tissue Autofluorescence | Signal in negative control/no primary; specific structures (e.g., elastic fibers) [77] [78] | Use Sudan Black B or commercial quenching agents; spectral unmixing [78] |
| Over-development | High background with potential loss of specific signal definition [78] | Monitor chromogen development microscopically; stop reaction promptly [78] |
Essential Control Systems for IHC Specificity
Implementing proper controls is non-negotiable for validating IHC results and distinguishing true signals from artifacts. The required controls differ slightly between chromogenic and fluorescent applications due to their distinct detection mechanisms.
Fundamental Controls for Both Chromogenic and Fluorescent IHC
- No Primary Antibody Control: Omit the primary antibody while including all other steps, especially secondary antibodies and detection systems. This identifies non-specific binding of detection systems or secondary antibodies [77].
- Positive Tissue Control: Tissues known to express the target protein confirm that the entire IHC protocol functions correctly. Absence of signal indicates protocol failure [77].
- Negative Tissue Control: Tissues confirmed absent of the target protein (ideally from knockout animals) identify false positives from non-specific primary antibody binding [77].
Specialized Controls
- Blocking Peptide Control (Pre-absorption Control): Pre-incubate the primary antibody with its immunizing peptide before application. This should abolish specific staining, confirming antibody specificity. Residual staining indicates off-target binding [77].
- Endogenous Background Control: For fluorescent IHC, image an unstained tissue section to map natural autofluorescence patterns, which can be digitally subtracted during analysis [77].
IHC Control Validation Workflow
Table 2: Essential IHC Controls and Their Interpretation
| Control Type | Procedure | Expected Result | Failed Result Interpretation |
|---|---|---|---|
| No Primary Control | Omit primary antibody; include all other reagents [77] | No specific staining | Secondary antibody non-specific binding; detection system issues [77] |
| Positive Tissue Control | Run protocol on tissue known to express target [77] | Strong, specific staining in expected pattern | Protocol failure; inactive reagents [77] |
| Negative Tissue Control | Run protocol on tissue known not to express target (e.g., KO) [77] | No specific staining | Primary antibody non-specificity; off-target binding [77] |
| Blocking Peptide | Pre-absorb primary antibody with immunizing peptide [77] | Significant reduction or elimination of staining | Primary antibody binding to off-target epitopes [77] |
| Autofluorescence Control | Image unstained tissue section with same settings [77] | No specific fluorescence pattern | Maps natural tissue fluorescence for subtraction [77] |
Comparative Analysis: Chromogenic vs. Fluorescent IHC
The choice between chromogenic and fluorescent detection significantly influences background characteristics, control strategies, and optimal applications.
Table 3: Chromogenic vs. Fluorescent IHC Comparison
| Parameter | Chromogenic IHC | Fluorescent IHC (Traditional) | Ultra-high-plex IF |
|---|---|---|---|
| Detection Chemistry | Enzyme-conjugated (HRP/AP) + chromogen (DAB) [5] | Fluorophore-conjugated antibodies [7] | Repeated dye cycles with color separation [7] |
| Maximum Markers/Slide | 1-2 (standard), 3-5 (multiplex) [7] [5] | 2-8 markers [7] | 10-60 markers [7] |
| Background Challenges | Endogenous enzymes; non-specific antibody binding [78] | Autofluorescence; non-specific binding [78] | Autofluorescence; spectral overlap [7] |
| Signal Stability | Permanent, archivable for years [7] [5] | Moderate (photobleaching risk) [7] | Moderate (software-corrected) [7] |
| Best Applications | Diagnostic workflows, pathology, archival studies [7] [5] | Co-localization studies, spatial biology [7] | Tumor microenvironment, complex cell mapping [7] |
Comprehensive Protocols for Background Reduction and Specificity Validation
Standardized IHC Protocol with Integrated Controls
This protocol provides a robust foundation for both chromogenic and fluorescent IHC, incorporating critical steps for background minimization. Steps marked with (*) are particularly crucial for reducing non-specific staining.
Day 1: Sample Preparation and Staining
- Tissue Fixation: Perfuse with 4% PFA or immerse dissected tissue (<10mm) in 4% PFA for 2-24 hours at room temperature [1]. Avoid over-fixation to prevent epitope masking [78].
- Sectioning: Cut 4-5μm sections for chromogenic IHC or 5-7μm for fluorescent IHC [7]. Mount on adhesive slides. Prevent section drying at all stages [78].
- Deparaffinization and Rehydration: For FFPE sections, standard xylene and ethanol series.
- Antigen Retrieval: Use heat-induced epitope retrieval (HIER). Test both citrate buffer (pH 6.0) and Tris-EDTA (pH 9.0) to determine optimal conditions for your target [78].
- Blocking (Critical Step):
- Peroxidase Block: Incubate with 3% H₂O₂ for 10 minutes (Chromogenic IHC with HRP only) [78].
- Protein Block: Incubate with 2-5% normal serum from the secondary antibody species for 30-60 minutes [1].
- Biotin Block: If using biotin-streptavidin detection, use commercial avidin/biotin blocking kit [78].
- Primary Antibody Incubation:
Day 2: Detection and Visualization
- Washing: Wash 3x with PBS containing 0.05% Tween-20 (PBST) [78] [8].
- Secondary Antibody/Detection System:
- For fluorescent IHC: Incubate with fluorophore-conjugated secondary antibody (e.g., 1:1000 dilution) for 2 hours at room temperature, protected from light [8].
- For chromogenic IHC: Incubate with enzyme-conjugated secondary antibody or polymer system, followed by chromogen (e.g., DAB) development. Monitor development under microscope and stop reaction promptly [78].
- Counterstaining and Mounting:
Specialized Protocol: Autofluorescence Quenching for Fluorescent IHC
For tissues with high intrinsic autofluorescence (e.g., spleen, kidney, aged tissues), add this step after blocking and before primary antibody incubation:
- Prepare 0.1-1.0% Sudan Black B in 70% ethanol. Filter before use.
- Incubate sections for 10-15 minutes at room temperature.
- Rinse thoroughly with PBST before proceeding to primary antibody incubation [78].
Protocol: Blocking Peptide Control Validation
- Reconstitute the immunizing peptide according to manufacturer instructions.
- Pre-incubate the primary antibody at working concentration with a 5-10 fold molar excess of the blocking peptide.
- Incubate for 2-4 hours at room temperature or overnight at 4°C with gentle agitation.
- Centrifuge briefly to pellet any precipitate.
- Use this pre-absorbed antibody solution on a test section in parallel with the standard primary antibody [77].
Optimized IHC Workflow Diagram
The Scientist's Toolkit: Essential Research Reagent Solutions
Table 4: Essential Reagents for Background Management and Specificity Validation
| Reagent / Solution | Function / Purpose | Application Notes |
|---|---|---|
| Normal Serum | Blocks non-specific binding sites; matches secondary antibody host species [78] | Use at 2-5% in diluent buffer; critical for reducing hydrophobic interactions |
| Tween-20 | Mild detergent added to wash buffers and antibody diluents [78] | Reduces hydrophobic interactions; typically used at 0.05% concentration |
| Hydrogen Peroxide | Blocks endogenous peroxidase activity in chromogenic IHC [78] | Use 3% solution for 10 minutes before primary antibody incubation |
| Avidin/Biotin Blocking Kit | Blocks endogenous biotin in tissues [78] | Essential when using biotin-streptavidin detection systems |
| Sudan Black B | Quenches lipofuscin and general tissue autofluorescence [78] | Particularly effective for aged tissues; use before primary antibody |
| Blocking Peptide | Validates primary antibody specificity through pre-absorption [77] | 5-10 fold molar excess to antibody; should abolish specific staining |
| BSA (Bovine Serum Albumin) | Inert protein carrier in antibody diluents; reduces non-specific binding [8] | Typically used at 0.5-1% in PBST; provides additional blocking |
| Commercial Autofluorescence Quenchers | Specifically designed to reduce tissue autofluorescence | Often more standardized than laboratory-prepared solutions |
Effective management of background staining and implementation of proper controls are indispensable for generating reliable, interpretable IHC data in both chromogenic and fluorescent applications. The strategies outlined herein provide a systematic framework for troubleshooting common issues, validating antibody specificity, and selecting appropriate detection methodologies based on research goals. By integrating these controls and optimization steps into standard protocols, researchers can significantly enhance the quality and reproducibility of their IHC data, ultimately strengthening the conclusions drawn from their experimental findings.
Head-to-Head Comparison: Data-Driven Decision Making
Within immunohistochemistry (IHC), the choice between chromogenic and fluorescent detection methods fundamentally influences experimental outcomes, particularly in quantitative and multiplexing applications. This analysis provides a detailed comparison of these core techniques, focusing on the critical parameters of sensitivity, specificity, and dynamic range. The recent development of targeted therapies, such as antibody-drug conjugates (ADCs) that require precise quantification of low-abundance biomarkers, has exposed significant limitations in traditional chromogenic IHC [79] [80]. This article frames the comparison within the context of modern drug development, where accurate protein measurement on histopathology slides is increasingly crucial for patient selection and therapeutic efficacy.
Technical Comparison of Detection Methods
The core differences between chromogenic and fluorescent detection stem from their underlying signal generation principles. Chromogenic detection relies on enzymes like Horseradish Peroxidase (HRP) or Alkaline Phosphatase (AP) converting soluble substrates (e.g., DAB, AEC) into insoluble, colored precipitates at the antigen site [11] [5]. These stains are viewed with standard brightfield microscopes, provide excellent tissue morphology, and are highly stable, allowing for long-term slide storage [7] [5]. In contrast, fluorescent detection utilizes fluorophore-conjugated antibodies that emit light of a specific wavelength when excited by light of a shorter wavelength [11] [7]. This signal is visualized using fluorescence microscopes and is superior for multiplexing and co-localization studies, though it is susceptible to photobleaching [11] [7].
Table 1: Core Characteristics of Chromogenic vs. Fluorescent Detection
| Feature | Chromogenic Detection | Fluorescent Detection |
|---|---|---|
| Detection Chemistry | Enzyme-conjugated antibody + chromogenic substrate (e.g., DAB) [11] | Fluorophore-conjugated antibody [11] |
| Signal Type | Colored precipitate [11] | Light emission at specific wavelength [11] |
| Visualization | Brightfield microscope [7] | Fluorescence microscope [7] |
| Signal Stability | High; permanent and archivable [7] [5] | Moderate; susceptible to photobleaching [11] [7] |
| Multiplexing Capacity | Low (typically 1-2 markers, up to 3-5 with difficulty) [41] [5] | High (2-8 markers routinely; up to 60 with specialized platforms) [7] [41] |
| Best For | Diagnostic workflows, archival studies, morphology assessment [7] | Spatial biology, co-localization, immune cell phenotyping [7] [5] |
Analysis of Sensitivity, Specificity, and Dynamic Range
- Sensitivity: Fluorescent detection generally offers higher sensitivity and a broader dynamic range due to the linear relationship between fluorophore excitation and signal emission, allowing for better detection of both low- and high-abundance targets on the same slide [11] [7]. Chromogenic detection has a narrower dynamic range, making simultaneous visualization of rare and abundant targets difficult [11]. Its sensitivity can be boosted using signal amplification methods like the Avidin-Biotin Complex (ABC) or Labeled Streptavidin-Biotin (LSAB) techniques [11].
- Specificity: Both methods are vulnerable to non-specific background staining, which must be controlled through careful blocking and optimized antibody concentrations [81]. Chromogenic detection can suffer from color mixing in multiplex experiments, obscuring specific signal interpretation [5]. Fluorescent detection, while capable of spectral overlap, can use software-based unmixing to maintain specificity for multiple markers [5].
- Dynamic Range: The limited dynamic range of chromogenic IHC is a critical shortcoming for modern precision medicine. The CASI-01 study demonstrated that conventional HER2 IHC assays, designed to detect high-level overexpression (3+), perform poorly in distinguishing low-expression categories (1+ or ultra-low) due to inadequate dynamic range [79] [82]. In contrast, quantitative fluorescent assays can accurately measure HER2 expression across a wide continuum, which is essential for determining patient eligibility for ADC therapies like Trastuzumab Deruxtecan [80].
Table 2: Quantitative Performance: Sensitivity, Specificity, and Dynamic Range
| Parameter | Chromogenic Detection | Fluorescent Detection |
|---|---|---|
| Sensitivity | Moderate; can be enhanced with amplification (ABC, LSAB) [11] | High; inherent high sensitivity and can be amplified with TSA [5] |
| Specificity | High for single-plex; compromised in multiplex by color mixing [5] | High; maintained in multiplex via spectral separation [5] |
| Dynamic Range | Narrow; poor for quantifying low-abundance targets [79] [11] | Wide; superior for quantitative analysis across expression levels [11] [80] |
| Quantitative Capability | Semi-quantitative at best [41] | Highly quantitative; linear signal facilitates precise measurement [41] |
Experimental Protocols for Comparative Analysis
Protocol A: Chromogenic IHC for Single-Marker Detection (FFPE Tissue)
This standard protocol is optimized for detecting a single biomarker, such as PCNA or EGFR, in formalin-fixed, paraffin-embedded (FFPE) tissue sections [83].
- Tissue Preparation: Cut FFPE tissue sections at 4µm thickness and mount on coated slides. Dry slides thoroughly on a slide warmer [81].
- Deparaffinization and Rehydration: Immerse slides in xylene, followed by a series of graded alcohols (100%, 90%, 70%) and finally distilled water [81].
- Antigen Retrieval: Perform Heat-Induced Epitope Retrieval (HIER) using citrate buffer (pH 6.0) in an autoclave or pressure cooker. Alternatively, Protease-Induced Epitope Retrieval (PIER) with enzymes like trypsin can be used [81] [83].
- Quenching and Blocking:
- Primary Antibody Incubation: Apply optimized dilution of specific primary antibody (e.g., mouse anti-human PCNA monoclonal antibody). Incubate for 1 hour at 37°C or overnight at 4°C [83].
- Secondary Antibody Incubation: Apply enzyme-conjugated secondary antibody (e.g., HRP-labeled polymer) for 30 minutes at room temperature [83].
- Chromogen Development: Apply chromogen substrate, such as 3,3'-Diaminobenzidine (DAB), to visualize antigen expression. Monitor development under a microscope [83].
- Counterstaining and Mounting: Counterstain nuclei with hematoxylin. Dehydrate through graded alcohols and xylene, then mount with a permanent mounting medium [83].
Protocol B: Multiplex Immunofluorescence (mIF) for Co-localization Studies
This protocol enables the simultaneous detection of multiple biomarkers, ideal for tumor microenvironment analysis [7] [41].
- Tissue Preparation and Antigen Retrieval: Follow steps 1-3 from Protocol A. Use slightly thicker sections (5-7µm) for IF to preserve tissue [7].
- Multiplex Blocking: Block with a protein block and, if using TSA, endogenous avidin/biotin. Block endogenous peroxidases if HRP-based tyramide signal amplification (TSA) is planned.
- Sequential Antibody Staining:
- Round 1: Incubate with first primary antibody (e.g., anti-CD8). Follow with an HRP-conjugated secondary antibody or polymer.
- Amplification (optional): Apply a fluorophore-labeled tyramide (TSA) reagent to amplify the signal [41] [5].
- Antigen Removal: Perform heat denaturation in citrate or EDTA buffer to strip antibodies from the first round without damaging the tissue or the newly deposited fluorescent tyramide signal [41].
- Round 2: Repeat steps with the second primary antibody (e.g., anti-CD68) and a fluorophore with a distinct emission spectrum.
- Additional rounds can be performed for more markers [41].
- Counterstaining and Mounting: Counterstain nuclei with DAPI. Mount with an anti-fade mounting medium to reduce photobleaching [7].
- Image Acquisition: Acquire images using a fluorescence or multispectral microscope. Use separate filter sets for each fluorophore to avoid bleed-through [41].
Diagram 1: Chromogenic IHC workflow for single-marker detection.
Diagram 2: Multiplex immunofluorescence workflow with sequential staining.
Case Study: HER2-Low Testing and the Limits of Chromogenic IHC
The challenge of accurately classifying HER2-low breast cancer provides a powerful real-world case study highlighting the limitations of chromogenic IHC's dynamic range and the advantages of quantitative fluorescent methods.
The Clinical Problem: The efficacy of Trastuzumab Deruxtecan (T-DXd) in HER2-low and HER2-ultralow breast cancer has created an urgent need for precise IHC assays. Traditional FDA-cleared HER2 IHC assays ("predicate" assays) were developed and optimized to distinguish HER2-overexpressing (3+) and amplified tumors from others. They were not designed to quantify low expression levels [79] [80]. The CASI-01 study found these predicate assays have detection thresholds ranging from 30,000 to 60,000 HER2 molecules per cell, which is adequate for identifying HER2 3+ overexpression but provides poor dynamic range for accurately scoring HER2-low (1+) cases [79] [82]. This leads to significant inter-observer variability among pathologists, with concordance rates for distinguishing IHC 0 from IHC 1+ reported as low as 26% in some studies [80].
Solution with Quantitative Fluorescent IHC: To address this, a high-sensitivity, quantitative HER2 assay (HS-HER2) was developed. This assay functions more like a ligand binding assay, measuring HER2 in absolute units of attomoles per square millimeter (amol/mm²) on histopathology slides [80]. The validation of this assay combined traditional IHC guidelines with rigorous analytical criteria from quantitative biochemistry. In a prospective test on 316 core biopsy specimens, the quantitative fluorescent assay demonstrated a wide dynamic range for HER2 expression. Crucially, it revealed that 71% of cases classified as IHC=0 by traditional methods had HER2 levels above the limit of quantification, suggesting many patients with detectable HER2 may be misclassified and potentially denied effective therapy [80].
Key Findings and Implications: The CASI-01 study concluded that enhanced analytic sensitivity of IHC assays combined with automated image analysis is required to overcome the critical gap in HER2-low testing [79] [82]. This case underscores a pivotal advancement: the importance of reporting IHC analytic sensitivity and dynamic range, and the ability of quantitative image analysis to surpass pathologist readout accuracy in specific clinical contexts [79].
The Scientist's Toolkit: Essential Reagents and Materials
Table 3: Key Research Reagent Solutions for IHC
| Item | Function | Example Use Cases |
|---|---|---|
| Primary Antibodies | Specifically bind to the target protein (antigen) of interest. | Rabbit anti-human EGFR monoclonal antibody; Mouse anti-human PCNA monoclonal antibody [83]. |
| Signal Amplification Kits (ABC/LSAB) | Increase assay sensitivity by forming large complexes with multiple enzyme molecules per primary antibody binding event [11]. | Detecting low-abundance targets in chromogenic IHC. |
| Tyramide Signal Amplification (TSA) Reagents | Provide extreme signal amplification for both chromogenic and fluorescent IHC, enabling detection of very low-expression targets [5]. | Multiplex immunofluorescence; detecting low-copy number proteins. |
| Multiplex IHC Kits | Integrated reagent systems containing optimized buffers, antibodies, and detection reagents for multiplex staining. | Celnovte's Multiplex Immunohistochemical Kit [5]. |
| Cell Line Microarray (CMA) | Serves as a calibration standard for quantitative IHC, with cell lines of known antigen concentration [80]. | Validating and calibrating quantitative assays like the HS-HER2 test. |
| Fluorophore Conjugates | Antibodies directly or indirectly conjugated to fluorescent dyes (e.g., Alexa Fluor dyes) for detection in IF. | multiplex IF for spatial phenotyping [7]. |
| Chromogenic Substrates | Enzymatic substrates that produce a colored precipitate (e.g., DAB - brown, AEC - red) [11]. | Single-plex chromogenic IHC for diagnostic pathology. |
The comparative analysis reveals that the choice between chromogenic and fluorescent detection is not merely a technical preference but a strategic decision with profound implications for data quality and clinical application. Chromogenic IHC remains a robust, accessible, and morphologically superior choice for single-plex, diagnostic applications where long-term sample archiving is required. However, its limited dynamic range and poor multiplexing capability are critical drawbacks. Fluorescent IHC, particularly in its quantitative and multiplexed forms, offers superior sensitivity, a wider dynamic range, and the ability to elucidate complex cellular relationships, making it indispensable for advanced research and the development of targeted therapies like ADCs. The evolution of IHC towards fully quantitative protein measurement on slides, as demonstrated in HER2-low testing, marks a necessary shift towards the rigor of other analytical methods in life sciences, ensuring that patient selection for novel therapeutics is driven by accurate and reproducible biology.
Within immunohistochemistry (IHC) research, the choice between chromogenic and fluorescent detection methods fundamentally dictates the required microscopy platform. This decision impacts not only the initial equipment investment but also the experimental design, multiplexing capabilities, and long-term data preservation [84] [5]. Brightfield microscopy is used for visualizing chromogenic precipitates, while fluorescence microscopy is required for detecting light emitted by fluorophores [1]. This application note details the specific equipment requirements, experimental protocols, and practical considerations for both modalities to guide researchers in selecting the appropriate technology for their IHC studies.
Core Technology Comparison
The underlying detection mechanisms of chromogenic and fluorescent IHC directly result in distinct equipment requirements. The table below summarizes the core components of each microscopy system.
Table 1: Fundamental Equipment Requirements for Brightfield and Fluorescence Microscopy
| Microscopy Component | Brightfield Microscopy | Fluorescence Microscopy |
|---|---|---|
| Detection Principle | Visualizes colored precipitates from enzyme-substrate reactions (e.g., DAB) under white light [84] [85]. | Detects light emitted by fluorophores when excited by a specific wavelength of light [84] [1]. |
| Light Source | Standard halogen or LED white light source [5]. | High-intensity light source such as mercury or xenon arc lamps, or LEDs [5]. |
| Filter Sets | Not required for basic imaging. | Essential excitation/emission filters and a dichroic mirror to separate light paths [5]. |
| Objective Lens | Standard achromat or plan-apochromat objectives. | Often require high-numerical aperture (NA) objectives for optimal light collection [86]. |
| Detector/Camera | Color CCD or CMOS camera. | High-sensitivity monochrome CCD or sCMOS camera; often cooled to reduce noise [5]. |
| Multiplexing Capability | Limited (typically 3-5 markers) due to chromogen spectral overlap [5]. | Superior (5-10+ markers) due to narrow emission spectra of fluorophores [84] [5]. |
Detector Pathways and Workflow Logic
The following diagram illustrates the fundamental differences in how brightfield and fluorescence microscopes generate an image, from the light source to detection.
Diagram 1: IHC Microscope Light Pathways
Detailed Experimental Protocols
Protocol for Chromogenic IHC with Brightfield Microscopy
This protocol is optimized for visualizing one or two targets using a brightfield microscope.
Research Reagent Solutions:
- Primary Antibody: Specific to the target antigen.
- Biotinylated Secondary Antibody: Species-specific, binds to the primary antibody [85].
- Avidin-Biotin Complex (ABC) Reagent: Provides signal amplification [84] [85].
- Chromogen Substrate (e.g., DAB): Enzyme substrate that yields a colored, insoluble precipitate at the antigen site [87] [85].
- Hematoxylin: A counterstain that labels cell nuclei blue [5].
Methodology:
- Deparaffinization and Antigen Retrieval: For formalin-fixed paraffin-embedded (FFPE) tissues, perform deparaffinization in xylene and rehydration through a graded alcohol series [87]. Perform heat-induced epitope retrieval using a citrate-based buffer in a microwave, steamer, or pressure cooker [87].
- Blocking and Primary Antibody Incubation: Block endogenous peroxidase activity by incubating sections with 3% H₂O₂ for 10-15 minutes [87]. Block non-specific protein binding with a serum-based or protein (e.g., BSA) block for 30 minutes [87]. Incubate with optimized primary antibody dilution for 1 hour at room temperature or overnight at 4°C in a humidity chamber [87].
- Signal Amplification and Detection: Incubate with biotinylated secondary antibody for 30-60 minutes at room temperature [85]. Prepare the ABC reagent according to the manufacturer's instructions and incubate with the tissue section for 30 minutes [85]. Apply the chromogen substrate (e.g., DAB) and monitor stain development under a microscope. Stop the reaction by immersing slides in distilled water [87].
- Counterstaining and Mounting: Counterstain with hematoxylin for 30-60 seconds to label nuclei [87]. Dehydrate sections through a graded alcohol series, clear in xylene, and mount with a permanent mounting medium [87].
- Brightfield Imaging: Image slides using a standard brightfield microscope with a white light source and a color camera. Use a 20x to 40x objective for most applications.
Protocol for Immunofluorescence (IF) with Fluorescence Microscopy
This protocol is optimized for multiplexing and requires a fluorescence microscope.
Research Reagent Solutions:
- Primary Antibodies: Raised in different host species for multiplexing.
- Fluorophore-Conjugated Secondary Antibodies: Species-specific, each conjugated to a distinct fluorophore (e.g., Alexa Fluor 488, Cy3, Alexa Fluor 647) [1] [85].
- Autofluorescence Quencher: Reagent to reduce tissue autofluorescence if present.
- Antifade Mounting Medium: Contains agents to retard photobleaching [5].
- Nuclear Counterstain (e.g., DAPI): A fluorescent stain that binds to DNA [1].
Methodology:
- Sample Preparation and Antigen Retrieval: Perform deparaffinization and antigen retrieval as described in Section 3.1. For tissues with high autofluorescence (e.g., liver, kidney), an additional incubation with an autofluorescence quenching reagent may be necessary [84] [5].
- Blocking and Primary Antibody Incubation: Block non-specific binding with a serum or protein block for 30 minutes [87]. For multiplexing, incubate with a cocktail of validated primary antibodies raised in different species for 1 hour at room temperature or overnight at 4°C [5].
- Fluorophore Conjugation: Incubate with a cocktail of fluorophore-conjugated secondary antibodies for 45-60 minutes at room temperature, protected from light. Ensure secondary antibodies are highly cross-adsorbed to prevent cross-reactivity [5] [85].
- Counterstaining and Mounting: Apply a nuclear counterstain such as DAPI for 5-10 minutes [1]. Rinse slides and mount with a commercial antifade mounting medium. Seal coverslips with nail polish to prevent evaporation.
- Fluorescence Imaging: Image slides using a fluorescence microscope equipped with appropriate filter sets for each fluorophore and DAPI. Use high-NA objectives (e.g., 40x oil immersion) for optimal signal collection. Acquire images sequentially for each channel to minimize bleed-through and use a high-sensitivity monochrome camera [5].
The Scientist's Toolkit: Essential Research Reagents
Successful IHC experimentation relies on a suite of critical reagents. The table below details key solutions and their functions.
Table 2: Essential Research Reagent Solutions for IHC
| Reagent Category | Specific Examples | Function in IHC Protocol |
|---|---|---|
| Detection Kits | Avidin-Biotin Complex (ABC) Kit [84] [85] | Amplifies chromogenic signal for sensitive detection of low-abundance targets. |
| Polymer-Based Detection Kit [85] | Provides high-sensitivity detection without endogenous biotin interference. | |
| Chromogens | 3,3'-Diaminobenzidine (DAB) [87] [85] | HRP substrate yielding a permanent brown precipitate. |
| 3-Amino-9-ethylcarbazole (AEC) [85] | HRP substrate yielding a red precipitate (requires aqueous mounting). | |
| Fluorophores | Alexa Fluor Dyes (e.g., 488, 555, 647) [85] | Bright, photostable dyes with distinct emission profiles for multiplexing. |
| Cy Dyes (e.g., Cy3, Cy5) [85] | Organic cyanine dyes commonly used for fluorescence labeling. | |
| Mounting Media | Permanent Mounting Medium (e.g., synthetic resin) [87] | For mounting chromogen-stained, dehydrated slides for permanent preservation. |
| Antifade Mounting Medium (e.g., with Mowiol or PPD) [5] | Retards photobleaching of fluorophores for fluorescence microscopy. |
The choice between brightfield and fluorescence microscopy is dictated by experimental goals. The following diagram outlines a decision-making workflow based on key research parameters.
Diagram 2: IHC Microscopy Selection Workflow
In conclusion, brightfield and fluorescence microscopy serve complementary roles in IHC research. Brightfield microscopy is the cornerstone for high-sensitivity, single-target detection in clinical and routine diagnostics, offering cost-effectiveness and permanent slide archives [5] [85]. Fluorescence microscopy is indispensable for advanced research requiring multiplexed target detection, precise co-localization studies, and quantitative analysis, despite requiring a greater initial investment and more careful sample handling [84] [5]. Aligning the research question with the technical capabilities and constraints outlined in this document will ensure the selection of the optimal microscopy platform for successful IHC outcomes.
Within the framework of chromogenic versus fluorescent detection for immunohistochemistry (IHC), the longevity of the detection signal and the capacity for long-term slide archiving are critical considerations for research and diagnostic reproducibility. The choice between chromogenic and fluorescent methods fundamentally influences how experimental results are preserved, stored, and revisited. Chromogenic detection typically yields a permanent, stable precipitate, making it the established choice for creating a physical, archivable record [88] [7]. In contrast, fluorescent signals are inherently prone to fading over time due to photobleaching when exposed to light, presenting challenges for long-term preservation [88] [1]. This application note delineates the structural bases for these differences, provides direct comparative data, and outlines optimized protocols to maximize signal preservation for each method, catering to the needs of researchers and drug development professionals.
Quantitative Comparison: Chromogenic vs. Fluorescent Signal Properties
The core characteristics of chromogenic and fluorescent detection systems that impact signal longevity and archiving feasibility are summarized in Table 1.
Table 1: Comparative Analysis of Signal Longevity and Archiving Properties
| Feature | Chromogenic Detection | Fluorescent Detection (IF) |
|---|---|---|
| Signal Nature | Insoluble, colored precipitate [88] [24] | Light emission from excited fluorophores [88] [1] |
| Primary Stability Concern | Virtually none; precipitate is stable [24] | Photobleaching (fading upon light exposure) [88] [7] |
| Signal Longevity | Permanent; slides can be stored for years [7] [24] | Moderate to Limited; signal degrades over time, even in storage [88] [7] |
| Archiving Potential | Excellent; ideal for regulatory archiving and clinical pathology [7] | Requires digital archiving; physical slides are not reliable long-term [7] |
| Mounting Medium | Organic (e.g., limonene-based) for DAB; Aqueous for AEC/Red chromogens [24] | Aqueous, anti-fade required to slow photobleaching [19] [24] |
| Microscope Requirement | Standard brightfield microscope [88] [7] | Fluorescence microscope with specific filter sets [1] [7] |
Experimental Protocols for Maximizing Signal Preservation
Protocol for Chromogenic IHC with DAB for Permanent Archiving
This protocol is optimized for horseradish peroxidase (HRP)-based detection with 3,3'-Diaminobenzidine (DAB) to produce a robust, permanent signal [19] [89] [24].
Deparaffinization and Rehydration:
Antigen Retrieval:
- Perform Heat-Induced Epitope Retrieval (HIER) by boiling slides in 10 mM Sodium Citrate Buffer (pH 6.0) or 1 mM EDTA Buffer (pH 8.0/9.0) using a microwave oven or pressure cooker for 15-20 minutes [19] [91] [92].
- Cool slides completely in the buffer for approximately 30 minutes before proceeding [19].
Immunostaining:
- Peroxidase Blocking: Incubate slides with 3% hydrogen peroxide in water or TBS for 10-15 minutes at room temperature to quench endogenous peroxidase activity [19] [91] [89].
- Blocking: Block non-specific binding with an appropriate protein-based blocking buffer (e.g., TBST/5% Normal Goat Serum) for 30-60 minutes [19] [91].
- Primary Antibody: Apply primary antibody diluted in recommended diluent overnight at 4°C in a humidity chamber [19] [91].
- Washing: Wash slides 3 times with TBST or PBST wash buffer for 5 minutes each [19] [91].
- Detection: Apply a polymer-based HRP-conjugated secondary detection reagent for 30-60 minutes at room temperature [91] [89].
- Washing: Wash slides 3 times with TBST or PBST for 5 minutes each [19] [91].
- DAB Development: Incubate with DAB substrate solution for approximately 10 minutes (or until color develops). Monitor development closely under a microscope to prevent over-staining [19] [89].
- Stop Reaction: Rinse slides in 3 changes of distilled water for 3 minutes each to stop the reaction [19].
Counterstaining and Mounting for Archiving:
- Counterstain: Apply hematoxylin for 30 seconds to several minutes to stain nuclei. Differentiate and blue according to standard protocols [19] [24].
- Dehydration: Dehydrate sections through a graded ethanol series (50%, 70%, 95%, 100%, 100%) for 10 seconds to 3 minutes each [19].
- Clearing: Clear in xylene, 2-3 changes for 3-5 minutes each [19].
- Mounting for Permanence: Mount coverslips using an organic mounting medium (e.g., limonene-based), which is non-aqueous and preserves the DAB precipitate indefinitely [24].
Protocol for Immunofluorescence (IF) with Enhanced Signal Preservation
This protocol incorporates steps to mitigate photobleaching and maximize the usable lifespan of fluorescent signals [19] [1].
Sample Preparation to Antigen Retrieval: Identical to steps 1 and 2 of the chromogenic protocol [19].
Immunofluorescence Staining:
- Blocking and Permeabilization: Block and permeabilize tissue sections with a buffer such as PBS/0.025% Triton X-100 with 5% serum for 1 hour at room temperature [19].
- Primary Antibody: Apply primary antibody diluted in blocking buffer overnight at 4°C in a humidity chamber [19].
- Washing: Wash sections 3 times with wash buffer (e.g., PBS/0.025% Triton X-100) for 10 minutes each [19].
- Secondary Antibody: Incubate with fluorophore-conjugated secondary antibody (typically diluted 1:500-1:1000) in blocking buffer for 1-2 hours at room temperature, protected from light [19].
- Washing: Wash sections 3 times with wash buffer for 10 minutes each, protected from light [19].
Counterstaining and Mounting for Fluorescence:
- Nuclear Counterstain: Incubate with a fluorescent counterstain such as DAPI (0.5 µg/mL) for 5 minutes at room temperature, protected from light [19] [24].
- Final Wash: Perform a brief 5-minute wash in wash buffer or distilled water to remove excess salts [19].
- Anti-fade Mounting: Dab away excess moisture and apply an aqueous, anti-fade mounting medium to the tissue section [19] [24]. Carefully mount a coverslip, avoiding bubbles.
- Curing and Storage: Seal the coverslip edges with clear nail polish to prevent drying and oxidization. Store finished slides at 4°C in the dark, ideally in a slide box [19].
The following workflow diagrams summarize the key procedural and decision pathways for both methods.
The Scientist's Toolkit: Essential Reagents for IHC Signal Preservation
Table 2: Key Research Reagent Solutions for Signal Longevity
| Item | Function in Protocol | Key Consideration for Signal Longevity |
|---|---|---|
| DAB Substrate Kit [91] [89] | Forms an insoluble, brown precipitate at the antigen site. | Produces a permanent, stable signal that is resistant to fading. The precipitate is soluble in organic solvents. |
| Polymer-based HRP Detection Reagent [91] | Non-biotin system for signal amplification. | Avoids background from endogenous biotin, providing a cleaner signal. More sensitive than biotin-based systems. |
| Organic Mounting Medium [24] | Seals coverslip for chromogenic slides. | Required for DAB and other organic-soluble chromogens to preserve the precipitate permanently. |
| Anti-fade Mounting Medium [19] [24] | Seals coverslip for fluorescent slides. | Contains reagents that slow photobleaching by reducing oxidation, crucial for preserving fluorescent signal. |
| Fluorophore-Conjugated Secondary Antibodies [88] [89] | Binds primary antibody for fluorescent detection. | Choice of bright, stable fluorophores (e.g., DyLight, Alexa Fluor) can improve initial signal and resistance to fading. |
| Hematoxylin [19] [24] | Nuclear counterstain for chromogenic IHC. | Provides morphological context. Forms a stable complex, making it compatible with permanent archiving. |
| DAPI [19] [24] | Nuclear counterstain for IF. | A stable DNA dye used for morphological context in fluorescence. Emits in the blue spectrum. |
Within immunohistochemistry (IHC) research, the choice between chromogenic and fluorescent detection methods fundamentally shapes the quantitative potential of an experiment. This document explores the critical distinction between the semi-quantitative analysis typically associated with chromogenic detection and the true quantitation enabled by fluorescent methods, framing this within the broader context of biomarker validation and drug development. Understanding this distinction is paramount for researchers and scientists who rely on accurate, reproducible data to make critical decisions in both basic research and clinical applications. The core of the difference lies in the nature of the signal: chromogenic IHC (CIHC) produces an enzyme-mediated colored precipitate, while fluorescent IHC (FIHC) utilizes fluorophores that emit light at specific wavelengths upon excitation [5] [1]. This fundamental difference dictates the level of quantitative rigor achievable.
Defining the Quantitative Spectrum in IHC
Semi-Quantitative Analysis with Chromogenic IHC
Chromogenic IHC is inherently semi-quantitative. The output is a colored deposit, such as 3,3’-Diaminobenzidine (DAB), which is visualized using a standard brightfield microscope [5]. The analysis of this signal often relies on:
- Pathologist Scoring: Visual assessment and scoring systems (e.g., 0, 1+, 2+, 3+) based on staining intensity and the percentage of positive cells. This is subjective and can suffer from inter-observer variability [93].
- Basic Digital Analysis: Computer-assisted image analysis can measure stain intensity and area, but the dynamic range is limited. The chromogen signal can saturate, and color separation from the counterstain (e.g., hematoxylin) can be challenging [5]. The signal is not linear over a wide range of antigen concentrations, making precise quantification difficult.
The semi-quantitative nature of CIHC stems from the enzyme-driven reaction, where the relationship between the antigen amount and the final precipitate is not perfectly linear and can be influenced by factors like incubation time and substrate availability.
True Quantitation with Fluorescent IHC
Fluorescent IHC, in contrast, is capable of true quantitation. The signal is generated by fluorophores, and the light intensity measured is directly proportional to the number of fluorophores and, by extension, the amount of target antigen [5] [94]. This allows for:
- Wide Dynamic Range: Fluorescent signals offer a broad, linear dynamic range, enabling the detection of subtle differences in protein expression levels across several orders of magnitude [5].
- Precise, Cell-Level Analysis: Signal intensity can be measured on a per-cell basis, allowing for highly accurate quantification of protein abundance within specific cellular or subcellular compartments [1].
- Multispectral Imaging: Advanced imaging can separate overlapping fluorescent signals (a process called "unmixing"), which is crucial for multiplexing and ensures that the quantitation of one marker is not confounded by the signal from another [5].
The following table summarizes the core differences in quantitative potential between the two techniques.
Table 1: Comparison of Quantitative Capabilities in Chromogenic vs. Fluorescent IHC
| Feature | Chromogenic IHC (Semi-Quantitative) | Fluorescent IHC (True Quantitation) |
|---|---|---|
| Signal Type | Enzyme-based colored precipitate [5] | Light-emitting fluorophore [5] |
| Signal Linearity | Limited, can saturate [5] | High, wide linear dynamic range [5] |
| Primary Output | Ordinal data (e.g., scoring categories) [93] | Continuous, ratio data (e.g., intensity values) [5] |
| Multiplexing Potential | Limited (3-5 markers), chromogen overlap is problematic [5] | High (5-10+ markers), signals can be separated [5] [1] |
| Best for | Routine pathology, determining presence/absence, relative abundance [5] | Research requiring exact protein levels, co-localization studies, pharmacodynamic biomarker studies [5] [94] |
Experimental Protocols for Quantitative IHC
The pursuit of quantitative data demands rigorous and standardized protocols to minimize variability. The following sections detail established methodologies for both detection approaches.
Protocol for Semi-Quantitative Chromogenic IHC
This protocol is adapted for single-plex staining with DAB on formalin-fixed, paraffin-embedded (FFPE) tissue sections, suitable for subsequent pathologist scoring or basic digital analysis [93].
Reagents:
- FFPE tissue sections (4-5 μm)
- Xylene
- Ethanol (100%, 95%, 70%)
- 10 mM Sodium Citrate buffer (pH 6.0) or 1 mM EDTA buffer (pH 8.0) for antigen retrieval
- Hydrogen Peroxide (3%) for endogenous peroxidase blocking [93]
- Protein block (e.g., 5-10% normal serum from secondary antibody species or BSA)
- Primary antibody, optimally titrated
- HRP-conjugated secondary antibody
- DAB substrate kit
- Hematoxylin counterstain
- Mounting medium
Procedure:
- Deparaffinization and Rehydration: Bake slides at 60°C, then immerse in xylene (2 x 5 min), followed by 100% ethanol (2 x 5 min), 95% ethanol (2 x 5 min), and 70% ethanol (2 x 5 min). Rinse in distilled water [93].
- Antigen Retrieval: Perform Heat-Induced Epitope Retrieval (HIER). Place slides in preheated retrieval buffer and heat in a microwave, pressure cooker, or water bath (e.g., 95-100°C for 20-30 min). Cool slides to room temperature in the buffer for 20-30 min. Rinse with Tris-buffered saline with Tween 20 (TBS-T) [93].
- Endogenous Peroxidase Blocking: Incubate slides with 3% H₂O₂ for 10-15 minutes at room temperature to quench endogenous peroxidase activity. Wash with TBS-T (3 x 5 min) [93].
- Protein Blocking: Apply enough protein block to cover the tissue section. Incubate for 30 minutes at room temperature in a humidity chamber. Tip: Do not wash after this step; simply tap off the excess block [93].
- Primary Antibody Incubation: Apply optimally diluted primary antibody to the tissue section. Incubate for 30-60 minutes at room temperature or overnight at 4°C in a humidity chamber. Wash with TBS-T (3 x 5 min) [93].
- Secondary Antibody Incubation: Apply HRP-conjugated secondary antibody. Incubate for 30-60 minutes at room temperature. Wash with TBS-T (3 x 5 min) [93].
- DAB Detection: Prepare DAB substrate according to the manufacturer's instructions. Apply to the tissue section and monitor development for 1-3 minutes. Stop the reaction by immersing the slide in distilled water [93].
- Counterstaining and Mounting: Counterstain with hematoxylin for about 1 minute. Rinse in running tap water. Dehydrate through a series of ethanols (70%, 95%, 100%) and xylene. Coverslip using a permanent mounting medium [93].
Analysis: Slides can be evaluated by a pathologist using a standardized scoring system or analyzed with digital pathology software to measure the percentage of DAB-positive area and average staining intensity.
Protocol for Quantitative Multiplex Fluorescent IHC
This protocol outlines a tyramide signal amplification (TSA)-based multiplex fluorescent IHC method, which allows for sequential staining and signal amplification, enabling the detection of multiple targets on a single slide with high sensitivity and quantitation [5].
Reagents:
- FFPE tissue sections (4-5 μm)
- Antigen retrieval buffer
- Protein block
- Primary antibodies from different host species or of different isotypes
- HRP-conjugated secondary antibodies
- Tyramide-conjugated fluorophores (e.g., Opal dyes)
- Hydrogen Peroxide
- Microwave or pressure cooker for epitope retrieval and signal stripping
Procedure:
- Deparaffinization, Rehydration, and Antigen Retrieval: Perform as described in the chromogenic protocol (Steps 1-2).
- Endogenous Peroxidase Blocking: Incubate with 3% H₂O₂ for 10 minutes. Wash.
- Protein Blocking: Apply protein block for 30 minutes.
- Primary Antibody Incubation #1: Apply the first primary antibody. Incubate and wash.
- Secondary HRP Antibody Incubation #1: Apply the corresponding HRP-conjugated secondary antibody. Incubate and wash.
- Tyramide-Fluorophore Incubation #1: Apply the tyramide-conjugated fluorophore. Incubate for 5-10 minutes. Wash.
- Antigen Retrieval (Signal Stripping): To remove the primary and secondary antibodies while leaving the deposited fluorophore intact, perform a second round of heat-induced antigen retrieval. This is a critical step for multiplexing.
- Repeat Cycle: Repeat steps 4-7 for each subsequent marker, using a different fluorophore for each round.
- Counterstaining and Mounting: After all markers are stained, counterstain with DAPI (4',6-diamidino-2-phenylindole) to label nuclei. Wash and mount with an anti-fade mounting medium.
Analysis: Image slides using a fluorescence microscope or a multispectral slide scanner. Use spectral unmixing software to separate the signals from the different fluorophores. Quantitative data is extracted by measuring the fluorescence intensity of each marker on a per-cell basis.
The Scientist's Toolkit: Essential Reagents for Quantitative IHC
Successful quantitative IHC relies on a suite of specific reagents and tools. The following table details key solutions and their functions.
Table 2: Essential Research Reagent Solutions for Quantitative IHC
| Reagent / Solution | Function in Quantitative IHC |
|---|---|
| Tyramide Signal Amplification (TSA) Kits | Enzyme-mediated signal amplification system that significantly boosts sensitivity, crucial for detecting low-abundance targets in both chromogenic and fluorescent mIHC [5]. |
| Multiplex IHC Kits | Commercial kits providing optimized buffers, antibodies, and protocols for sequential staining and signal stripping, essential for robust and reproducible multiplexed experiments [5]. |
| Primary Antibodies (Validated for IHC) | High-specificity antibodies are the foundation of any IHC experiment. Validation for the specific application (CIHC or FIHC) and species is critical for quantitative accuracy [93]. |
| HRP/AP Conjugated Secondary Antibodies | Enzymes (Horseradish Peroxidase or Alkaline Phosphatase) conjugated to antibodies to catalyze the chromogenic reaction or activate the tyramide signal in TSA [5] [1]. |
| Fluorophore-Conjugated Antibodies / Opal Dyes | Fluorophores used for direct detection or in TSA systems. They must be selected to avoid spectral overlap and matched to the microscope's filter sets [5]. |
| Antigen Retrieval Buffers | Solutions (e.g., citrate or EDTA) used to break protein cross-links formed during formalin fixation, thereby "unmasking" epitopes for antibody binding, a crucial step for reproducibility [93]. |
| Anti-fade Mounting Medium | Preserves fluorescence by reducing photobleaching, essential for maintaining signal integrity during imaging and for long-term storage of fluorescent slides [5] [94]. |
Workflow and Data Analysis Diagrams
The logical and experimental workflows for quantitative IHC are complex. The following diagrams, generated with DOT language, illustrate the key pathways and decision points.
Quantitative IHC Selection Workflow
This diagram outlines the decision-making process for choosing between semi-quantitative and quantitative IHC approaches based on experimental goals.
Multiplex Fluorescent IHC with TSA Workflow
This diagram details the sequential, cyclical process of multiplex fluorescent IHC using tyramide signal amplification, which is the cornerstone of quantitative, multi-marker analysis.
Application in Drug Development and Biomarker Research
The quantitative data generated by fluorescent IHC is invaluable in drug development. It enables:
- Pharmacodynamic Biomarker Assessment: Precisely measuring changes in target protein expression or phosphorylation in tumor biopsies before and after treatment with a targeted therapeutic [95].
- Immuno-oncology and Tumor Microenvironment (TME) Mapping: Multiplex fluorescent IHC is the gold standard for characterizing the complex spatial relationships between immune cells (e.g., CD8+ T cells, TFH cells, B cells) and tumor cells. This true quantitation of cell densities and distances is critical for understanding mechanisms of action and predicting response to immunotherapies [5].
- Biomarker Discovery and Validation: The ability to accurately quantitate multiple biomarkers simultaneously on a single tissue section preserves precious samples and provides rich, co-registered datasets for validating novel biomarkers [95].
While chromogenic IHC remains a robust and accessible tool for determining the presence or absence of a biomarker in a clinical pathology setting, the push towards personalized medicine and complex biomarker signatures is increasingly driving the adoption of quantitative fluorescent IHC methods in both research and drug development.
Within the broader context of chromogenic versus fluorescent immunohistochemistry (IHC) research, selecting an appropriate detection method necessitates a thorough analysis of practical laboratory considerations. This application note provides a detailed cost-benefit examination of equipment, reagents, and workflow efficiency to guide researchers, scientists, and drug development professionals in making evidence-based decisions. The choice between chromogenic and fluorescent detection significantly impacts experimental design, operational budgeting, and staffing requirements, extending beyond mere technical performance to encompass total project lifecycle management. This document synthesizes current data and protocols to deliver a structured framework for evaluating these dominant IHC methodologies, emphasizing quantitative comparisons and practical implementation pathways that align with specific research objectives and resource constraints.
Quantitative Cost and Performance Analysis
The economic and operational profiles of chromogenic and fluorescent IHC differ substantially across key parameters. The following tables summarize core quantitative data for direct comparison.
Table 1: Equipment and Operational Cost Analysis
| Parameter | Chromogenic IHC | Fluorescent IHC (Standard) | Ultra-High-Plex IF (10-60 plex) |
|---|---|---|---|
| Core Detection Chemistry | Enzyme-based (HRP/AP) with chromogenic substrates (DAB, AEC) [96] [34] | Fluorophore-conjugated antibodies [96] [97] | Repeated dye cycles with color separation software [7] |
| Essential Imaging Equipment | Brightfield microscope [7] | Fluorescence microscope [7] [97] | Advanced scanner + AI analytics [7] |
| Equipment Cost | Lower upfront cost [7] | Moderate to High [7] | High [7] |
| Reagent Cost | Generally lower [7] | Higher [7] | Highest [7] |
| Typical Turnaround Time | 3–5 days [7] | 5–7 days [7] | 7–10 days [7] |
Table 2: Performance and Workflow Characteristics
| Characteristic | Chromogenic IHC | Fluorescent IHC |
|---|---|---|
| Maximum Markers/Slide | 1–2 (Routine); 3–5 (Multiplex, with overlap challenges) [7] [5] | 2–8 (Standard); 10–60 (Ultra-high-plex platforms) [7] [5] |
| Signal Stability | Permanent, archivable for years [96] [7] | Moderate; prone to photobleaching, requires careful storage [96] [7] [97] |
| Sensitivity / Dynamic Range | Moderate [7] | High to Very High [7] |
| Best Application | Diagnostic workflows, regulatory archiving, crisp morphology assessment [7] | Spatial biology, co-localization, tumor microenvironment analysis [96] [7] |
| Data Analysis | Basic quantification; color intensity not linearly quantitative [5] | Highly exact quantification; wide dynamic range for cell-level analysis [7] [5] |
Detailed Cost and Workflow Breakdown
Equipment Investment and Maintenance
The foundational cost divergence begins with imaging equipment. Chromogenic IHC relies on standard brightfield microscopy, a ubiquitous and lower-cost technology in most pathology and research laboratories [7]. In contrast, fluorescent IHC requires specialized fluorescence microscopes or slide scanners equipped with specific light sources and emission filters, representing a significant capital investment [7] [5]. Ultra-high-plex platforms (e.g., Akoya PhenoCycler-Fusion) further escalate costs, requiring advanced scanners and integrated AI analytics software [7]. These systems also incur higher maintenance costs and require more specialized technical expertise for operation and calibration.
Reagent and Consumable Costs
Reagent expenses present a complex cost-benefit picture. While chromogenic IHC reagents like horseradish peroxidase (HRP) and chromogens (e.g., DAB, AEC) are generally more affordable, fluorescent IHC reagents—particularly high-quality fluorophores and signal amplification systems like tyramide signal amplification (TSA)—are more costly [7] [5]. However, a critical consideration for multiplexing studies is the cost per marker. When analyzing multiple targets, fluorescent IHC's ability to detect several markers on a single slide can lead to a lower cost per data point compared to chromogenic IHC, which often requires consecutive slides for multiple markers, consuming more tissue and reagents [7].
Workflow Efficiency and Personnel Time
Workflow efficiency encompasses the entire process from sample preparation to data analysis. Chromogenic IHC benefits from simpler, more established workflows compatible with routine clinical pathology schedules, yielding results typically within 3–5 days [7]. Stained slides are permanent and can be archived for years, facilitating long-term studies and clinical audits [96] [7]. Fluorescent IHC workflows are often more complex and longer (5–7 days), requiring careful optimization to minimize photobleaching and autofluorescence [7] [97]. Although the initial staining procedure might be comparable in time, the imaging and data analysis phases for fluorescent IHC, especially multiplexed experiments, are more time-intensive and require specialized analytical skills [98].
Decision Framework and Experimental Protocols
Selecting the optimal method requires a structured decision-making process based on project-specific goals and constraints.
Diagram 1: A strategic workflow for choosing between chromogenic and fluorescent IHC methods based on project requirements and available resources.
Protocol: Chromogenic IHC for Paraffin-Embedded Tissue Sections
The following optimized protocol is adapted for paraffin-embedded tissue sections, a standard in clinical and research settings [34] [99].
Day 1: Deparaffinization, Rehydration, and Antigen Retrieval
- Deparaffinization & Rehydration:
- Antigen Retrieval (Heat-Induced Epitope Retrieval - HIER):
- Perform Heat-Induced Epitope Retrieval (HIER) to break protein cross-links formed during fixation [99]. Place slides in a suitable buffer (e.g., citrate buffer pH 6.0 or EDTA buffer pH 8.0) and heat using a microwave oven, water bath, or pressure cooker. The specific buffer and heating method must be optimized for the primary antibody [99].
- Cool slides to room temperature in the buffer, then rinse with Wash Buffer [99].
Day 1: Blocking and Primary Antibody Incubation
- Blocking:
- Quench endogenous peroxidase activity by incubating with peroxidase blocking reagent (e.g., 3% H₂O₂) for 5-15 minutes [34].
- Rinse with Wash Buffer.
- To reduce non-specific background, apply a serum blocking reagent (e.g., normal serum from the species of the secondary antibody) for 15 minutes. Do not rinse after this step [34].
- For systems using biotin-streptavidin: Sequentially block endogenous biotin by incubating with avidin blocking reagent for 15 minutes, rinse, then incubate with biotin blocking reagent for 15 minutes, followed by a rinse [34].
- Primary Antibody Incubation:
- Apply the optimized dilution of primary antibody in Incubation Buffer.
- Incubate overnight at 2-8 °C for optimal specific binding and reduced background [34].
Day 2: Detection and Counterstaining
- Detection (Labeled Streptavidin-Biotin - LSAB Method):
- Rinse slides with Wash Buffer, then wash 3 times for 5 minutes each.
- Apply biotinylated secondary antibody for 30-60 minutes [34].
- Rinse and wash 3 times for 15 minutes each in Wash Buffer.
- Incubate with High Sensitivity Streptavidin-HRP conjugate (HSS-HRP) for 30 minutes [34].
- Rinse and wash 3 times for 2 minutes each in Wash Buffer.
- Chromogen Reaction:
- Apply Chromogen Solution (e.g., DAB or AEC) and incubate for 3-20 minutes, monitoring stain intensity under a light microscope [34].
- Stop the reaction by rinsing thoroughly with Wash Buffer and then deionized water.
- Counterstaining and Mounting:
- Optional: Counterstain with hematoxylin to visualize tissue morphology [34].
- For DAB (alcohol-soluble): Dehydrate through a graded ethanol series, clear in xylene, and mount with a permanent mounting medium [34].
- For AEC (alcohol-soluble): Aqueous mounting medium must be used [34].
- Visualize staining under a brightfield microscope [34].
Protocol: Standard Immunofluorescence (IF) for Paraffin-Embedded Tissue Sections
This protocol outlines the key steps for indirect immunofluorescence, a common and sensitive method [97].
Day 1: Sample Preparation and Primary Antibody Incubation
- Deparaffinization, Rehydration, and Antigen Retrieval:
- Blocking and Permeabilization:
- Blocking: Incubate the section with a protein blocking solution (e.g., Bovine Serum Albumin - BSA) or normal serum to prevent non-specific antibody binding [97].
- Permeabilization (if required): For intracellular targets, include a detergent (e.g., Triton X-100) in the blocking buffer to permeabilize cell membranes [97].
- Primary Antibody Incubation:
- Apply the primary antibody diluted in an appropriate buffer.
- Incubate overnight at 2-8 °C [97].
Day 2: Secondary Antibody Incubation and Mounting
- Secondary Antibody Incubation:
- Rinse the sample with Wash Buffer and perform several washes.
- Incubate with fluorophore-conjugated secondary antibody, specific to the host species of the primary antibody. Protect slides from light from this step onward [97].
- Rinse and wash thoroughly to reduce background.
- Counterstaining and Mounting:
Diagram 2: A comparative workflow for chromogenic (green) and fluorescent (blue) IHC protocols, highlighting shared initial steps and key divergences in detection, mounting, and imaging.
The Scientist's Toolkit: Essential Reagent Solutions
Successful execution of IHC experiments relies on a suite of critical reagents and materials. The following table details key components, their functions, and selection criteria.
Table 3: Essential Research Reagents and Materials for IHC
| Item | Function in Protocol | Key Considerations & Variants |
|---|---|---|
| Fixatives (e.g., Formalin, PFA) | Preserves tissue morphology and immobilizes antigens by forming protein cross-links [97] [99]. | Cross-linking fixatives (aldehydes) are most common; fixation time must be optimized to avoid over-fixing [99]. |
| Antigen Retrieval Buffers (e.g., Citrate, EDTA) | Reverses formaldehyde-induced cross-links, unmasking epitopes for antibody binding [97] [99]. | Buffer pH (e.g., pH 6.0 vs. pH 8.0) is critical and must be matched to the primary antibody [99]. |
| Blocking Reagents (e.g., BSA, Normal Serum) | Reduces non-specific binding of antibodies to reactive sites in the tissue, minimizing background [97] [34]. | Protein solutions (BSA) or normal serum from the secondary antibody species are commonly used [97]. |
| Primary Antibodies | Specifically bind to the target protein (antigen) of interest [99]. | Must be validated for IHC; species host is critical for selecting the correct secondary antibody [97]. |
| Detection Systems | Visualizes the primary antibody binding. | Chromogenic: Enzymes (HRP/AP) with substrates (DAB-brown, AEC-red) [96] [34]. Fluorescent: Fluorophores (e.g., FITC, TRITC) with defined excitation/emission spectra [97]. |
| Mounting Media | Preserves the stain and provides the correct refractive index for microscopy. | Chromogenic: Permanent, organic-solvent compatible media [34]. Fluorescent: Aqueous, antifade media to retard photobleaching [97]. |
The decision between chromogenic and fluorescent IHC detection is multifaceted, with no universally superior option. Chromogenic IHC presents a compelling case for single- or dual-plex assays in diagnostic and morphology-focused contexts, offering lower equipment costs, permanent slides, and simpler integration into established workflows. Conversely, fluorescent IHC is unequivocally more powerful for multiplexing and quantitative spatial analysis, despite its higher initial investment and greater operational complexity. The most cost-effective and scientifically rigorous approach depends entirely on the experimental goals: researchers should opt for chromogenic IHC when archival stability and morphological clarity are paramount, and invest in fluorescent IHC when the research question demands the elucidation of complex protein co-expression and cellular interactions within the tissue microenvironment.
Conclusion
The choice between chromogenic and fluorescent IHC is not a matter of superiority but of strategic alignment with research objectives. Chromogenic IHC remains the cornerstone for clinical diagnostics and single-target studies where permanence, cost-effectiveness, and compatibility with brightfield microscopy are paramount. In contrast, fluorescent IHC is indispensable for advanced research requiring multiplexing, precise co-localization, and quantitative analysis, despite its needs for specialized equipment and careful signal preservation. Future directions point towards increased integration of both methods, refinement of multiplex panels for immuno-oncology, and the development of more stable fluorophores and automated analysis algorithms. By understanding their distinct advantages and limitations, researchers can fully leverage the power of IHC to unlock complex biological mechanisms and accelerate therapeutic development.
References
- 1. Immunohistochemistry (IHC): The Complete Guide [https://www.antibodies.com/applications/immunohistochemistry]
- 2. Immunohistochemistry - Wikipedia [https://en.wikipedia.org/wiki/Immunohistochemistry]
- 3. Immunohistochemistry (IHC) [https://www.cellsignal.com/learn-and-support/overview-of-ihc?srsltid=AfmBOor8S_n8_P5tzo6SSzioloAovQCda5nL74pS4OvWKE4a1G_WYhUX]
- 4. Fluorescent vs. Chromogenic Detection in ... [https://www.biossusa.com/blogs/news/fluorescent-vs-chromogenic-detection-ihc?srsltid=AfmBOopdaZ8PHxkjg-JN-u35Q_MlsEyGlRK-Z0o6gqjZwsw4vxyjdJ20]
- 5. Chromogenic vs. Fluorescent Techniques [https://www.celnovte.com/solution/multiplex-immunohistochemistry-chromogenic-vs-fluorescent-techniques/]
- 6. Society for Immunotherapy of Cancer - PubMed Central - NIH [https://pmc.ncbi.nlm.nih.gov/articles/PMC11749220/]
- 7. IHC vs IF: Key Differences, Use Cases & Which to Choose [https://www.ihisto.io/post/ihc-vs-if-comparison]
- 8. Immunohistochemistry (Histology + Imaging)-Mendelsohn ... [https://www.protocols.io/view/immunohistochemistry-histology-imaging-mendelsohn-dyuq7wvw.html]
- 9. Pitfalls and Caveats in Applying Chromogenic ... [https://pmc.ncbi.nlm.nih.gov/articles/PMC8232789/]
- 10. Chromogenic IHC and ISH Resources [https://diagnostics.roche.com/us/en/products/product-category/immunohistochemistry--ihc-/chromogenic-resources.html]
- 11. IHC detection systems: Advantages and Disadvantages [https://www.bio-techne.com/applications/imaging/immunohistochemistry/ihc-detection]
- 12. Choosing Detection Techniques for IHC/ISH: Fluorescence ... [https://www.leicabiosystems.com/us/educational-resources/webinars/selecting-the-right-detection-for-your-ihcish-project-fluorescence/]
- 13. Multiplex chromogenic immunohistochemistry to stain and ... [https://pmc.ncbi.nlm.nih.gov/articles/PMC9720345/]
- 14. Understanding Success Criterion 1.4.11: Non-text Contrast [https://www.w3.org/WAI/WCAG22/Understanding/non-text-contrast.html]
- 15. Immunofluorescence Method for IHC Detection [https://www.thermofisher.com/us/en/home/life-science/protein-biology/protein-biology-learning-center/protein-biology-resource-library/pierce-protein-methods/immunofluorescence-method-ihc-detection.html]
- 16. Fluorescent vs. Chromogenic Detection in ... [https://www.biossusa.com/blogs/news/fluorescent-vs-chromogenic-detection-ihc?srsltid=AfmBOoqMsKT9feRPknEqEHbFuhc0kJxlhyuiH--G_afMCjGOksCzwrRe]
- 17. Fluorescence Excitation and Emission Fundamentals [https://evidentscientific.com/en/microscope-resource/knowledge-hub/lightandcolor/fluoroexcitation]
- 18. Quantum yield [https://en.wikipedia.org/wiki/Quantum_yield]
- 19. Immunohistochemistry Protocols [https://www.antibodies.com/applications/immunohistochemistry/ihc-protocol]
- 20. IHC Sample Visualization [https://www.ptglab.com/support/immunohistochemistry-protocol/ihc-sample-visualization/?srsltid=AfmBOoqylOaG4_8ZUgme7CMXwxS5zwx8V6amkqHdJcF01Z2fUfIKD_r5]
- 21. Detection Assays for Proteins: Chromogenic vs ... [https://www.goldbio.com/blogs/articles/proten-detection-chromogenic-chemiluminescent-fluorometric?srsltid=AfmBOopZI0VySoE4Q6N0aueNHvOAd7Vv6Xongr_Ap1wZ3F2FlcHB9Jpv]
- 22. Review of immunohistochemistry techniques: Applications, ... [https://www.sciencedirect.com/science/article/abs/pii/S0740257024000467?utm_source=chatgpt.com]
- 23. Types Of Immunoassay - And When To Use Them [https://www.quanterix.com/immunoassay-technologies-past-present-and-future/]
- 24. Detection and amplification systems [https://www.abcam.com/en-us/technical-resources/guides/ihc-guide/detection-and-amplification-systems]
- 25. How to choose chromogen colors for multiplex [https://www.leicabiosystems.com/articles/ls-articles/tips-tricks-to-multiplexing-how-to-choose-chromogen-colors-for-multiplex-and/]
- 26. Comparison of two polymer-based immunohistochemical ... [https://pubmed.ncbi.nlm.nih.gov/17204059/]
- 27. Immunohistochemistry (IHC) [https://www.cellsignal.com/learn-and-support/overview-of-ihc?srsltid=AfmBOopChwL7GKLe5EPkbQogLx8C8X5iXK6gZCdKCG_yoQTbhKg1HoWg]
- 28. Fluorescent vs. Chromogenic Detection in ... [https://www.biossusa.com/blogs/news/fluorescent-vs-chromogenic-detection-ihc?srsltid=AfmBOorDGMoZIPo_2TscNYVEptEB7pR5Lu3-OfofAAZ937SA_igaKdFL]
- 29. Spatial analysis by current multiplexed imaging ... [https://www.nature.com/articles/s41416-024-02882-6]
- 30. Comparison of Gold Nanoparticle and Fluorophore ... [https://pmc.ncbi.nlm.nih.gov/articles/PMC12187710/]
- 31. Immunohistochemistry Protocols [https://www.thermofisher.com/de/en/home/life-science/cell-analysis/cellular-imaging/ihc/immunohistochemistry-protocols.html]
- 32. Immunohistochemistry (IHC) protocol [https://hellobio.com/immunohistochemistry-ihc-protocol/]
- 33. Fluorescent vs. Chromogenic Detection in Immunohistochemistry – Bioss [https://www.biossusa.com/blogs/news/fluorescent-vs-chromogenic-detection-ihc]
- 34. Chromogenic IHC Staining Protocol of Paraffin-embedded ... [https://www.rndsystems.com/resources/protocols/protocol-preparation-and-chromogenic-ihc-staining-paraffin-embedded-tissue]
- 35. IHC or IF: Which is Best for My Study? [https://www.stagebio.com/blog/ihc-or-if-which-is-best-for-my-study]
- 36. Sequential Chromogenic IHC: Spatial Analysis of Lymph ... [https://pmc.ncbi.nlm.nih.gov/articles/PMC10361537/]
- 37. Chromogenic Immunohistochemistry Staining of Frozen ... [https://www.bio-techne.com/resources/protocols-troubleshooting/chromogenic-ihc-staining-of-frozen-tissue-protocol]
- 38. Overview of multiplex immunohistochemistry ... [https://pmc.ncbi.nlm.nih.gov/articles/PMC7170662/]
- 39. Fluorescent Multiplex Immunohistochemistry Coupled With ... [https://www.frontiersin.org/journals/molecular-biosciences/articles/10.3389/fmolb.2021.673042/full]
- 40. Fluorescent vs. Chromogenic Detection in ... [https://www.biossusa.com/blogs/news/fluorescent-vs-chromogenic-detection-ihc?srsltid=AfmBOoqN_QDHdLcg0RIDDnfmrbPUmoZvModRATGP08dQShmkK0b7s61P]
- 41. Multiplexing Techniques for IHC and IF | CST Blog [https://blog.cellsignal.com/pros-and-cons-of-different-multiplexing-techniques]
- 42. IHC-IF Protocol - Multiplex [https://www.atlasantibodies.com/knowledge-hub/protocols-for-antibody-applications/ihc-if-protocol-multiplex/]
- 43. Multiplex immunohistochemistry (mIHC): A technical deep ... [https://www.abcam.com/en-us/knowledge-center/immunohistochemistry/multiplex-immunohistochemistry-mihc]
- 44. Multiplex Immunofluorescence and Multispectral Imaging [https://www.frontiersin.org/journals/molecular-biosciences/articles/10.3389/fmolb.2021.674747/full]
- 45. Immunohistochemistry (IHC) [https://www.cellsignal.com/learn-and-support/overview-of-ihc?srsltid=AfmBOoo-KTI2XKAHrenRQnq52fS4ShrHP_1uL0YWOrM4iKXZwfoZfJR-]
- 46. Fluorescent vs. Chromogenic Detection in ... [https://www.biossusa.com/blogs/news/fluorescent-vs-chromogenic-detection-ihc?srsltid=AfmBOopxGQEE6s3MZyu2wZooS8eov18q3XHBFiu-FYIgXDHYfDhLUnww]
- 47. Introduction to ELISA, Formats and Signal Amplification [https://www.jacksonimmuno.com/secondary-antibody-resource/immuno-techniques/elisa-guide-part-1/]
- 48. Protocol for tyramide signal amplification ... [https://www.sciencedirect.com/science/article/pii/S2666166724006841]
- 49. mIHC with Tyramide Signal Amplification Protocol [https://www.cellsignal.com/learn-and-support/protocols/protocol-fluorescent-multplex-ihc?srsltid=AfmBOopmQoYNaU4VYsPGVQMeMzjrBplruIEgwp1ke-9Ln3I58a1OGjVK]
- 50. IHC Protocol [https://www.bostonbioproducts.com/resources/ihc-protocol/]
- 51. Optimization of a thermochemical antibody stripping ... [https://pubmed.ncbi.nlm.nih.gov/40426261/]
- 52. FFPE vs. Fresh Frozen Tissue: Which is Better? [https://superiorbiodx.com/blog/ffpe-vs-frozen-tissue/]
- 53. FFPE vs Frozen Tissue Samples [https://www.biochain.com/blog/ffpe-vs-frozen-tissue-samples/]
- 54. IHC-Frozen protocols [https://www.abcam.com/en-us/technical-resources/protocols/ihc-with-frozen-samples]
- 55. IHC-P protocols [https://www.abcam.com/en-us/technical-resources/protocols/ihc-with-samples-in-paraffin]
- 56. Immunohistochemical Staining of Formalin-Fixed Paraffin- ... [https://www.thermofisher.com/us/en/home/references/protocols/cell-and-tissue-analysis/protocols/ihc-staining-formalin-fixed-paraffin-embedded-tissues.html]
- 57. IHC: Staining Protocol - Fresh Frozen [https://www.sysy.com/protocols/protocol-ihc-fresh-frozen]
- 58. Fluorescent vs. Chromogenic Detection in ... [https://www.biossusa.com/blogs/news/fluorescent-vs-chromogenic-detection-ihc?srsltid=AfmBOor6Nhqof2IZljqNS2keULsTaZdhrtEyonYDxhsVKW_LBNm0hwE6]
- 59. Autofluorescence [https://www.jacksonimmuno.com/secondary-antibody-resource/immuno-techniques/autofluorescence/]
- 60. IHC Troubleshooting Guide [https://www.thermofisher.com/us/en/home/life-science/protein-biology/protein-biology-learning-center/protein-biology-resource-library/pierce-protein-methods/ihc-troubleshooting-guide.html]
- 61. Multiplexed IHC Staining with Primary Antibodies ... [https://www.thermofisher.com/us/en/home/references/protocols/cell-and-tissue-analysis/protocols/multiplex-ihc-primary-antibodies.html]
- 62. A robust method for autofluorescence-free ... [https://www.nature.com/articles/s41598-025-89142-6]
- 63. Immunohistochemistry (IHC) [https://www.cellsignal.com/learn-and-support/overview-of-ihc?srsltid=AfmBOooMn1a_Pp8wRSb26v-qUz-kDgMybMrxlDUUW2Pm0qmwQ32y1z9Z]
- 64. Fluorescent vs. Chromogenic Detection in ... [https://www.biossusa.com/blogs/news/fluorescent-vs-chromogenic-detection-ihc?srsltid=AfmBOoo7bfHh66asEuIL-qjbEXJXyyXADLhO7IIaXLnJXklHlwuwpy8d]
- 65. Fluorescent vs. Chromogenic Detection in ... [https://www.biossusa.com/blogs/news/fluorescent-vs-chromogenic-detection-ihc?srsltid=AfmBOore_-NarZw-e6xvLianiMuVxkMylwWXZoNXm0DgBO28QUN484x9]
- 66. Photobleaching alters the morphometric analysis of ... [https://pmc.ncbi.nlm.nih.gov/articles/PMC12006003/]
- 67. Quantitative investigation of photobleaching-based ... [https://pmc.ncbi.nlm.nih.gov/articles/PMC11828445/]
- 68. Fluorescent vs. Chromogenic Detection in ... [https://www.biossusa.com/blogs/news/fluorescent-vs-chromogenic-detection-ihc?srsltid=AfmBOook5TaHKeffQlq6xK5-oMtpSpImZFsvVUD59_cv-2KP4YozlghA]
- 69. Protocol for the Preparation and Chromogenic IHC ... [https://www.rndsystems.com/resources/protocols/protocol-preparation-and-chromogenic-ihc-staining-frozen-tissue-sections]
- 70. Antigen Retrieval Immunohistochemistry [https://pmc.ncbi.nlm.nih.gov/articles/PMC3201121/]
- 71. IHC antigen retrieval protocol [https://www.abcam.com/en-us/technical-resources/protocols/ihc-antigen-retrieval]
- 72. Molecular mechanisms of antigen retrieval - PubMed Central [https://pmc.ncbi.nlm.nih.gov/articles/PMC4676902/]
- 73. Systematic evaluation and optimization of protein extraction ... [https://clinicalproteomicsjournal.biomedcentral.com/articles/10.1186/s12014-022-09346-0]
- 74. Fluorescent vs. Chromogenic Detection in ... [https://www.biossusa.com/blogs/news/fluorescent-vs-chromogenic-detection-ihc?srsltid=AfmBOooUwh4ZR5LMXx88oVkLSYL-9Ub1lKZuclPGmKUSHk3tkxf4mN6H]
- 75. Integrating Molecular Diagnostics into Cervical Cancer ... [https://pmc.ncbi.nlm.nih.gov/articles/PMC12469120/]
- 76. Deep learning-enabled multiphoton microscopy predicts ... [https://www.nature.com/articles/s41746-025-02058-3]
- 77. 4 controls for immunohistochemistry (IHC) you need to use [https://www.alomone.com/4-controls-for-immunohistochemistry-ihc-you-need-to-use?srsltid=AfmBOopsRV9BczTN7mvuKnC_ME4l2f4UdxRhXDsfW3cvJ4eaIeDhGVO0]
- 78. Ultimate IHC Troubleshooting Guide: Fix Weak Staining & ... [https://www.atlasantibodies.com/knowledge-hub/blog/the-ultimate-ihc-troubleshooting-guide-from-weak-staining-to-high-background/]
- 79. New standards in HER2-low testing: the CASI-01 ... [https://pubmed.ncbi.nlm.nih.gov/40945049/]
- 80. Validation and Prospective Testing of a High Sensitivity ... [https://www.medrxiv.org/content/10.1101/2025.05.06.25327097v1.full-text]
- 81. Immunohistochemistry (IHC) Workflow [https://www.rockland.com/resources/immunohistochemistry-workflow/?srsltid=AfmBOoojuO8t4PAcAvw8uSsZaetTHjXY5QoBcIGJyxwCPPpyGcSRgpjZ]
- 82. Articles New standards in HER2-low testing: the CASI-01 ... [https://www.sciencedirect.com/science/article/pii/S2352396425003639]
- 83. Quantitative immunohistochemistry (IHC) analysis of ... [https://pmc.ncbi.nlm.nih.gov/articles/PMC8339853/]
- 84. Fluorescent vs. Chromogenic Detection in ... [https://www.biossusa.com/blogs/news/fluorescent-vs-chromogenic-detection-ihc?srsltid=AfmBOorv_aYiNFGYPApEYiyTQl_Ozb_C-CyT7fC8wBUSzMaNCUCJMAZ_]
- 85. IHC Detection Systems: Advantages and Disadvantages [https://www.novusbio.com/ihc-detection?srsltid=AfmBOoobx6qhj-A-ZU2puAya6TMX7zDCl8rJdw-ECQqIYilQqdBMy0Tg]
- 86. A comprehensive review of high-performance photoacoustic ... [https://pmc.ncbi.nlm.nih.gov/articles/PMC12173134/]
- 87. Immunohistochemistry Protocols [https://anilocus.com/immunohistochemistry-protocols-optimization/?srsltid=AfmBOoo4WEsx9-MYH5kGor0XXhqz94yj69NuwEVS_WkUhSCkHbPf4spV]
- 88. Fluorescent vs. Chromogenic Detection in ... [https://www.biossusa.com/blogs/news/fluorescent-vs-chromogenic-detection-ihc?srsltid=AfmBOorL6Q-zkBdq1i9HyzlY9anhdBVIg6tUIbnFtza9v1nloWvcYXhC]
- 89. IHC Immunodetection (Staining) [https://www.thermofisher.com/us/en/home/life-science/protein-biology/protein-biology-learning-center/protein-biology-resource-library/pierce-protein-methods/ihc-immunodetection.html]
- 90. Comparison of Chromogenic In Situ Hybridisation with ... [https://pmc.ncbi.nlm.nih.gov/articles/PMC2447915/]
- 91. Immunohistochemistry (IHC) Troubleshooting Guide & the ... [https://www.cellsignal.com/learn-and-support/troubleshooting/ihc-troubleshooting-guide?srsltid=AfmBOoqT2oO3xeCAGeW10xDzMAC2HcJzqHIU9RWhGm1C3Nd9Yke-WxWV]
- 92. Immunohistochemistry (IHC) [https://www.cellsignal.com/learn-and-support/overview-of-ihc?srsltid=AfmBOoq11xz4cDK7pwqzaaeAVYOb5cyUdjgNKO3P5kWGH2n3ENWfDvGE]
- 93. Immunohistochemistry for Pathologists: Protocols, Pitfalls, ... [https://pmc.ncbi.nlm.nih.gov/articles/PMC5122731/]
- 94. Fluorescent vs. Chromogenic Detection in ... [https://www.biossusa.com/blogs/news/fluorescent-vs-chromogenic-detection-ihc?srsltid=AfmBOoohuZOq3xqOyRdU4jOLYo6xnDFe4JnZXiMBdNJisVqjbD1mLhzH]
- 95. H&E to IHC virtual staining methods in breast cancer [https://www.nature.com/articles/s41746-025-01741-9]
- 96. Fluorescent vs. Chromogenic Detection in ... [https://www.biossusa.com/blogs/news/fluorescent-vs-chromogenic-detection-ihc?srsltid=AfmBOor4sgb9k1kFbFgi8pmtxfA2VSVAJrGDOHSzjToSwtT5ZTlIQOz5]
- 97. An introduction to Performing Immunofluorescence Staining [https://pmc.ncbi.nlm.nih.gov/articles/PMC6918834/]
- 98. Comparison of fluorescence in situ hybridization and ... [https://pubmed.ncbi.nlm.nih.gov/10561247/]
- 99. Immunohistochemistry (IHC) [https://www.cellsignal.com/learn-and-support/overview-of-ihc?srsltid=AfmBOooJFM5BFNERXOJeLPDhheu9hmOXYjYYRdKIv121s372bvvVSh4V]