ELISA Techniques Explained: Direct, Indirect, Sandwich & Competitive Assays for Biomedical Research
This comprehensive guide provides researchers, scientists, and drug development professionals with an in-depth overview of Enzyme-Linked Immunosorbent Assay (ELISA) methodologies.
ELISA Techniques Explained: Direct, Indirect, Sandwich & Competitive Assays for Biomedical Research
Abstract
This comprehensive guide provides researchers, scientists, and drug development professionals with an in-depth overview of Enzyme-Linked Immunosorbent Assay (ELISA) methodologies. Covering foundational principles, the article details the step-by-step protocols, applications, and key differences between direct, indirect, sandwich, and competitive ELISA formats. It further addresses common troubleshooting strategies, optimization techniques for sensitivity and specificity, and validation protocols essential for robust assay development. By comparing the strengths and limitations of each format, this resource enables informed selection and implementation of ELISA techniques to advance biomarker discovery, diagnostic development, and therapeutic monitoring.
What is ELISA? Core Principles, History, and Fundamental Formats Explained
The Enzyme-Linked Immunosorbent Assay (ELISA) is a cornerstone quantitative analytical technique in immunology, diagnostics, and pharmaceutical research. It leverages the high specificity of antibody-antigen interactions and couples them to an enzymatic reaction for signal amplification and detection. Within the broader thesis of ELISA method overview—covering direct, indirect, sandwich, and competitive formats—this whitepaper dissects the fundamental principle that unifies them all: the biochemical linkage of molecular recognition to enzyme-mediated colorimetric, chemiluminescent, or fluorescent readouts. This principle underpins applications from biomarker quantification to therapeutic antibody screening and vaccine development.
Core Principle: The Antigen-Antibody-Enzyme Bridge
The ELISA principle rests on creating a stable, non-covalent complex where an antigen is "captured" by a specific antibody. A secondary component, typically an enzyme-conjugated antibody or streptavidin, is then linked to this complex. Upon addition of a substrate, the enzyme catalyzes a reaction yielding a measurable signal proportional to the target analyte concentration.
Key Molecular Interactions
- Specific Binding: High-affinity interaction (Kd in nM-pM range) between the antibody's paratope and the antigen's epitope.
- Non-Covalent Forces: Hydrogen bonds, ionic interactions, van der Waals forces, and hydrophobic effects stabilize the complex.
- Enzyme Conjugation: Enzymes like Horseradish Peroxidase (HRP) or Alkaline Phosphatase (ALP) are covalently linked to detection antibodies via glutaraldehyde or periodate oxidation methods.
Quantitative Data: ELISA Performance Metrics
Table 1 summarizes standard performance parameters for modern ELISA, derived from current reagent manufacturer specifications and research publications.
Table 1: Standard ELISA Performance Metrics & Detection Limits
| Parameter | Typical Range / Value | Key Influencing Factors |
|---|---|---|
| Dynamic Range | 3-4 log(_{10}) units | Antibody affinity, enzyme-substrate kinetics, detection method. |
| Limit of Detection (LOD) | 1-10 pg/mL (high-sensitivity) | Background noise, non-specific binding, signal amplification. |
| Assay Time | 3-8 hours (standard); < 90 min (rapid kits) | Incubation times, number of washing steps, kinetics of binding. |
| Intra-assay Precision (CV) | < 10% | Pipetting accuracy, plate uniformity, reagent consistency. |
| Inter-assay Precision (CV) | < 15% | Day-to-day operator and environmental variability. |
| Common Substrate Sensitivity | Colorimetric: ~ng/mL; Chemiluminescent: ~pg/mL | Molar absorptivity (colorimetric) or photon yield (chemiluminescent). |
Detailed Experimental Protocol: Indirect ELISA
The following protocol exemplifies the core principle applied for detecting specific antibodies in serum, relevant for autoimmune disease or infection serology.
Title: Protocol for Indirect ELISA to Detect Serum Antibodies
Objective: To quantify antigen-specific IgG antibodies present in test serum samples.
Materials: See "The Scientist's Toolkit" below.
Procedure:
- Coating: Dilute the purified antigen in coating buffer (e.g., 0.05 M carbonate-bicarbonate, pH 9.6) to 1-10 µg/mL. Add 100 µL per well to a 96-well microplate. Seal and incubate overnight at 4°C.
- Blocking: Aspirate coating solution. Wash plate 3x with 300 µL PBS-T (PBS + 0.05% Tween-20) per well using a plate washer or manual manifold. Add 200 µL blocking buffer (e.g., 5% non-fat dry milk or 1% BSA in PBS-T) per well. Incubate for 1-2 hours at room temperature (RT). Wash 3x with PBS-T.
- Primary Antibody Incubation: Prepare serial dilutions of test serum and controls in sample diluent/blocking buffer. Add 100 µL of each dilution to designated wells. Incubate for 1-2 hours at RT. Wash 3-5x with PBS-T.
- Secondary Antibody Incubation: Dilute enzyme-conjugated anti-species IgG antibody (e.g., HRP-anti-human IgG) in blocking buffer per manufacturer's instructions. Add 100 µL per well. Incubate for 1 hour at RT, protected from light. Wash 3-5x with PBS-T.
- Detection: Prepare enzyme substrate immediately before use (e.g., TMB for HRP). Add 100 µL substrate solution per well. Incubate for 5-30 minutes at RT, monitoring color development.
- Stop & Read: Add 50-100 µL stop solution (e.g., 1M H(2)SO(4) for TMB) to each well. Measure absorbance immediately at the appropriate wavelength (e.g., 450 nm for TMB) using a microplate reader.
- Data Analysis: Plot mean absorbance for standards/controls vs. concentration or dilution factor. Use a 4- or 5-parameter logistic curve fit to generate a standard curve. Interpolate unknown sample values from the curve.
Visualizing the Principle & Formats
Below are Graphviz diagrams illustrating the core ELISA principle and its major implementations.
Title: Core ELISA Workflow: 5 Essential Steps
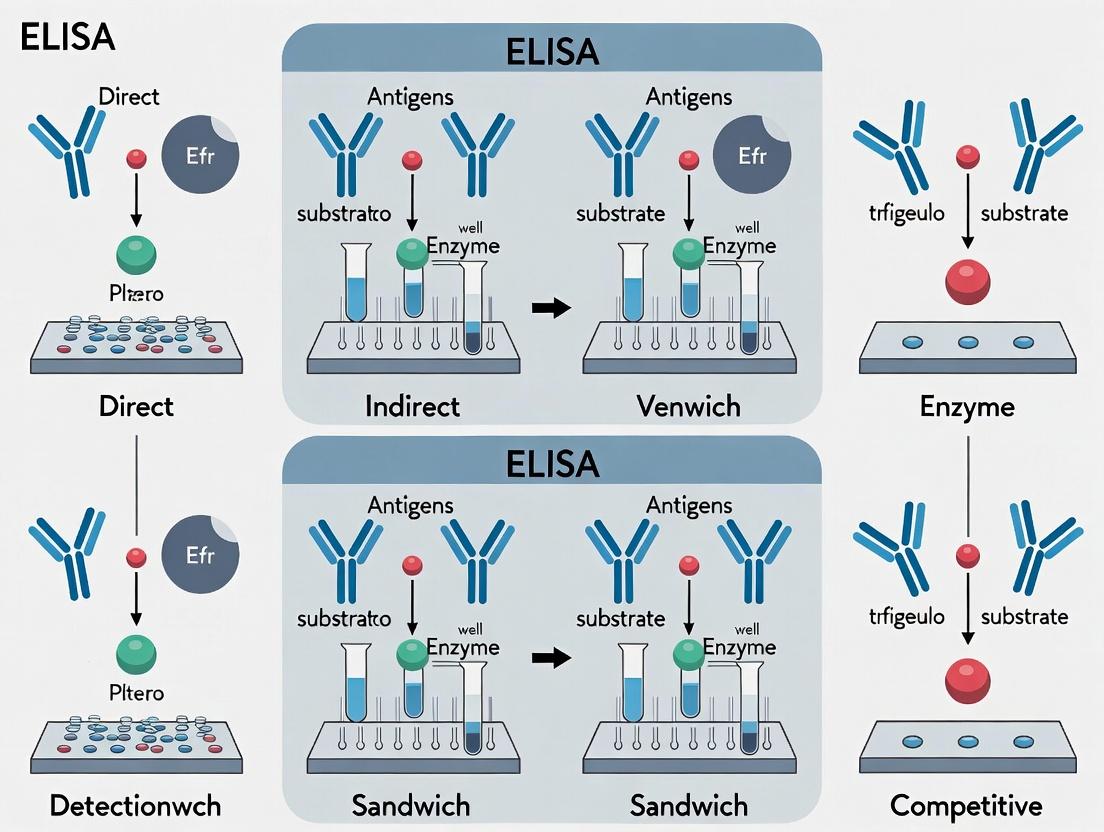
Title: Four Main ELISA Formats: Direct, Indirect, Sandwich, Competitive
The Scientist's Toolkit: Key Reagent Solutions
Table 2: Essential Reagents and Materials for ELISA
| Item | Function & Critical Specification |
|---|---|
| Microplate | Solid-phase support. High-binding polystyrene for passive adsorption of proteins/peptides. |
| Coating Buffer | Optimizes antigen/antibody adsorption to plate. Typically carbonate-bicarbonate buffer (pH 9.6). |
| Blocking Buffer | Saturates remaining binding sites to minimize non-specific background. Common agents: BSA, casein, non-fat dry milk. |
| Wash Buffer | Removes unbound reagents. PBS or Tris-based with detergent (e.g., 0.05% Tween 20). |
| Detection Antibody | Enzyme-conjugated antibody for signal generation. Must have high specificity and low cross-reactivity. |
| Enzyme Substrate | Converted by enzyme to colored/chromogenic, fluorescent, or luminescent product. Choice depends on sensitivity needs (e.g., TMB, OPD, PNPP). |
| Stop Solution | Halts enzymatic reaction for stable endpoint measurement (e.g., acidic stop for TMB). |
| Plate Reader | Spectrophotometer, fluorometer, or luminometer for quantifying signal in each well. |
| Reference Standards | Known concentrations of analyte for constructing the standard curve; critical for quantification. |
A Brief History of ELISA Development and Its Impact on Immunoassays
The Enzyme-Linked Immunosorbent Assay (ELISA) represents a cornerstone technology in immunoassay development. Framed within a broader thesis on ELISA method overview—encompassing direct, indirect, sandwich, and competitive formats—this whitepaper details the historical evolution, technical principles, and profound impact of ELISA on biomedical research and drug development. Its development democratized sensitive, quantitative protein detection, fundamentally altering diagnostic and research workflows.
Historical Development Timeline
The inception of ELISA is credited independently to Engvall and Perlmann and to Van Weemen and Schuurs in 1971. They conjugated enzymes to antibodies, creating a stable, detectable signal. This innovation evolved from earlier radioimmunoassays (RIA), replacing hazardous radioactive labels with safer enzymatic detection. Subsequent decades saw refinement in formats, substrates, and instrumentation, leading to automation and high-throughput screening essential for modern drug discovery.
Core ELISA Methodologies: Protocols and Applications
The core principle involves immobilizing an antigen or antibody on a solid phase (typically a polystyrene microplate), followed by sequential incubations with specific binding partners and enzyme-conjugated detection antibodies. A chromogenic, fluorogenic, or chemiluminescent substrate reaction yields a quantifiable signal.
Direct ELISA Protocol
- Procedure: Coat microplate with antigen sample. Block remaining sites. Add enzyme-conjugated primary antibody specific to the antigen. Wash. Add substrate and measure signal.
- Application: Rapid, one-step detection of high-abundance antigens (e.g., screening antibody production).
Indirect ELISA Protocol
- Procedure: Coat plate with antigen. Block. Add unlabeled primary antibody. Wash. Add enzyme-conjugated secondary antibody directed against the host species of the primary antibody. Wash. Add substrate and measure.
- Application: Enhanced sensitivity and flexibility; widely used for serological detection of antibodies (e.g., HIV, Lyme disease).
Sandwich ELISA Protocol
- Procedure: Coat plate with a capture antibody specific to the target antigen. Block. Add sample containing antigen. Wash. Add a second, enzyme-conjugated detection antibody specific to a different epitope on the antigen. Wash. Add substrate.
- Application: Highly specific and sensitive quantification of complex sample antigens (e.g., cytokines, biomarkers). Requires two non-competing antibodies.
Competitive ELISA Protocol
- Procedure: Two common variants exist. In one, plate-bound antigen competes with sample antigen for binding to a limited amount of enzyme-conjugated antibody. In the other, sample antigen competes with a reference enzyme-conjugated antigen for binding to limited plate-bound antibody. After washing, the signal is inversely proportional to the sample antigen concentration.
- Application: Ideal for detecting small molecules (haptens) or antigens present in low abundance or with only one available epitope (e.g., hormones like insulin, drugs of abuse).
Table 1: Comparison of Key ELISA Formats
| Format | Sensitivity | Specificity | Complexity | Typical Application |
|---|---|---|---|---|
| Direct | Moderate | Moderate | Low | Antigen screening, simple immunoassays |
| Indirect | High | High | Medium | Serology, antibody detection |
| Sandwich | Very High | Very High | High | Biomarker quantification, cytokine assays |
| Competitive | High (for small analytes) | High | Medium | Small molecules, haptens, hormones |
Table 2: Quantitative Performance Metrics of Modern ELISA Kits (Representative Data)
| Analyte | Assay Format | Dynamic Range | Limit of Detection (LOD) | Inter-Assay CV |
|---|---|---|---|---|
| Human IL-6 | Sandwich (Chemiluminescent) | 1.56–100 pg/mL | 0.5 pg/mL | <10% |
| Mouse IgG | Indirect (Colorimetric) | 7.8–500 ng/mL | 3.1 ng/mL | <12% |
| Insulin (Human) | Competitive (Colorimetric) | 1.56–100 µIU/mL | 0.75 µIU/mL | <15% |
Impact on Immunoassay Technology
ELISA's impact is monumental. It provided the foundational architecture for automated, high-throughput immunoanalyzers used in clinical laboratories. It spurred the development of multiplexed bead-based assays (Luminex) and lateral flow tests (rapid diagnostics). The principles of antibody-antigen interaction and enzymatic signal amplification directly inform modern techniques like immunohistochemistry, western blotting, and even emerging digital ELISA platforms that approach single-molecule sensitivity.
Visualizations
General ELISA Protocol Workflow
Sandwich ELISA Schematic
ELISA Technology Evolution Tree
The Scientist's Toolkit: Key Research Reagent Solutions
Table 3: Essential Reagents and Materials for ELISA
| Item | Function & Description |
|---|---|
| Polystyrene Microplates | Solid phase for immobilization; high-binding plates are treated for optimal protein adsorption. |
| Coating Buffer (Carbonate-Bicarbonate, pH 9.6) | Provides optimal pH for passive adsorption of proteins (antibodies/antigens) to the plate. |
| Blocking Buffer (BSA, Casein, or Specialty Blockers) | Saturates unbound sites on the plate to prevent non-specific adsorption of detection reagents. |
| Wash Buffer (PBS/Tween-20) | Removes unbound materials; Tween-20 (a detergent) reduces non-specific background. |
| Detection Antibodies (HRP or AP Conjugated) | Enzyme-linked antibodies (primary or secondary) that provide signal amplification. Horseradish Peroxidase (HRP) and Alkaline Phosphatase (AP) are most common. |
| Chromogenic Substrates (TMB, OPD, pNPP) | Enzymatic conversion produces a colored product. TMB (3,3',5,5'-Tetramethylbenzidine) is most popular for HRP, yielding a blue color read at 450nm. |
| Stop Solution (e.g., Sulfuric Acid for TMB) | Terminates the enzymatic reaction and stabilizes the final color for measurement. |
| Microplate Reader (Spectrophotometer) | Instrument to measure the absorbance, fluorescence, or luminescence of each well. |
The Enzyme-Linked Immunosorbent Assay (ELISA) is a foundational immunoassay technique for detecting and quantifying target analytes—such as proteins, hormones, antibodies, or peptides—in complex biological matrices. This whitepaper provides an in-depth technical guide to the four principal ELISA formats, framed within a broader thesis that these methodologies form the cornerstone of quantitative and qualitative analysis in biomedical research, clinical diagnostics, and therapeutic drug development. The strategic selection of format (Direct, Indirect, Sandwich, or Competitive) is dictated by the analyte's molecular characteristics, available reagents, required sensitivity and specificity, and the experimental context. Understanding their distinct mechanisms, advantages, and limitations is critical for assay design and data interpretation in drug development pipelines.
All ELISA formats share common principles: the immobilization of an immunoreactive component, specific antigen-antibody binding, enzymatic amplification of a signal, and colorimetric (or other) detection. The key differentiating factor is the sequence and configuration of these binding events.
Table 1: Core Characteristics of the Four Main ELISA Types
| Feature | Direct ELISA | Indirect ELISA | Sandwich ELISA | Competitive ELISA |
|---|---|---|---|---|
| Primary Ab Conjugation | Enzyme-Labeled | Unlabeled | Unlabeled (Capture) | Enzyme-Labeled (for antigen) or Unlabeled (for antibody) |
| Secondary Ab Used | No | Yes, Enzyme-Labeled | Yes, Enzyme-Labeled (Detection) | Typically No |
| Antigen Immobilization | Directly to plate | Directly to plate | Via Capture Antibody | Directly to plate or via a competitor |
| Typical Target | Antigen | Antigen, especially for antibody detection | Antigen (must be multivalent) | Small Antigens (Haptens), Competitive Drugs |
| Key Advantage | Fast, minimal cross-reactivity | Signal amplification, flexibility | High specificity, sensitivity | Best for small analytes, robust matrix effects |
| Key Disadvantage | Lower sensitivity, labeling required | Potential for cross-reactivity | Requires two epitopes, more optimization | Inverse signal relationship |
| Common Applications | Screening monoclonal antibodies, antigen detection | Serology, antibody titer determination | Cytokine quantification, biomarker detection | Hormone assays, therapeutic drug monitoring |
Table 2: Quantitative Performance Comparison (Typical Ranges)
| Parameter | Direct ELISA | Indirect ELISA | Sandwich ELISA | Competitive ELISA |
|---|---|---|---|---|
| Time to Complete | ~2-3 hours | ~3-4 hours | ~4-5 hours | ~2-3 hours |
| Typical Sensitivity (LOD) | Moderate (ng/mL) | High (pg/mL - ng/mL) | Very High (pg/mL) | High (pg/mL - ng/mL) |
| Sample Volume Required | 50-100 µL | 50-100 µL | 50-100 µL | 50-100 µL |
| Cost per Sample | Low | Low-Moderate | Moderate-High | Low-Moderate |
| Signal-to-Noise Ratio | Lower | Higher | Highest | Lower (inverse) |
Detailed Methodologies and Experimental Protocols
Direct ELISA Protocol
Principle: The antigen is immobilized and detected directly by an enzyme-conjugated primary antibody.
- Coating: Dilute purified antigen in carbonate/bicarbonate coating buffer (pH 9.6) to 1-10 µg/mL. Add 100 µL per well to a 96-well microplate. Incubate overnight at 4°C or 1-2 hours at 37°C.
- Washing: Wash plate 3x with PBS or Tris-buffered saline containing 0.05% Tween 20 (Wash Buffer).
- Blocking: Add 200-300 µL of blocking buffer (e.g., 1-5% BSA or casein in PBS) per well. Incubate 1-2 hours at 37°C or overnight at 4°C. Wash 3x.
- Primary Antibody Incubation: Add 100 µL of enzyme-conjugated (e.g., HRP, AP) primary antibody diluted in blocking buffer. Incubate 1-2 hours at room temperature (RT). Wash 3-5x thoroughly.
- Detection: Add 100 µL of substrate solution (e.g., TMB for HRP, pNPP for AP). Incubate for 10-30 minutes at RT in the dark.
- Stop & Read: Add 50-100 µL of stop solution (e.g., 1M H₂SO₄ for TMB). Measure absorbance immediately with a plate reader.
Indirect ELISA Protocol
Principle: The antigen is immobilized, detected by an unlabeled primary antibody, which is then detected by an enzyme-conjugated secondary antibody.
- Coating & Blocking: Perform as per Direct ELISA steps 1-3.
- Primary Antibody Incubation: Add 100 µL of unlabeled primary antibody (e.g., serum, supernatant) diluted in blocking buffer. Incubate 1-2 hours at RT. Wash 3x.
- Secondary Antibody Incubation: Add 100 µL of species-specific enzyme-conjugated secondary antibody (e.g., anti-mouse IgG-HRP) diluted in blocking buffer. Incubate 1 hour at RT. Wash 3-5x thoroughly.
- Detection, Stop & Read: Perform as per Direct ELISA steps 5-6.
Sandwich ELISA Protocol
Principle: The antigen is captured by an immobilized antibody and detected by a second, enzyme-conjugated antibody targeting a different epitope.
- Capture Antibody Coating: Dilute capture antibody in coating buffer (2-10 µg/mL). Coat plate (100 µL/well) overnight at 4°C.
- Blocking: Perform as per previous protocols.
- Sample/Antigen Incubation: Add 100 µL of sample or antigen standard diluted in blocking buffer. Incubate 2 hours at RT or overnight at 4°C. Wash 3x.
- Detection Antibody Incubation: Add 100 µL of enzyme-conjugated detection antibody (specific to a different epitope) diluted in blocking buffer. Incubate 1-2 hours at RT. Wash 3-5x.
- Detection, Stop & Read: Perform as per Direct ELISA steps 5-6.
Competitive ELISA Protocol (Antigen Competition Example)
Principle: Sample antigen competes with a reference, plate-bound antigen for a limited amount of enzyme-conjugated detection antibody. Signal is inversely proportional to analyte concentration.
- Coating: Coat plate with purified antigen (or an antibody for antibody competition assays) as in step 1 of Direct ELISA.
- Blocking: Perform as per previous protocols.
- Competition/Incubation: Premix a constant, limiting concentration of enzyme-conjugated detection antibody with serially diluted samples or standards. Add 100 µL of this mixture to each coated well. Incubate 1-2 hours at RT. OR: Add sample and labeled antibody separately. Wash 3-5x.
- Detection, Stop & Read: Perform as per Direct ELISA steps 5-6. Higher sample analyte concentration yields lower signal.
Visualizations of ELISA Workflows
The Scientist's Toolkit: Key Research Reagent Solutions
Table 3: Essential Materials for ELISA Development and Execution
| Reagent/Material | Primary Function & Rationale | Key Considerations |
|---|---|---|
| High-Binding Microplates (e.g., Polystyrene) | Solid phase for protein adsorption via hydrophobic interactions. | Opt for clear, flat-bottom for colorimetric readouts. Ensure compatibility with plate reader. |
| Capture & Detection Antibody Pair (Sandwich) | For Sandwich ELISA, a matched pair binding non-overlapping epitopes on the target. | Must be validated for specificity and lack of cross-reactivity. Different host species or clonality is ideal. |
| Purified Antigen (Standard) | Serves as the quantitative standard curve for calibration and plate coating. | Must be identical to the target analyte. Lyophilized stocks ensure long-term stability. |
| Enzyme Conjugates (HRP, Alkaline Phosphatase) | Provides catalytic signal amplification. Conjugated to detection antibody. | HRP is common; avoid sodium azide in buffers as it inhibits HRP. AP offers high turnover. |
| Chromogenic Substrates (TMB, pNPP) | Enzyme substrate that yields a colored, measurable product upon cleavage. | TMB (for HRP) is sensitive and safe. Stop solution required. pNPP (for AP) yields soluble yellow product. |
| Blocking Buffers (BSA, Casein, Serum) | Blocks non-specific binding sites on the plate and reagents to reduce background noise. | Must be protein-rich and inert. Choice depends on assay; non-mammalian blockers (casein) reduce interference. |
| Wash Buffer (PBS/TBS with Tween-20) | Removes unbound reagents in each step. Tween-20 (a detergent) reduces non-specific binding. | Critical for low background. Typical concentration is 0.05% Tween-20. |
| Plate Washer & Spectrophotometric Plate Reader | Automation for consistent washing and accurate absorbance measurement at specific wavelengths (e.g., 450nm for TMB). | Essential for reproducibility and high-throughput screening in drug development. |
Within the framework of ELISA (Enzyme-Linked Immunosorbent Assay) method overview—encompassing direct, indirect, sandwich, and competitive formats—the precise function and quality of core components dictate assay success. This whitepaper provides an in-depth technical guide to these foundational elements, detailing their roles, selection criteria, and integration into robust experimental protocols for researchers and drug development professionals.
Core Components: Function and Specification
Microplates
The solid-phase support, typically a 96-well polystyrene plate, facilitates high-throughput processing. Surface chemistry is critical for effective protein binding.
Table 1: Microplate Surface Properties and Applications
| Surface Type | Binding Mechanism | Optimal For | Typical Binding Capacity (IgG) |
|---|---|---|---|
| High-Bind Polystyrene | Hydrophobic & ionic interactions | Most antigens/antibodies | 300-600 ng/cm² |
| Medium-Bind Polystyrene | Moderate hydrophobicity | Lipidic antigens, smaller peptides | 200-400 ng/cm² |
| COVALENT Linkage (e.g., NHS-activated) | Covalent amine bonding | Small molecules, haptens | 150-300 ng/cm² |
| Streptavidin-Coated | Biotin-streptavidin affinity | Biotinylated molecules | Varies by manufacturer |
Antigens
The target molecule immobilized or detected. Purity and stability are paramount.
Table 2: Antigen Characteristics by ELISA Type
| ELISA Format | Antigen Role | Key Purity Requirement | Common Source |
|---|---|---|---|
| Direct/Indirect | Coated on plate | >90% (low cross-reactivity) | Recombinant, purified native |
| Sandwich | Captured in solution | >95% for both capture/detection | Recombinant with distinct epitopes |
| Competitive | Coated or in solution | Highly purified standard | Synthetic peptide, purified protein |
Antibodies
Provide specificity. Critical pairs (capture/detection) for sandwich assays must recognize non-overlapping epitopes.
Table 3: Antibody Performance Metrics
| Antibody Type | Typical Clonality | Conjugate | Recommended Working Dilution* | Key Consideration |
|---|---|---|---|---|
| Capture (Sandwich) | Monoclonal | Unconjugated | 1-10 µg/mL | High affinity, low cross-reactivity |
| Detection (Direct) | Monoclonal | Enzyme-linked | 0.5-2 µg/mL | Minimal activity loss after conjugation |
| Detection (Indirect) | Polyclonal | Unconjugated | 1:5,000-1:50,000 | Species-specific secondary must not cross-react |
| Competitive | Monoclonal | Enzyme-linked or unconjugated | 0.5-5 µg/mL | High sensitivity to analyte presence |
*Dilutions must be empirically determined via checkerboard titration.
Enzymes and Substrates
Generate measurable signal. Horseradish Peroxidase (HRP) and Alkaline Phosphatase (AP) are most common.
Table 4: Common Enzyme-Substrate Systems
| Enzyme | Common Substrate | Signal Type | Wavelength (nm) | Detection Limit (Typical) | Quenching Solution |
|---|---|---|---|---|---|
| HRP | TMB (3,3',5,5'-Tetramethylbenzidine) | Colorimetric (Blue → Yellow) | 450 (read), 650 (reference) | Low pg/well | 1-2 M H₂SO₄ or HCl |
| HRP | ABTS (2,2'-Azinobis [3-ethylbenzothiazoline-6-sulfonic acid]) | Colorimetric (Green) | 405, 414 | Mid pg/well | 1% SDS |
| AP | pNPP (p-Nitrophenyl Phosphate) | Colorimetric (Yellow) | 405-415 | High pg/well | 1 M NaOH |
| HRP | Luminol + H₂O₂ + Enhancer | Chemiluminescent | N/A (luminescence) | 1-10 fg/well | None (kinetic read) |
Experimental Protocols
Protocol A: Checkerboard Titration for Antibody Optimization (Sandwich ELISA)
Purpose: To determine optimal concentrations of capture and detection antibodies. Materials: Coating buffer (0.1 M Carbonate-Bicarbonate, pH 9.6), PBS (pH 7.4), Wash buffer (PBS + 0.05% Tween-20, PBST), Blocking buffer (5% BSA or non-fat dry milk in PBST), antigen standard, antibody pairs, suitable enzyme-substrate.
Method:
- Coating: Dilute capture antibody in coating buffer across a range (e.g., 0.5, 1, 2, 5, 10 µg/mL). Add 100 µL/well to a high-bind microplate. Incubate overnight at 4°C.
- Washing: Aspirate and wash plate 3x with 300 µL PBST/well using a multichannel pipette or plate washer.
- Blocking: Add 200 µL blocking buffer/well. Incubate 1-2 hours at room temperature (RT). Wash 3x.
- Antigen Addition: Add a fixed, moderate concentration of antigen (e.g., 100 µL of 50 ng/mL in dilution buffer) to all wells. Incubate 2 hours at RT. Wash 3x.
- Detection Antibody Titration: Prepare serial dilutions of detection antibody (e.g., 0.1, 0.5, 1, 2 µg/mL). Add 100 µL/well in a grid pattern against the capture antibody concentrations. Incubate 1-2 hours at RT. Wash 5x.
- Enzyme Conjugate: If detection antibody is unconjugated, add optimally titrated enzyme-labeled secondary antibody (100 µL/well). Incubate 1 hour at RT. Wash 5x.
- Substrate Development: Add 100 µL substrate (e.g., TMB) per well. Incubate for precise time (e.g., 10-20 minutes).
- Signal Stop & Read: Add 50-100 µL stop solution. Read absorbance immediately.
- Analysis: Identify the concentration pair yielding the highest signal-to-noise (background) ratio with minimal antibody usage.
Protocol B: Competitive ELISA for Small Molecule Quantification
Purpose: To measure concentration of a small molecule (hapten) that competes with a labeled analog for antibody binding. Materials: Hapten-protein conjugate (for coating), specific anti-hapten antibody, enzyme-labeled hapten analog (conjugate), sample/standard.
Method:
- Coating: Coat microplate with 100 µL/well of hapten-carrier protein conjugate (1-10 µg/mL in coating buffer). Overnight at 4°C.
- Wash & Block: Wash 3x with PBST. Block with 200 µL/well blocking buffer for 2 hours at RT. Wash 3x.
- Competition: In separate tubes, pre-mix constant concentration of anti-hapten antibody with serial dilutions of sample/standard (competitor). Add enzyme-labeled hapten analog to each mixture. Incubate 30-60 minutes at RT.
- Addition to Plate: Transfer 100 µL of each competition mixture to coated wells. Incubate 30-60 minutes at RT. This step allows free antibody to bind to plate-coated hapten.
- Wash: Wash plate 5x thoroughly with PBST to remove unbound material.
- Substrate & Read: Add substrate (100 µL/well). Develop, stop, and read. Note: Signal is inversely proportional to analyte concentration in the sample.
Visualizations
Diagram 1: Direct vs Indirect ELISA Workflow
Diagram 2: Sandwich ELISA Workflow
Diagram 3: Competitive ELISA Principle (Signal Inversely Proportional)
The Scientist's Toolkit: Essential Research Reagent Solutions
Table 5: Key Reagents and Materials for ELISA Development
| Item | Function & Key Specification | Example Product/Supplier* |
|---|---|---|
| High-Binding 96-Well Microplate | Optimal protein adsorption with minimal lot-to-lot variation. | Corning Costar 9018, Nunc MaxiSorp, Greiner Bio-One high-bind. |
| Recombinant Antigen Standard | Provides a pure, quantifiable standard for calibration curves. | R&D Systems, Sino Biological, PeproTech. |
| Matched Antibody Pair (Capture/Detection) | Ensures specific, sensitive sandwich assay with no cross-interference. | Pairs from Thermo Fisher (Invitrogen), Abcam, Mabtech. |
| HRP-Conjugated Secondary Antibody | For indirect/detection amplification. Low cross-reactivity. | Jackson ImmunoResearch, Cell Signaling Technology. |
| TMB (3,3',5,5'-Tetramethylbenzidine) Substrate | Sensitive, low-background HRP substrate for colorimetric readout. | Thermo Fisher SuperSignal, SeraCare KPL TMB. |
| Blocking Buffer (Protein-Based) | Reduces nonspecific binding. Choice depends on target (BSA, casein, serum). | Thermo Fisher SuperBlock, Blocker BSA (Pierce). |
| Coating Buffer (Carbonate-Bicarbonate, pH 9.6) | Provides alkaline environment for passive adsorption of proteins to polystyrene. | Prepared fresh or commercially available stabilized solutions. |
| Wash Buffer Concentrate (PBS with Tween-20) | Removes unbound material. Consistent formulation is critical for reproducibility. | BioTek, Sigma-Aldrich, automated plate washer concentrates. |
| Precision Multichannel Pipettes | For accurate, high-throughput reagent dispensing. | Eppendorf Research plus, Rainin Pipet-Lite LTS. |
| Microplate Reader (Absorbance/Chemiluminescence) | Quantifies assay signal. Requires appropriate filters (e.g., 450nm, 492nm). | BioTek Synergy, Molecular Devices SpectraMax, Tecan Spark. |
*Mention of suppliers is for illustrative purposes; equivalent products from other reputable manufacturers are suitable.
Within the comprehensive framework of enzyme-linked immunosorbent assay (ELISA) methodologies—including direct, indirect, sandwich, and competitive formats—the final detection step is paramount. This technical guide provides an in-depth analysis of the three predominant signal detection modalities: colorimetric, chemiluminescent, and fluorescent. Each system converts the specific antibody-antigen interaction into a measurable signal, with critical implications for assay sensitivity, dynamic range, and suitability for various research and drug development applications.
Core Detection Principles
Colorimetric Detection
Colorimetric detection relies on an enzyme-conjugated reporter (e.g., Horseradish Peroxidase - HRP or Alkaline Phosphatase - AP) catalyzing the conversion of a colorless substrate into a colored soluble product. The intensity of the color, measured as absorbance (Optical Density - OD) using a plate reader, is proportional to the amount of target analyte.
Key Reaction (HRP with TMB): 3,3',5,5'-Tetramethylbenzidine (TMB) is oxidized by HRP in the presence of hydrogen peroxide (H₂O₂), producing a blue product. Acidification stops the reaction, turning the solution yellow, which is read at 450 nm.
Chemiluminescent Detection
Chemiluminescence generates light as a direct product of an enzyme-driven chemical reaction. An enzyme (e.g., HRP or AP) catalyzes the oxidation of a luminol-based or dioxetane-based substrate, emitting photons detected by a luminometer as Relative Light Units (RLUs). This method typically offers a wider dynamic range and higher sensitivity than colorimetric assays.
Key Reaction (HRP with Luminol): HRP oxidizes luminol in the presence of H₂O₂ and a phenolic enhancer, producing an excited-state intermediate that decays to its ground state, emitting light at ~425 nm.
Fluorescent Detection
Fluorescent detection uses an enzyme (e.g., AP or β-Galactosidase) to convert a non-fluorescent substrate into a highly fluorescent product. Alternatively, direct fluorescence uses fluorophore-labeled antibodies. The emitted fluorescent light at a specific wavelength is measured after excitation at a different wavelength.
Key Reaction (AP with AttoPhos): Alkaline Phosphatase dephosphorylates AttoPhos substrate, producing the fluorescent product AttoPhos, which is excited at ~440 nm and emits at ~560 nm.
Comparative Quantitative Data
Table 1: Performance Comparison of ELISA Detection Methods
| Parameter | Colorimetric | Chemiluminescent | Fluorescent |
|---|---|---|---|
| Typical Sensitivity (Lower Detection Limit) | High pg/mL to low ng/mL | Low to sub-pg/mL | Mid pg/mL to low ng/mL |
| Dynamic Range | ~2 log units | ~4-6 log units | ~3-4 log units |
| Readout | Absorbance (OD) | Relative Light Units (RLU) | Relative Fluorescence Units (RFU) |
| Signal Duration | Stable (hours) | Transient (minutes to hours) | Stable (hours) |
| Primary Enzymes | HRP, AP | HRP, AP | AP, β-Gal, HRP (rare) |
| Common Substrates | TMB, ABTS, OPD | Luminol + enhancer, CDP-Star | AttoPhos, 4-MUP, QuantaBlu |
| Instrumentation | Plate reader (visible wavelength) | Luminometer | Fluorometer/Plate reader (with filters) |
| Multiplexing Potential | Low | Moderate (sequential) | High (different Ex/Em) |
| Common in High-Throughput Screening (HTS) | Moderate | High | High |
Table 2: Common Enzyme-Substrate Pairs by Detection Method
| Enzyme | Colorimetric Substrate | Chemiluminescent Substrate | Fluorescent Substrate |
|---|---|---|---|
| Horseradish Peroxidase (HRP) | TMB (450 nm), ABTS (405 nm) | Enhanced Luminol (e.g., SuperSignal), AMPPD derivatives | Homovanillic acid, Tyramide signal amplification (TSA) |
| Alkaline Phosphatase (AP) | pNPP (405 nm) | CDP-Star, CSPD | AttoPhos (Ex/Em 440/560 nm), 4-MUP (Ex/Em 360/450 nm) |
| β-Galactosidase (β-Gal) | ONPG (420 nm) | AMPGD | MUG (Ex/Em 360/450 nm) |
Detailed Experimental Protocols
Protocol: Colorimetric ELISA (HRP/TMB)
This protocol assumes a completed capture and detection antibody incubation in a sandwich ELISA format.
- Washing: Wash the microplate 4 times with 300 µL of PBS containing 0.05% Tween-20 (PBST) per well.
- Substrate Preparation: Prepare TMB substrate solution immediately before use by mixing equal volumes of stabilized TMB (e.g., TMB Single Solution). For H₂O₂-based systems, mix TMB and H₂O₂ components per manufacturer's instructions. Avoid metal ions.
- Substrate Incubation: Add 100 µL of TMB substrate to each well. Incubate at room temperature in the dark for 5-30 minutes. Monitor blue color development visually.
- Stop Reaction: Add 100 µL of 1M sulfuric acid (H₂SO₄) or 1M phosphoric acid (H₃PO₄) to each well. The color will change from blue to yellow.
- Readout: Measure absorbance at 450 nm (primary) and 570 nm or 620 nm (reference wavelength for well imperfection correction) using a microplate reader within 30 minutes.
Protocol: Chemiluminescent ELISA (HRP/Enhanced Luminol)
This protocol assumes a completed capture and detection antibody incubation.
- Washing: Wash the microplate 5 times with 300 µL PBST per well. Ensure complete removal of wash buffer by blotting.
- Substrate Preparation: Prepare working solution of a commercial enhanced chemiluminescent substrate (e.g., SuperSignal ELISA Pico) by mixing stable peroxidase solution and luminol/enhancer solution in a 1:1 ratio. Prepare fresh and protect from light.
- Substrate Incubation: Add 100 µL of substrate working solution to each well. Incubate at room temperature for 2-5 minutes.
- Readout: Read plate immediately using a luminometer capable of integrating signal over 100-1000 ms per well. No stop solution is used. Ensure consistent timing between addition and reading.
Protocol: Fluorescent ELISA (AP/AttoPhos)
This protocol assumes a completed capture and detection antibody incubation with an AP-conjugated detector.
- Washing: Wash the microplate 5 times with 300 µL of AP-specific assay buffer (e.g., diethanolamine or Tris-based, without azide) per well.
- Substrate Preparation: Prepare 1 mM AttoPhos substrate solution in AttoPhos Fluorescent Amplification Buffer according to manufacturer instructions.
- Substrate Incubation: Add 100 µL of substrate solution to each well. Seal plate and incubate at 37°C for 60 minutes (or as optimized). Protect from light.
- Readout: Measure fluorescence using a fluorometer or fluorescence-capable microplate reader with excitation filter ~440 nm and emission filter ~560 nm. No stop solution is required.
Signaling Pathways and Workflows
Title: Colorimetric Detection Signal Pathway
Title: Chemiluminescent Detection Signal Pathway
Title: Fluorescent Detection Signal Pathway
Title: Generic ELISA Workflow with Detection
The Scientist's Toolkit: Research Reagent Solutions
Table 3: Essential Materials for ELISA Detection
| Item | Function & Key Consideration |
|---|---|
| Microplate | Solid support (typically 96-well). Choice: High-binding (e.g., polystyrene) for passive adsorption of capture antibodies. |
| Capture Antibody | Binds target antigen with high affinity and specificity. Must be purified and in a buffer without carrier proteins or azide for effective coating. |
| Blocking Buffer | Saturates unused protein-binding sites to prevent nonspecific adsorption. Common: 1-5% BSA, casein, or non-fat dry milk in PBS. Choice depends on assay and detection method (e.g., avoid AP with phosphate buffers). |
| Detection Antibody | Binds a different epitope on the antigen (sandwich) or the capture antibody (indirect). Conjugated directly to an enzyme or used with a secondary conjugate. |
| Enzyme Conjugate | HRP or AP linked to detection antibody (direct/primary) or secondary antibody (indirect). Critical parameter: optimal dilution to maximize signal-to-noise. |
| Wash Buffer | Typically PBS or Tris with a low-concentration detergent (0.05% Tween-20) to remove unbound reagents while maintaining complex stability. |
| Detection Substrate | Colorimetric: Ready-to-use TMB. Chemiluminescent: Enhanced luminol-based (HRP) or dioxetane-based (AP). Fluorescent: e.g., AttoPhos (AP). Must match enzyme conjugate. |
| Stop Solution | Colorimetric only: Acid (e.g., 1M H₂SO₄) to halt enzyme reaction and stabilize final chromophore. Not used in chemiluminescent or fluorescent assays. |
| Plate Reader | Instrument matched to detection: Filter-based or monochromator-based absorbance reader, luminometer, or fluorometer. Calibration and linear range validation are essential. |
| Reference Standard | Purified, quantitated antigen for generating a standard curve, enabling conversion of signal (OD, RLU, RFU) to analyte concentration. |
Step-by-Step ELISA Protocols: From Setup to Data Analysis for Each Format
Direct ELISA is a fundamental immunoassay technique prized for its procedural simplicity and speed. Within the broader ELISA method landscape—which includes indirect, sandwich, and competitive formats—the direct format provides a streamlined, one-step detection system ideally suited for validating and quantifying high-affinity antigens. This guide details the protocol, its optimal applications, and key considerations for robust experimental design.
Principles and Comparative Advantages
The core principle involves immobilizing the target antigen directly onto a polystyrene microplate, followed by a single incubation with an enzyme-conjugated primary antibody. An enzyme substrate is then added to generate a measurable signal proportional to the antigen concentration.
Comparative Analysis of ELISA Formats
Table 1: Key Characteristics of Major ELISA Formats
| Feature | Direct ELISA | Indirect ELISA | Sandwich ELISA | Competitive ELISA |
|---|---|---|---|---|
| Procedure Steps | Antigen > Enzyme-Ab > Substrate | Antigen > Primary Ab > Enzyme-Secondary Ab > Substrate | Capture Ab > Antigen > Detection Ab > (Optional: Enzyme-Secondary Ab) > Substrate | Antigen/Standard + Sample > Enzyme-Ab > (on coated antigen) > Substrate |
| Time | ~2 hours | ~3 hours | ~4 hours | ~2-3 hours |
| Sensitivity | Lower | High (due to signal amplification) | Highest | Variable (high for small antigens) |
| Specificity | Dependent on single Ab | High (two binding events) | Very High (two Abs) | High |
| Flexibility | Low (needs conjugated Ab) | High (same secondary Ab for many) | High (for capture/detection pairs) | Used for small antigens/haptens |
| Best For | High-affinity targets, epitope mapping, simple quantification | General research, high sensitivity needed | Complex samples (e.g., sera), high specificity/sensitivity | Small antigens, haptens, samples with impurities |
Detailed Direct ELISA Protocol
Materials & Reagent Solutions
Table 2: Essential Research Reagent Solutions for Direct ELISA
| Reagent/Material | Function & Critical Notes |
|---|---|
| Polystyrene Microplate (High-Binding) | Solid phase for passive adsorption of antigens via hydrophobic interactions. |
| Coating Buffer (Carbonate-Bicarbonate, pH 9.6) | Alkaline buffer optimizes protein adsorption to plastic by promoting electrostatic interaction. |
| Wash Buffer (PBS with 0.05% Tween 20, PBS-T) | Removes unbound reagents; Tween 20 minimizes non-specific binding. |
| Blocking Buffer (1-5% BSA or 5% Non-Fat Dry Milk in PBS) | Covers unsaturated plastic sites to prevent non-specific adsorption of detection antibody. |
| Target Antigen | Purified protein, peptide, or cell lysate. Purity is critical for specificity. |
| Enzyme-Conjugated Primary Antibody | The key detection reagent. Must be validated for direct ELISA; HRP or AP are common enzymes. |
| Enzyme Substrate | TMB (colorimetric, HRP) or pNPP (colorimetric, AP). Produces measurable product. |
| Stop Solution (e.g., 1M H2SO4 for TMB) | Halts enzyme reaction and stabilizes final color for measurement. |
| Plate Reader | Spectrophotometer for measuring absorbance at appropriate wavelength (e.g., 450nm for TMB). |
Step-by-Step Methodology
Antigen Coating:
- Prepare antigen dilution in carbonate-bicarbonate coating buffer (pH 9.6). Typical coating concentration ranges from 1-10 µg/mL.
- Dispense 50-100 µL per well into the microplate.
- Seal plate and incubate overnight at 4°C or for 1-2 hours at 37°C.
- Critical: Include blank wells (coating buffer only) for background subtraction.
Washing:
- Aspirate coating solution.
- Wash plate 3 times with 200-300 µL PBS-T per well. Ensure complete removal of liquid between washes.
Blocking:
- Add 200-300 µL of blocking buffer (e.g., 3% BSA/PBS) to each well.
- Incubate for 1-2 hours at room temperature or 37°C.
- Wash plate 3 times as before.
Detection Antibody Incubation:
- Prepare optimal dilution of enzyme-conjugated primary antibody in blocking buffer or a dedicated antibody diluent. (Determine dilution empirically).
- Add 50-100 µL per well.
- Incubate for 1-2 hours at room temperature.
- Wash plate 3-5 times thoroughly to remove any unbound antibody.
Signal Detection:
- Add enzyme substrate (e.g., TMB) to each well as per manufacturer’s instructions.
- Incubate in the dark at room temperature for 5-30 minutes until color develops.
- Stop the reaction with an equal volume of stop solution (e.g., 1M H2SO4 for TMB). Color change from blue to yellow.
Data Acquisition:
- Read absorbance immediately on a plate reader at the appropriate wavelength (450nm for acidified TMB).
- Subtract the average absorbance of blank wells from sample values.
Data Analysis
Plot mean absorbance (y-axis) against antigen concentration (x-axis) to generate a standard curve using 4- or 5-parameter logistic regression. Use this curve to interpolate unknown sample concentrations.
Visualization of Workflow and Context
Direct ELISA Procedural Workflow
When to Choose Direct ELISA
Critical Considerations for Success
- Antigen Purity and Stability: Contaminants can compete for binding sites, skewing results.
- Antibody Quality: The enzyme-conjugated primary antibody must be specific, high-affinity, and its activity must be preserved. Direct conjugation can sometimes compromise antibody binding.
- Optimization: Each step (coating concentration, antibody dilution, incubation times) requires empirical optimization for each new antigen-antibody pair.
- Limitations: Lower sensitivity compared to amplified methods and lack of signal amplification limit use for low-abundance targets.
Within the comprehensive ELISA toolkit, the direct format remains the most straightforward path to quantitative data for well-characterized, high-affinity targets. Its elegance lies in minimizing steps and reagents, reducing potential background and cross-reactivity. For applications where a validated, conjugated antibody is available—such as epitope mapping, viral titer determination, or quality control of purified proteins—direct ELISA offers an efficient and robust solution. However, for complex biological samples requiring ultra-sensitive detection, researchers must look to the amplified signal of indirect or the enhanced specificity of sandwich ELISA formats.
Within the comprehensive landscape of immunoassays, the Enzyme-Linked Immunosorbent Assay (ELISA) remains a cornerstone technique. Its primary formats—direct, indirect, sandwich, and competitive—each offer distinct advantages tailored to specific experimental needs. This whitepaper focuses on the indirect ELISA format, positioned within this broader methodological thesis. Its core strengths of signal amplification and secondary reagent flexibility make it a versatile and powerful tool for detecting specific antibodies in a sample, critical for immunogenicity testing, serology, and autoimmune disease diagnostics in research and drug development.
Principle and Amplification Mechanism
The indirect ELISA protocol capitalizes on a two-step detection process. First, a purified antigen is immobilized onto a microplate well. The sample containing the primary antibody (e.g., serum) is added; if present, the antibody binds to the antigen. Unbound components are washed away. A secondary antibody, which is enzyme-conjugated and directed against the Fc region of the primary antibody species (e.g., anti-human IgG-HRP), is then added. This secondary antibody binds to multiple epitopes on the primary antibody, leading to the incorporation of several enzyme molecules per primary antibody. This key step provides significant signal amplification compared to direct ELISA. Finally, a chromogenic substrate is added, and the enzymatic reaction produces a measurable color change proportional to the primary antibody concentration.
Title: Indirect ELISA Workflow and Amplification
Detailed Protocol Methodology
Key Reagents & Materials:
- Coating Buffer: 0.05 M Carbonate-Bicarbonate buffer, pH 9.6. Provides optimal pH for passive adsorption of protein antigens to polystyrene plates.
- Wash Buffer: Phosphate-Buffered Saline (PBS) or Tris-Buffered Saline (TBS) with 0.05% Tween 20 (PBST/TBST). Removes unbound reagents; detergent minimizes non-specific binding.
- Blocking Buffer: 1-5% Bovine Serum Albumin (BSA) or non-fat dry milk in wash buffer. Saturates uncovered plastic surfaces to prevent non-specific adsorption of detection antibodies.
- Diluent Buffer: Typically the same as blocking buffer. Used to dilute serum samples and detection antibodies to optimal concentrations.
- Detection Antibody: Enzyme-conjugated secondary antibody (e.g., Anti-Human IgG-HRP). Selection is based on the host species of the primary antibody.
- Substrate: TMB (3,3',5,5'-Tetramethylbenzidine) for HRP, or pNPP (p-Nitrophenyl Phosphate) for Alkaline Phosphatase (AP). Yields a colored product upon enzymatic cleavage.
- Stop Solution: 1M or 2M Sulfuric Acid (for TMB/HRP). Halts the enzymatic reaction and stabilizes the final signal.
Step-by-Step Protocol:
- Coating: Dilute the purified antigen to a concentration of 1-10 µg/mL in carbonate coating buffer. Add 50-100 µL per well of a 96-well microplate. Seal and incubate overnight at 4°C or for 1-2 hours at 37°C.
- Washing: Aspirate liquid from wells. Wash each well 3-5 times with 200-300 µL of wash buffer (PBST). Blot plate thoroughly on absorbent paper.
- Blocking: Add 150-200 µL of blocking buffer to each well. Incubate for 1-2 hours at 37°C or overnight at 4°C. Wash as in step 2.
- Primary Antibody Incubation: Prepare serial dilutions of the test sample (e.g., serum, hybridoma supernatant) in diluent buffer. Add 50-100 µL of each dilution to antigen-coated wells. Include appropriate controls (blank, negative, positive). Incubate for 1-2 hours at 37°C. Wash thoroughly.
- Secondary Antibody Incubation: Dilute the enzyme-conjugated secondary antibody to the manufacturer's recommended concentration (typically 0.01-0.1 µg/mL) in diluent buffer. Add 50-100 µL per well. Incubate for 1-2 hours at 37°C. Wash thoroughly.
- Substrate Addition: Add 50-100 µL of freshly prepared substrate solution per well. Incubate in the dark at room temperature for 5-30 minutes, monitoring color development.
- Signal Detection & Analysis: Add 50 µL of stop solution per well (if required). Read the absorbance immediately using a plate reader at the appropriate wavelength (e.g., 450 nm for TMB). Plot absorbance versus sample dilution to determine titer or concentration.
Flexibility and Comparative Analysis
The indirect ELISA's flexibility stems from the commercial availability of a vast array of standardized, labeled secondary antibodies. One labeled secondary reagent can be used with any primary antibody from the same host species, reducing costs and labor compared to direct ELISA. This contrasts with sandwich ELISA (which requires two matched antibodies for antigen detection) and competitive ELISA (used for small molecules).
Table 1: Key Comparison of Major ELISA Formats
| Feature | Indirect ELISA | Direct ELISA | Sandwich ELISA | Competitive ELISA |
|---|---|---|---|---|
| Primary Target | Antibody in sample | Antigen in sample | Antigen in sample | Small molecule/antigen |
| Antibodies Used | Antigen + Primary Ab + Labeled Secondary Ab | Labeled Primary Ab only | Matched Capture Ab + Detection Ab | Antigen + Primary Ab |
| Signal Amplification | High (multiple enzymes/primary Ab) | Low (one enzyme/primary Ab) | High | Low |
| Flexibility | Very High (universal secondary) | Low (each Ab must be labeled) | Moderate (requires Ab pair) | Moderate |
| Typical Application | Serology, immunogenicity | Antigen detection with purified Ab | Complex sample antigen detection | Hapten, drug monitoring |
Optimization and Troubleshooting Guide
Critical Parameters:
- Coating Antigen Concentration & Purity: Optimize via checkerboard titration against a positive control serum. Impurities increase background.
- Sample & Antibody Dilutions: Must be titrated to find the linear range of detection and avoid the prozone effect (high-dose hook effect).
- Incubation Times/Temperatures: Affect binding kinetics. Longer, cooler incubations (e.g., 4°C overnight) can increase sensitivity and specificity.
- Blocking Agent: BSA is standard; casein or fish gelatine can reduce non-specific binding in problematic assays.
Common Issues & Solutions:
- High Background: Increase wash stringency (salt, detergent concentration), change blocking agent, optimize secondary antibody dilution.
- Low Signal: Check antigen integrity, increase primary/secondary incubation time, use higher affinity antibodies, switch to a more sensitive substrate (e.g., chemiluminescent).
- High Variation: Ensure consistent plate washing, reagent dispensing, and sample handling.
Title: Indirect ELISA Troubleshooting: High Background
The Scientist's Toolkit: Essential Research Reagents
Table 2: Core Reagent Solutions for Indirect ELISA
| Reagent/Solution | Primary Function | Key Considerations |
|---|---|---|
| Carbonate-Bicarbonate Buffer (pH 9.6) | Optimal for passive adsorption of proteins to polystyrene plates. | Freshly prepared; high pH facilitates binding. |
| PBS/TBS with 0.05% Tween 20 (PBST/TBST) | Wash buffer; removes unbound material while minimizing non-specific binding. | Osmolarity matches physiological conditions; Tween is a non-ionic detergent. |
| Blocking Agent (BSA, Casein) | Saturates remaining protein-binding sites on the plate after coating. | Must be unrelated to assay components; choice impacts background. |
| Enzyme-Conjugated Secondary Antibody | Binds to primary antibody; enzyme catalyzes colorimetric reaction. | Must be specific for host species/isotype of primary Ab; conjugate stability is critical. |
| Chromogenic Substrate (TMB, pNPP) | Provides the detectable signal upon enzymatic conversion. | TMB/HRP is common; stop solution required; light-sensitive. |
| Microplate Reader | Quantifies absorbance of the final colored product. | Must have correct optical filter (e.g., 450 nm for TMB). |
Within the comprehensive landscape of immunoassay techniques—including direct, indirect, and competitive ELISA formats—the sandwich ELISA stands out as the preeminent method for the quantification of antigens in complex biological matrices. Its superior specificity and sensitivity, derived from the use of two matched antibodies, make it indispensable for biomarker validation, drug pharmacokinetic studies, and diagnostic development where precision in a high-background environment is non-negotiable.
Fundamental Principles and Advantages
The assay employs a capture antibody immobilized on a solid phase (typically a microplate) and a detection antibody that binds a distinct epitope on the target antigen, forming an antibody-antigen-antibody "sandwich." This dual recognition confers exceptional specificity, effectively minimizing cross-reactivity with other components in samples like serum, plasma, cell lysates, or tissue homogenates. The signal is subsequently generated via an enzyme (e.g., Horseradish Peroxidase - HRP) conjugated to the detection antibody, with amplification achieved through enzymatic turnover of a chromogenic, fluorescent, or chemiluminescent substrate.
Key Advantages:
- High Specificity: Two epitope bindings reduce false positives.
- Enhanced Sensitivity: Effective antigen concentration from solution and signal amplification.
- Tolerance for Complex Samples: Can be used with crude samples without extensive purification.
- Robust Quantification: Wide dynamic range with appropriate standards.
Detailed Protocol for a Standard HRP-Based Sandwich ELISA
Day 1: Coating
- Capture Antibody Preparation: Dilute the purified, sterile capture antibody in carbonate-bicarbonate coating buffer (0.1 M, pH 9.6) or PBS (0.01 M, pH 7.4). Typical concentration ranges from 1–10 µg/mL (see Table 1).
- Coating: Add 100 µL of the antibody solution to each well of a 96-well microplate. Seal the plate and incubate overnight at 4°C for optimal binding.
Day 2: Blocking, Antigen Incubation, and Detection
- Washing: Aspirate the coating solution and wash the plate three times with 300 µL of wash buffer (e.g., PBS with 0.05% Tween 20, PBST) using a plate washer or manual multichannel pipette. Blot plate on absorbent paper.
- Blocking: Add 200–300 µL of blocking buffer (e.g., 1–5% BSA or 5% non-fat dry milk in PBST) to each well. Incubate for 1–2 hours at room temperature (RT) on a plate shaker. Wash three times.
- Antigen Incubation:
- Prepare a standard curve by serial dilution of the purified antigen in the sample diluent/assay buffer (e.g., 1% BSA in PBST).
- Dilute test samples in the same buffer.
- Add 100 µL of standards, samples, and blanks (buffer only) to designated wells.
- Incubate for 2 hours at RT or 1 hour at 37°C on a shaker. Wash 3–5 times thoroughly.
- Detection Antibody Incubation: Add 100 µL of the biotinylated or enzyme-conjugated detection antibody (optimally titrated, typically 0.5–2 µg/mL in assay buffer). Incubate for 1–2 hours at RT. Wash 3–5 times.
- (If using biotin-avidin system): Add 100 µL of Streptavidin-HRP conjugate (diluted per manufacturer's recommendation in assay buffer). Incubate for 30–45 minutes at RT, protected from light. Wash 3–5 times.
- Signal Development: Add 100 µL of substrate solution (e.g., TMB for HRP) to each well. Incubate in the dark at RT for 5–30 minutes, monitoring color development.
- Stop the Reaction: Add 50–100 µL of stop solution (e.g., 1M H2SO4 for TMB). Gently tap the plate to mix.
- Absorbance Measurement: Read the plate immediately at the appropriate wavelength (e.g., 450 nm for TMB, with a 620 nm or 570 nm reference).
Data Analysis
Plot the mean absorbance of the standard curve duplicates against their concentration. Fit a 4- or 5-parameter logistic (4PL/5PL) curve. Interpolate sample concentrations from the standard curve.
Table 1: Typical Reagent Concentrations and Performance Metrics for Sandwich ELISA
| Parameter | Typical Range / Value | Notes |
|---|---|---|
| Capture Antibody Coating Conc. | 1 – 10 µg/mL | Higher affinity allows lower concentration. |
| Antigen Incubation Time | 1 – 2 hours | Longer incubation may increase sensitivity. |
| Detection Antibody Conc. | 0.5 – 2 µg/mL | Must be optimized via checkerboard titration. |
| Assay Dynamic Range | 3 – 4 Logs | e.g., 15.6 – 1000 pg/mL. |
| Lower Limit of Detection (LLOD) | 1 – 10 pg/mL | Varies significantly by target and antibody pair. |
| Intra-assay Precision (CV) | < 10% | Coefficient of variation within a plate. |
| Inter-assay Precision (CV) | < 15% | Coefficient of variation between plates/runs. |
| Sample Volume | 50 – 100 µL | Sufficient for most applications. |
The Scientist's Toolkit: Essential Research Reagent Solutions
Table 2: Key Reagents and Their Functions in Sandwich ELISA
| Reagent / Material | Function / Purpose |
|---|---|
| High-Affinity, Matched Antibody Pair | The core of the assay; must recognize distinct, non-overlapping epitopes on the target antigen. |
| 96-Well Microplate (High-Binding) | Polystyrene plate treated for optimal protein adsorption and immobilization. |
| Protein-Free Blocking Buffer | For biomarker assays; minimizes background vs. protein-based blockers (BSA, Casein). |
| Chemiluminescent Substrate (e.g., luminol-based) | Provides higher sensitivity and broader dynamic range than chromogenic substrates like TMB. |
| Recombinant Antigen Standard | Highly pure, quantified protein essential for generating an accurate standard curve. |
| Stabilized Enzyme Conjugate (e.g., HRP) | Consistent signal generation; stability reduces batch-to-batch variation. |
| Plate Sealers & Pre-filled Wash Buffers | Prevent contamination and evaporation; ensure consistent, efficient washing. |
| Signal Enhancers/Amplifiers | Systems (e.g., tyramide) that deposit multiple enzyme labels per binding event, boosting sensitivity. |
Signaling and Workflow Visualizations
Critical Experimental Considerations
- Antibody Pair Selection: The fundamental determinant of success. Antibodies must be epitope-mapped to ensure they do not compete.
- Checkerboard Titration: A mandatory optimization to determine the optimal concentration combination of capture and detection antibodies for maximum signal-to-noise.
- Matrix Effects: Sample diluent must contain blockers to neutralize interference from heterophilic antibodies, complement, or other serum factors. Parallel analysis of samples in a "spike-and-recovery" experiment is crucial.
- Signal Detection Mode: Chemiluminescence offers the highest sensitivity, followed by fluorescence and colorimetry. Choice depends on required detection limits and available instrumentation.
As a cornerstone technique within the ELISA pantheon, the sandwich ELISA protocol provides an unmatched combination of specificity, sensitivity, and robustness for analyzing targets in complex samples. Its pivotal role in translating basic research findings into validated assays for drug development and clinical diagnostics underscores its enduring status as the gold standard. Mastery of its detailed protocol, coupled with rigorous optimization and validation, remains an essential skill for researchers demanding reliable quantitative protein data.
Within the broader landscape of Enzyme-Linked Immunosorbent Assay (ELISA) methods—including direct, indirect, and sandwich formats—the competitive (or inhibition) ELISA stands as a critical technique for quantifying small molecules, haptens, and analytes for which only one specific antibody is available. This guide details the protocol, grounded in the principle of competition between a target antigen and a reference, labeled antigen for a limited number of antibody-binding sites. The method is indispensable in therapeutic drug monitoring, hormone assays, and environmental toxin detection.
Core Principle and Workflow
The fundamental principle involves immobilizing a known quantity of a reference antigen (or capture molecule) on the microplate. The sample containing the unknown concentration of target analyte is mixed with a fixed concentration of specific, enzyme-conjugated antibody. This mixture is then added to the coated well. Unlabeled analyte (from the sample) and the immobilized reference antigen compete for binding to the conjugated antibody. After washing, substrate is added. The resulting signal is inversely proportional to the concentration of the analyte in the sample: higher analyte concentration leads to less antibody available to bind the plate, resulting in lower signal.
Detailed Experimental Protocol
Protocol: Competitive ELISA for Small Molecule Quantification
Objective: To determine the concentration of a target hapten (e.g., a steroid hormone) in an unknown sample.
Materials & Reagents: See "The Scientist's Toolkit" below.
Procedure:
Plate Coating:
- Dilute the reference antigen (e.g., drug-protein conjugate or hapten-protein conjugate) in carbonate-bicarbonate coating buffer (pH 9.6) to a concentration of 1-10 µg/mL.
- Add 100 µL per well to a 96-well microplate.
- Seal plate and incubate overnight at 4°C (or 2 hours at 37°C).
Blocking:
- Aspirate and wash plate 3 times with 300 µL/well of Wash Buffer (PBS + 0.05% Tween 20).
- Add 200 µL of Blocking Buffer (e.g., 1% BSA or 5% non-fat dry milk in PBS) to each well.
- Incubate at 37°C for 1-2 hours (or RT for 2 hours).
Competition and Antibody Binding:
- Wash plate 3 times as in Step 2.
- Prepare Competition Mixture: In separate tubes, mix a fixed volume of your sample (or standard analyte at known concentrations) with an equal volume of the enzyme-conjugated primary antibody at its predetermined optimal working dilution in Assay Buffer. Prepare a "max binding" control (no analyte, only buffer + antibody) and a "blank" (no antibody).
- Incubate these mixtures at 37°C for 30-60 minutes to allow competition in solution.
- Transfer 100 µL of each mixture to the corresponding antigen-coated well.
- Incubate the plate at 37°C for 45-90 minutes.
Detection:
- Wash plate 5 times thoroughly with Wash Buffer.
- Add 100 µL of appropriate enzyme substrate (e.g., TMB for HRP, pNPP for AP) to each well.
- Incubate in the dark at RT for 10-30 minutes until color develops sufficiently in the max binding control wells.
Signal Measurement and Analysis:
- Stop the reaction with 50 µL of Stop Solution (e.g., 1M H2SO4 for TMB).
- Immediately measure the absorbance (e.g., at 450 nm for TMB) using a microplate reader.
- Generate a standard curve by plotting the log of the standard concentration (x-axis) against the percentage of Bound/Total (%B/B0) signal (y-axis), where B0 is the signal from the max binding control (zero analyte). Use a 4- or 5-parameter logistic curve fit to interpolate unknown sample concentrations.
Data Presentation: Key Performance Metrics
Table 1: Typical Standard Curve Parameters for a Competitive ELISA
| Parameter | Typical Target Range / Value | Notes |
|---|---|---|
| Standard Curve Range | 0.1 - 100 ng/mL | Varies widely based on analyte-antibody affinity. |
| Limit of Detection (LOD) | 0.05 - 0.5 ng/mL | Calculated as mean blank signal + 3(SD). |
| Limit of Quantification | 0.1 - 1.0 ng/mL | Calculated as mean blank signal + 10(SD). |
| Intra-assay CV | < 10% | Coefficient of Variation for replicates within the same plate. |
| Inter-assay CV | < 15% | CV for replicates across different plates/runs. |
| Dynamic Range | 2-3 orders of magnitude | Linear range on the log-linear plot. |
| IC50 (Sensitivity) | Analyte-dependent | Concentration causing 50% inhibition of max signal. Key comparison value. |
Table 2: Comparison of ELISA Formats in Research Context
| Format | Antigen Requirement | Antibody Requirement | Best For | Not Ideal For |
|---|---|---|---|---|
| Direct | Purified, high concentration | Must be enzyme-labeled | Quick, simple assays; avoiding cross-reactivity. | Low sensitivity; labeling every primary Ab. |
| Indirect | Purified, high concentration | One unlabeled primary; labeled secondary | High sensitivity; signal amplification. | Potential cross-reactivity from secondary Ab. |
| Sandwich | Must have at least two non-overlapping epitopes | Two specific antibodies (capture & detection) | High specificity and sensitivity for large proteins. | Small molecules/haptens (single epitope). |
| Competitive | Known reference antigen for coating | One specific, high-affinity labeled antibody | Small molecules, haptens, low MW antigens. | Large antigens with multiple epitopes. |
The Scientist's Toolkit
| Reagent / Material | Function & Critical Notes |
|---|---|
| 96-Well Microplate (High Binding) | Polystyrene plate with high protein-binding capacity for effective passive adsorption of coating antigen. |
| Reference Antigen (Coating Antigen) | Hapten-carrier protein conjugate or analogous molecule that mimics the target analyte for plate immobilization. |
| Enzyme-Conjugated Primary Antibody | Specific antibody directly linked to HRP or AP. Must have high affinity for both analyte and coating antigen. |
| Blocking Buffer (e.g., 1% BSA/PBS) | Blocks non-specific binding sites on the plate to reduce background noise. |
| Wash Buffer (PBS with 0.05% Tween 20) | Removes unbound reagents; Tween 20 reduces non-specific binding. |
| Chromogenic Substrate (e.g., TMB) | Enzyme substrate that produces a measurable color change upon catalysis. |
| Stop Solution (e.g., 1M H2SO4) | Halts the enzymatic reaction at a defined timepoint for consistent measurement. |
| Microplate Spectrophotometer | Instrument to measure absorbance of the colored product in each well quantitatively. |
This technical guide details the five critical steps common to all Enzyme-Linked Immunosorbent Assay (ELISA) formats: coating, blocking, incubation, washing, and detection. Framed within a broader thesis on ELISA methodologies—including direct, indirect, sandwich, and competitive assays—this whitepaper provides an in-depth protocol for researchers and drug development professionals, emphasizing the technical precision required for robust and reproducible results.
Coating
Coating is the immobilization of a capture molecule (antigen or antibody) onto a solid polystyrene plate. The process relies on passive adsorption via hydrophobic interactions.
Detailed Protocol: Antigen Coating for Indirect ELISA
- Prepare a coating buffer, typically 0.05 M carbonate-bicarbonate, pH 9.6.
- Dilute the purified antigen to a concentration range of 1-10 µg/mL in coating buffer.
- Dispense 50-100 µL per well into a 96-well microplate.
- Seal the plate and incubate overnight at 4°C or for 1-3 hours at 37°C.
- Following incubation, decant the coating solution.
Table 1: Optimization Parameters for Coating
| Parameter | Typical Range | Optimization Notes |
|---|---|---|
| Coating Buffer pH | 9.4 - 9.8 | Higher pH increases well surface negative charge, enhancing adsorption of basic proteins. |
| Antigen Concentration | 1 - 10 µg/mL | Must be titrated; high concentrations can cause multi-layering, low concentrations reduce sensitivity. |
| Incubation Time | 1h (37°C) to O/N (4°C) | Longer, cooler incubation often yields more uniform adsorption. |
| Well Volume | 50 - 100 µL | Must be sufficient to cover the well bottom without evaporation. |
Blocking
Blocking saturates remaining protein-binding sites on the plate surface to prevent non-specific adsorption of subsequent reagents, reducing background noise.
Detailed Protocol: Protein-Based Blocking
- After decanting the coating solution, wash the plate once gently with Wash Buffer (e.g., PBS with 0.05% Tween 20).
- Prepare a blocking buffer containing 1-5% (w/v) blocking agent (e.g., BSA, non-fat dry milk, or casein) in Wash Buffer or PBS.
- Add 150-300 µL per well to fully cover the surface.
- Incubate at room temperature (20-25°C) for 1-2 hours with gentle agitation.
- Decant blocking buffer. The plate can be used immediately or dried and sealed for short-term storage at 4°C.
Table 2: Common Blocking Agents and Properties
| Blocking Agent | Typical Concentration | Advantages | Disadvantages |
|---|---|---|---|
| Bovine Serum Albumin (BSA) | 1 - 5% | Highly defined, consistent, low interference in downstream steps. | Can contain bovine Ig contaminants. |
| Non-Fat Dry Milk | 3 - 5% | Inexpensive, effective for many applications. | Contains endogenous biotin and phosphatases; can spoil. |
| Casein | 1 - 3% | Low endogenous enzyme activity, good for phosphatase systems. | Can form suspensions. |
Incubation
Incubation steps involve the specific binding of analytes and detection antibodies. Precise timing, temperature, and concentration are critical.
Detailed Protocol: Primary Antibody Incubation (Indirect ELISA)
- Prepare serial dilutions of the primary antibody in the same buffer used for blocking (e.g., 1% BSA in PBST).
- Add 50-100 µL of each dilution to designated antigen-coated wells. Include blank (buffer only) and negative control wells.
- Seal the plate and incubate for 1-2 hours at room temperature or overnight at 4°C for higher sensitivity.
- Proceed to washing.
Washing
Washing removes unbound reagents, minimizing background and non-specific signal. It is performed after each incubation step.
Detailed Protocol: Manual Plate Washing
- Decant or aspirate liquid from all wells.
- Fill each well completely with Wash Buffer (e.g., PBS with 0.05% Tween 20, PBST). Use a squirt bottle or multichannel pipette.
- Soak for 15-30 seconds to dissociate weakly bound proteins.
- Decant and tap the plate firmly on absorbent paper to remove residual liquid.
- Repeat the cycle 3-5 times. Consistency in washing time and technique is paramount.
Detection
Detection involves the conversion of a substrate by an enzyme conjugated to a detection antibody, producing a measurable signal proportional to the analyte amount.
Detailed Protocol: Chromogenic Detection for HRP
- Following final wash and after adding enzyme-conjugated secondary antibody (in indirect ELISA), prepare the substrate solution. For Horseradish Peroxidase (HRP), use TMB (3,3',5,5'-Tetramethylbenzidine).
- Important: Prepare TMB solution immediately before use, protected from light.
- Add 50-100 µL of substrate solution to each well.
- Incubate at room temperature in the dark for 5-30 minutes. Monitor color development.
- Stop the reaction by adding an equal volume of stop solution (e.g., 1M H₂SO₄ for TMB, which changes color from blue to yellow).
- Read the absorbance immediately at the appropriate wavelength (450 nm for acidified TMB).
Table 3: Common Enzyme-Substrate Systems for ELISA Detection
| Enzyme | Common Substrate | Signal Type | Readout (Absorbance) | Sensitivity Notes |
|---|---|---|---|---|
| Horseradish Peroxidase (HRP) | TMB | Colorimetric, Soluble | 450 nm | High sensitivity, fast kinetics. Susceptible to NaN₃ inhibition. |
| Horseradish Peroxidase (HRP) | OPD (o-phenylenediamine) | Colorimetric, Soluble | 492 nm | Sensitive but carcinogenic. |
| Alkaline Phosphatase (AP) | PNPP (p-Nitrophenyl Phosphate) | Colorimetric, Soluble | 405 - 415 nm | Linear range, low background. Slower than HRP. |
Experimental Workflow: The Four Core ELISA Formats
ELISA Method Selection and Workflow Comparison
The Scientist's Toolkit: Essential Reagent Solutions
Table 4: Key Research Reagents for ELISA Development
| Reagent / Material | Primary Function | Key Considerations |
|---|---|---|
| 96-Well Polystyrene Microplate | Solid phase for molecule immobilization. | High-binding plates are standard; choose medium or low binding for specific applications (e.g., to reduce non-specific binding of hydrophobic molecules). |
| Carbonate-Bicarbonate Buffer (pH 9.6) | Standard coating buffer. | Optimal pH for passive adsorption of most proteins. Alternative buffers (e.g., PBS) may be used for sensitive antigens. |
| PBS with 0.05% Tween 20 (PBST) | Standard wash and dilution buffer. | Tween 20 reduces non-specific binding. Concentration can be adjusted (0.01-0.1%) to stringency. |
| Blocking Agent (BSA, Casein) | Reduces non-specific binding by saturating empty sites. | Choice affects background and sensitivity. Must be compatible with detection system (e.g., avoid biotin in milk for streptavidin systems). |
| Detection Antibody (HRP or AP conjugate) | Generates measurable signal bound to analyte. | Must be specific for primary antibody (secondary) or analyte (direct/detection). Titration is critical for signal-to-noise ratio. |
| Chromogenic Substrate (e.g., TMB) | Enzyme substrate for colorimetric signal generation. | Must match conjugated enzyme. Ready-to-use formulations ensure stability and consistency. |
| Microplate Reader | Measures absorbance of developed color in each well. | Must have appropriate filter (e.g., 450 nm for TMB). Software for curve fitting (4- or 5-parameter logistic) is essential for quantitation. |
Within the comprehensive framework of Enzyme-Linked Immunosorbent Assay (ELISA) methodologies—encompassing direct, indirect, sandwich, and competitive formats—the generation and interpretation of a standard curve is the critical, unifying step that transforms raw optical density (OD) data into quantifiable analyte concentration. This guide details the technical process of constructing a reliable standard curve, applying appropriate regression models, and calculating unknown sample concentrations with statistical rigor, a fundamental competency for researchers in immunology, diagnostics, and drug development.
The Standard Curve: Principles and Curve Fitting Models
The standard curve is a plot of known analyte concentrations (standards) against their corresponding measured signal (e.g., OD450). The relationship is typically nonlinear, requiring careful model selection.
Table 1: Common Regression Models for ELISA Standard Curves
| Model | Equation | Best Use Case | Key Parameter |
|---|---|---|---|
| 4-Parameter Logistic (4PL) | y = d + (a - d) / (1 + (x/c)^b) | Most common for symmetric sigmoidal curves. Gold standard for immunoassays. | a=Min asymptote, b=Slope, c=Inflection point (EC50), d=Max asymptote |
| 5-Parameter Logistic (5PL) | y = d + (a - d) / (1 + (x/c)^b)^g | For asymmetric sigmoidal curves. Offers greater flexibility. | Adds 'g' for asymmetry factor. |
| Linear (on log-scale) | y = m*log(x) + c | Sometimes used for the linear central portion of the curve. Less accurate for full range. | Simplicity, but risks high error at extremes. |
Experimental Protocol: Generating the Standard Curve
Materials:
- Purified analyte standard of known concentration.
- ELISA kit or self-developed assay components (coated plate, detection antibodies, enzyme conjugate, substrate).
- Serial dilution reagents (assay diluent).
- Multi-channel and single-channel pipettes.
- Microplate washer and reader.
Methodology:
- Reconstitution and Serial Dilution: Reconstitute the standard as per protocol. Perform a serial dilution (e.g., 1:2 or 1:3) in the provided diluent to create a concentration series covering the expected dynamic range (typically 7-8 points).
- Plate Layout: Include all standard points in duplicate or triplicate. Reserve wells for blank (diluent only), positive controls, and unknown samples.
- Assay Execution: Run the complete ELISA protocol (incubation, washing, detection, substrate development) for your specific format (sandwich, competitive, etc.) under consistent conditions.
- Data Acquisition: Read the plate at the appropriate wavelength. Subtract the mean OD of the blank (zero standard) from all other readings to obtain corrected OD values.
Data Interpretation: From OD to Concentration
Step 1: Curve Fitting Input the mean corrected OD for each standard and its known concentration into statistical software (e.g., GraphPad Prism, SoftMax Pro, R). Fit the data using 4PL or 5PL regression. Assess the quality of fit using the coefficient of determination (R²) or the sum of squared residuals.
Step 2: Calculating Unknowns The regression equation is then used to interpolate the concentrations of unknown samples from their corrected OD values. Extrapolation outside the range of the standards must be avoided.
Step 3: Accounting for Dilution If samples were diluted during preparation, multiply the interpolated concentration by the dilution factor (DF).
Final Concentration = Interpolated Concentration × DF
Step 4: Reporting with Confidence Report mean concentration with a measure of precision (e.g., Standard Deviation, Coefficient of Variation) for replicates.
Table 2: Example Data Set and Calculation
| Sample ID | Corrected OD (Mean) | Interpolated Conc. (pg/mL) | Dilution Factor | Final Conc. (pg/mL) | CV (%) |
|---|---|---|---|---|---|
| Std 1 | 0.105 | 15.6 (from curve) | 1 | 15.6 | - |
| Std 2 | 0.250 | 62.5 | 1 | 62.5 | - |
| Unknown A | 0.380 | 125.8 | 10 | 1258 | 4.2% |
| Unknown B | 1.950 | > Upper Limit | 100 | Report as >ULOQ | - |
The Scientist's Toolkit: Essential Reagents & Materials
Table 3: Key Research Reagent Solutions for Quantitative ELISA
| Item | Function in Standard Curve Analysis |
|---|---|
| Purified Reference Standard | Provides the known concentrations for curve generation. Must be identical or immunologically similar to the target analyte. |
| Matrix-Matched Diluent | The buffer used for serial dilution and sample dilution. Should mimic the sample matrix (e.g., serum, cell lysate) to minimize matrix effects. |
| Microplate Reader | Instrument for measuring absorbance (OD). Must be calibrated and have a dynamic range exceeding the assay's signal range. |
| Data Analysis Software | Software capable of nonlinear regression (4PL/5PL) for accurate curve fitting and concentration interpolation. |
| Precision Pipettes & Tips | Critical for accurate serial dilution of standards and samples, the largest source of manual error. |
| Quality Controls (High & Low) | Samples with known concentration within the assay range, run alongside unknowns, to validate the accuracy of each plate's standard curve. |
Visualization of Workflow and Logic
Diagram 1: ELISA Quantification Workflow
Diagram 2: Standard Curve Regression Logic
ELISA Troubleshooting Guide: Solving Common Problems and Enhancing Performance
Diagnosing High Background and Low Signal-to-Noise Ratio
1. Introduction: Context within ELISA Research Within the broader thesis of ELISA method development—spanning direct, indirect, sandwich, and competitive formats—achieving an optimal signal-to-noise ratio (SNR) is paramount. High background and low SNR compromise assay sensitivity, specificity, and reproducibility, leading to erroneous data interpretation in drug development and clinical research. This guide provides a systematic, technical approach to diagnosing and remedying these critical performance issues.
2. Quantitative Data Summary of Common Causes & Effects Table 1: Primary Contributors to High Background in ELISA
| Cause Category | Specific Example | Typical Impact on Background (OD) | Associated ELISA Format |
|---|---|---|---|
| Non-Specific Binding | Inadequate blocking | Increase of 0.3 - 0.8 above baseline | All, especially indirect/sandwich |
| Antibody Cross-Reactivity | Secondary antibody to plate/blocker | Increase of 0.2 - 0.6 | Indirect, Sandwich |
| Contaminated/Impure Reagents | Enzyme conjugate aggregation | Increase of 0.4 - 1.0+ | All |
| Substrate Issues | Premature oxidation or contamination | Increase of 0.5 - 1.2 | All |
| Wash Stringency | Insufficient volume or cycles | Increase of 0.1 - 0.5 | All |
| Plate-Related Issues | High binding plates with low target | Increase of 0.2 - 0.4 | Direct, Competitive |
Table 2: Factors Leading to Low Specific Signal
| Factor | Consequence | Typical Signal Loss |
|---|---|---|
| Low Antigen Affinity/Capture | Poor immobilization/recognition | 40-70% |
| Suboptimal Antibody Concentration | Below saturation point | 50-80% |
| Enzyme Conjugate Degradation | Reduced turnover number | 60-90% |
| Incubation Time/Temperature | Incomplete binding | 30-60% |
| Expired/Inactivated Substrate | Low chromophore/fluorophore generation | 70-95% |
3. Diagnostic Experimental Protocols
Protocol 1: Systematic Component Omission Test Objective: Isolate the reagent(s) causing high background. Methodology:
- Coat multiple plate rows with standard antigen (if applicable) and blocking buffer.
- Sequentially omit key components (primary antibody, secondary antibody, conjugate, substrate) in different wells, replacing with assay buffer.
- Include a "full assay" positive control and a "no primary antibody" negative control.
- Develop plate and measure OD. A high signal in an omission well (e.g., well without primary Ab) pinpoints the source of non-specific binding from downstream components.
Protocol 2: Checkerboard Titration for SNR Optimization Objective: Determine optimal antibody and conjugate concentrations to maximize SNR. Methodology:
- Prepare serial dilutions of capture antibody (for sandwich) or primary antibody (for indirect) in coating buffer across plate columns.
- Prepare serial dilutions of detection antibody or enzyme-conjugate across plate rows.
- Perform assay with a mid-range target antigen concentration and negative controls.
- Calculate SNR for each well: (Mean Signal OD - Mean Negative Control OD) / Standard Deviation of Negative Control.
- Identify the concentration pair yielding the highest SNR with acceptable absolute signal.
Protocol 3: Direct Substrate Integrity Test Objective: Rule out substrate degradation as a cause of high background/low signal. Methodology:
- Prepare fresh substrate working solution per manufacturer instructions.
- Add 100 µL directly to 4-6 wells of a blocked, but otherwise untreated, microplate.
- Immediately measure kinetic reads (e.g., every 30 seconds for 5 minutes) at the appropriate wavelength.
- A rapid increase in OD (>0.05/min) indicates substrate auto-oxidation or contamination.
4. Visualizing Diagnostic Pathways & Workflows
Diagram Title: ELISA Background & SNR Diagnostic Decision Tree
Diagram Title: Core Indirect/Sandwich ELISA Workflow
5. The Scientist's Toolkit: Research Reagent Solutions Table 3: Essential Materials for Troubleshooting ELISA Performance
| Item | Function & Role in Managing Background/SNR |
|---|---|
| High-Purity, Low-Binding Microplates | Minimizes passive protein adsorption, reducing baseline background. |
| Blocking Buffers (e.g., BSA, Casein, Synthetic) | Saturates non-specific sites; choice depends on assay (casein often best for phospho-targets). |
| High-Affinity, Validated Antibody Pairs (for Sandwich) | Ensures efficient capture and detection, maximizing specific signal. |
| Cross-Adsorbed Secondary Antibodies | Reduces cross-reactivity with plate proteins and serum components, lowering background. |
| Stabilized Enzyme Conjugates (HRP, AP) | Provides consistent activity, preventing signal loss over time. |
| Fresh, Quality-Controlled Substrate (TMB, PNPP) | Ensures low background oxidation and high signal generation. |
| Automated Plate Washer & Calibrated Pipettes | Ensures consistent and stringent wash stringency, critical for SNR. |
| Plate Reader with Accurate Filter Sets | Prevents signal crosstalk and ensures measurements at optimal wavelengths. |
Optimizing Antibody Pairings and Concentrations for Sandwich ELISA
Within the comprehensive landscape of ELISA methodologies—spanning direct, indirect, sandwich, and competitive formats—the sandwich ELISA stands out for its exceptional sensitivity and specificity in detecting antigens, particularly proteins, in complex biological matrices. This guide provides an in-depth technical framework for optimizing the two most critical parameters: the pairing of capture and detection antibodies and their respective concentrations. This optimization is paramount for developing robust, high-performance assays critical in both basic research and drug development pipelines.
Fundamental Principles and Antibody Pairing
A sandwich ELISA requires two antibodies that bind to distinct, non-overlapping epitopes on the target antigen. The capture antibody is immobilized on the plate surface, while the detection antibody is conjugated to an enzyme (e.g., Horseradish Peroxidase, HRP) for signal generation.
Optimal Pairing Characteristics:
- Epitope Non-Interference: Antibodies must bind simultaneously. Preferential use of monoclonal antibodies or carefully selected polyclonals raised against different antigen regions is essential.
- Affinity and Specificity: High-affinity antibodies improve sensitivity and reduce incubation times, but must be balanced with minimal cross-reactivity.
- Matched Species/Isotype: Avoid using antibodies from the same species unless specific cross-adsorbed secondary reagents are used to prevent interference.
Systematic Optimization of Antibody Concentrations
Empirical titration of both antibodies is non-negotiable for assay development. The goal is to identify the concentration that yields the highest signal-to-noise (S/N) ratio or signal-to-background (S/B) ratio, not merely the highest signal.
Experimental Protocol: Checkerboard Titration
Materials:
- Antigen of interest at a known, medium concentration (e.g., within expected sample range).
- Capture antibody (unlabeled).
- Detection antibody (enzyme-conjugated).
- ELISA plate (e.g., high-binding polystyrene).
- Coating buffer (e.g., 0.1 M Carbonate-Bicarbonate, pH 9.6).
- Blocking buffer (e.g., 1-5% BSA or casein in PBS).
- Wash buffer (e.g., PBS with 0.05% Tween 20).
- TMB substrate and stop solution (e.g., 1M H₂SO₄).
- Plate reader.
Methodology:
- Capture Antibody Coating: Prepare a 2D serial dilution of the capture antibody across the plate rows (e.g., from 10 µg/mL to 0.1 µg/mL). Coat overnight at 4°C.
- Blocking: Wash plate 3x. Add blocking buffer for 1-2 hours at room temperature (RT).
- Antigen Incubation: Wash 3x. Add a fixed, moderate concentration of antigen to all wells. Incubate 1-2 hours at RT.
- Detection Antibody Incubation: Wash 3x. Prepare a 2D serial dilution of the detection antibody down the plate columns. Incubate 1 hour at RT.
- Signal Development: Wash 3-5x. Add enzyme substrate. Incubate for a fixed, controlled time (e.g., 10-15 minutes). Stop the reaction.
- Analysis: Read absorbance. Plot signals and calculate S/N ratios for each combination.
Data Interpretation: The optimal pairing is the lowest concentration of each antibody that produces a maximal or near-maximal S/N ratio for the target antigen concentration. This minimizes reagent cost and background.
Table 1: Example Checkerboard Titration Results for a Hypothetical Cytokine Antigen (10 ng/mL)
| Capture Ab [µg/mL] | Detection Ab [ng/mL] | Mean Absorbance (450 nm) | Mean Background (No Ag) | Signal-to-Noise Ratio |
|---|---|---|---|---|
| 5.0 | 500 | 3.250 | 0.120 | 27.1 |
| 5.0 | 100 | 2.980 | 0.105 | 28.4 |
| 5.0 | 20 | 1.850 | 0.095 | 19.5 |
| 1.0 | 500 | 2.900 | 0.085 | 34.1 |
| 1.0 | 100 | 2.950 | 0.075 | 39.3 |
| 1.0 | 20 | 1.700 | 0.070 | 24.3 |
| 0.2 | 500 | 1.200 | 0.060 | 20.0 |
| 0.2 | 100 | 1.050 | 0.055 | 19.1 |
| 0.2 | 20 | 0.500 | 0.050 | 10.0 |
Conclusion: For this example, 1.0 µg/mL capture antibody and 100 ng/mL detection antibody provide the optimal combination (highlighted).
Critical Workflow and Relationship Diagrams
Title: Core Sandwich ELISA Experimental Workflow
Title: Antibody Optimization Decision Pathway
The Scientist's Toolkit: Research Reagent Solutions
Table 2: Essential Reagents for Sandwich ELISA Optimization
| Item | Function & Role in Optimization |
|---|---|
| Matched Antibody Pair | Pre-validated capture and detection antibodies targeting different epitopes. Foundation of assay specificity. |
| High-Binding ELISA Plates | Polystyrene plates with optimized surface chemistry for maximal antibody protein binding and consistency. |
| Precision Coating Buffer | (e.g., Carbonate-Bicarbonate, pH 9.6). Ensures efficient, stable passive adsorption of capture antibody. |
| Blocking Reagent (BSA/Casein) | Saturates remaining protein-binding sites to minimize non-specific background signal. |
| Wash Buffer with Surfactant | (e.g., PBS-Tween). Removes unbound reagents; critical for reducing background and improving precision. |
| Antigen Standard | Highly purified, quantitated target protein for generating the standard curve and optimization titrations. |
| Enzyme-Conjugated Detection Ab | Antibody linked to HRP or AP; concentration and lot consistency are critical for stable signal generation. |
| Chromogenic Substrate (TMB) | Stable, sensitive formulation for HRP. Generates measurable color change proportional to antigen. |
| Stop Solution | Acidic solution (e.g., Sulfuric Acid) to halt enzyme reaction at a fixed endpoint for accurate reading. |
| Microplate Reader | Spectrophotometer capable of measuring absorbance at specific wavelengths (e.g., 450 nm for TMB). |
Improving Coating Efficiency and Blocking Strategies to Reduce Non-Specific Binding
Within the framework of Enzyme-Linked Immunosorbent Assay (ELISA) research—encompassing direct, indirect, sandwich, and competitive formats—the critical pre-analytical steps of plate coating and blocking are paramount. These steps dictate the assay's sensitivity, specificity, and reproducibility. Non-specific binding (NSB) of assay components to the solid phase or detection antibodies generates background noise, obscuring specific signal detection. This technical guide provides an in-depth analysis of contemporary strategies to optimize coating efficiency and implement robust blocking protocols to minimize NSB, thereby enhancing overall assay performance for researchers and drug development professionals.
Fundamentals of Coating Efficiency
Coating efficiency refers to the effective immobilization of the capture molecule (antigen or antibody) onto the microplate well surface. Maximizing this efficiency ensures optimal ligand density for subsequent binding events.
Key Determinants:
- Coating Buffer: Carbonate-bicarbonate buffer (pH 9.6) is traditional, but recent studies indicate phosphate-buffered saline (PBS, pH 7.4) can be superior for certain proteins, preserving native conformation.
- Protein Concentration: Must be optimized to avoid monolayer saturation or sparse coverage.
- Incubation Time and Temperature: Overnight at 4°C is standard for passive adsorption; however, shorter incubations (1-3 hours) at 37°C can be effective with optimized conditions.
- Plate Chemistry: The choice of plate polymer (e.g., polystyrene, polyvinyl chloride) and surface treatment (e.g., high-binding, medium-binding, or specialty coatings like streptavidin) is foundational.
Table 1: Comparison of Common Coating Buffers and Parameters
| Coating Buffer | Typical pH | Optimal Use Case | Advantages | Disadvantages |
|---|---|---|---|---|
| Carbonate-Bicarbonate | 9.6 | Most antibodies, many antigens | Promotes passive adsorption, standard protocol | High pH may denature some antigens |
| Phosphate-Buffered Saline (PBS) | 7.4 | pH-sensitive antigens/antibodies | Maintains native protein conformation | Lower binding efficiency for some proteins |
| Tris-HCl | 8.5 | Alternative to carbonate | Good buffering capacity | Less commonly used |
| Recommended Concentration Range | 50-100 µg/mL for purified antibodies; 1-10 µg/mL for antigens. Must be empirically determined. | |||
| Recommended Incubation | Overnight (12-16 hrs) at 4°C or 1-3 hours at 37°C. 4°C minimizes evaporation and protein denaturation. |
Advanced Blocking Strategies to Mitigate NSB
Blocking involves incubating the coated plate with an inert protein or mixture to cover any remaining reactive sites on the plastic surface.
Evolution from Standard to Advanced Blockers: While Bovine Serum Albumin (BSA) and non-fat dry milk remain staples, their animal-derived nature can introduce batch variability and potential interferences. Advanced strategies focus on defined, synthetic, or engineered blockers.
Table 2: Efficacy of Blocking Agents Against Common NSB Sources
| Blocking Agent | Typical Conc. | Key Mechanism | Best For Reducing NSB From | Potential Drawbacks |
|---|---|---|---|---|
| BSA (Fraction V) | 1-5% (w/v) | Covers hydrophobic sites, charges | General use, charged interactions | May contain bovine Ig, causing interference |
| Non-Fat Dry Milk | 1-5% (w/v) | Complex mixture of proteins/caseins | General use, cost-effective | Contains biotin, phosphatases; high background in some systems |
| Fish Skin Gelatin | 0.5-2% (w/v) | Low sequence homology to mammalian proteins | Assays with mammalian samples, biotin systems | Viscosity can be high |
| Casein (Purified) | 1-2% (w/v) | Phosphoprotein, hydrophilic | Alkaline phosphatase detection systems | Can be difficult to solubilize |
| Synblock/Protein-Free Blockers | As per mfr. | Synthetic polymers | Highest specificity, no animal contaminants | Higher cost |
| Tween 20 (in blocker) | 0.05-0.1% (v/v) | Non-ionic detergent, disrupts hydrophobic interactions | Hydrophobic interactions, wash step essential | Can elute weakly adsorbed proteins if used in coating well |
Detailed Experimental Protocols
Protocol 1: Optimizing Coating Concentration via Checkerboard Titration
Objective: To empirically determine the optimal concentration of coating antibody and sample antigen for a sandwich ELISA. Materials: See "The Scientist's Toolkit" below. Procedure:
- Prepare serial dilutions of the capture antibody in coating buffer (e.g., 10, 5, 2.5, 1.25 µg/mL) across the rows of a high-binding 96-well plate.
- Coat plates (100 µL/well) overnight at 4°C.
- Wash plates 3x with PBS containing 0.05% Tween 20 (PBST).
- Block with 200 µL/well of chosen blocking buffer (e.g., 3% BSA in PBS) for 2 hours at RT.
- Wash 3x with PBST.
- Prepare serial dilutions of the target antigen (or sample) down the columns of the plate.
- Incubate antigen (100 µL/well) for 2 hours at RT.
- Wash 3x with PBST.
- Add optimal concentration of detection antibody (conjugated or biotinylated) for 1-2 hours at RT.
- Wash 3x with PBST. (If indirect, add enzyme-conjugated secondary antibody, incubate, wash).
- Add enzyme substrate (100 µL/well), incubate in the dark, and stop reaction.
- Measure absorbance. The optimal pair is the lowest concentration of coating antibody that yields a robust signal (e.g., OD > 1.0) with the target antigen and a minimal background in negative control wells.
Protocol 2: Evaluating Blocking Buffer Efficacy
Objective: To compare NSB reduction across different blocking agents. Procedure:
- Coat plates with a low, sub-optimal concentration of a representative antigen (to simulate residual binding sites).
- After washing, divide the plate and apply different blocking buffers (see Table 2) to separate sections. Include a "no block" control.
- Incubate for 1-2 hours at RT.
- Wash thoroughly.
- Add the detection antibody at a concentration 10-20% higher than the optimal working concentration (this stresses the system to reveal NSB).
- Proceed with standard wash, substrate, and detection steps.
- Compare the background signal (OD in wells with no antigen but with detection system) across blockers. The most effective blocker yields the lowest background while maintaining the specific signal in antigen-positive wells.
Visualizations
The Scientist's Toolkit
Table 3: Essential Research Reagent Solutions for Coating & Blocking Optimization
| Item | Function & Rationale | Example/Note |
|---|---|---|
| High-Binding Polystyrene Plates | Standard for passive adsorption of proteins via hydrophobic interactions. | Nunc MaxiSorp, Costar 3590. |
| Carbonate-Bicarbonate Buffer (pH 9.6) | Traditional high-pH coating buffer promoting protein adsorption. | 0.05 M or 0.1 M concentration. |
| Phosphate-Buffered Saline (PBS), pH 7.4 | Neutral coating buffer for pH-sensitive biomolecules. | Often contains 137 mM NaCl, 2.7 mM KCl. |
| BSA (Fraction V, IgG-Free) | High-purity blocking agent to minimize interference from bovine Igs. | Prepare as 1-5% solution in PBS or Tris. |
| Protein-Free Blocking Buffer | Synthetic polymer blocker eliminates animal-derived interferences. | Synblock, BlockACE, StartingBlock. |
| Tween 20 (Polysorbate 20) | Non-ionic detergent added to buffers to reduce hydrophobic NSB. | Use at 0.05-0.1% in wash/block buffers. |
| Casein (from Bovine Milk) | Phosphoprotein blocker, ideal for systems using alkaline phosphatase. | Often used in ready-to-use commercial buffers. |
| Plate Sealer | Prevents evaporation and contamination during incubations. | Adhesive or thermal sealing films. |
| Microplate Washer | Ensures consistent and thorough washing to reduce NSB. | Manual multichannel pipettes or automated systems. |
| ELISA Plate Reader | Measures absorbance for quantitative endpoint analysis. | Filter-based or monochromator-based readers. |
Addressing Hook Effects and Prozone Phenomena in Quantitative Assays
Hook effects and prozone phenomena represent critical, high-dose artifacts in quantitative immunoassays, including all ELISA formats (direct, indirect, sandwich, and competitive). They manifest as a false decrease in the reported analyte concentration when the actual concentration is extremely high, leading to a characteristic "hook" in the calibration curve. This guide details their mechanisms, detection, and mitigation within the context of modern ELISA research and drug development.
Underlying Mechanisms and Signaling Pathways
The fundamental cause lies in the saturation of assay components at non-equilibrium conditions or extreme analyte-to-reagent ratios.
2.1 Sandwich Assay Hook Effect In a standard two-site immunometric (sandwich) assay, excess analyte saturates both the capture and detection antibodies, preventing the formation of the necessary "sandwich" complex. Excess unbound analyte competes with the captured analyte for the labeled detection antibody, leading to decreased signal.
2.2 Competitive Assay & Agglutination Prozone In competitive ELISA, excess analyte can paradoxically increase signal by saturating the capture reagent, leaving fewer sites to bind the competing labeled analyte. In agglutination tests (e.g., immunoturbidimetry), antibody excess (prozone) prevents lattice formation, reducing agglutination and signal.
Detection and Diagnostic Protocols
3.1 Protocol for Suspect Sample Re-Testing Objective: Confirm or rule out a hook effect. Materials: Suspect sample, assay buffer, appropriate pipettes and tubes. Procedure: 1. Prepare a serial dilution (e.g., 1:10, 1:100, 1:1000) of the suspect sample using the recommended assay diluent. 2. Re-assay the diluted samples alongside the original undiluted sample. 3. Plot measured concentration vs. dilution factor. Interpretation: If the measured analyte concentration increases proportionally with dilution (e.g., a 1:10 dilution yields a result ~10x higher than the original), a hook effect is confirmed.
3.2 Protocol for Assay Dynamic Range Verification Objective: Empirically define the hook point for a given assay. Materials: High-concentration analyte standard, full assay kit. Procedure: 1. Prepare a standard curve extending far beyond the claimed upper limit of detection (ULOQ), using spiked matrix. 2. Run the assay in duplicate. 3. Plot signal (OD, RLU, etc.) against theoretical analyte concentration on a log scale. Interpretation: The concentration at which the signal curve visibly plateaus and then decreases is the "hook point." The reliable dynamic range is below this point.
The following table summarizes indicative hook point concentrations for common analytes across different platforms, based on current literature.
Table 1: Hook Point Concentrations for Representative Analytes
| Analyte | Assay Type | Typical Hook Point Concentration | Clinical/Experimental Relevance |
|---|---|---|---|
| Procalcitonin | Immunoassay (Sandwich) | > 500 ng/mL | Severe sepsis, medullary thyroid cancer |
| PSA | Chemiluminescent IA | > 1000 ng/mL | Prostate cancer |
| hCG | Sandwich ELISA | > 400,000 mIU/mL | Choriocarcinoma, hydatidiform mole |
| Rheumatoid Factor | Turbidimetry | High antibody excess | Autoimmune diseases |
| CRP | Latex-enhanced IA | > 500 mg/L | Severe inflammation, infection |
| SARS-CoV-2 Nucleocapsid | Sandwich ELISA | > 50 ng/mL (recombinant) | In vitro assay characterization |
Mitigation Strategies and Experimental Design
5.1 Sample Pre-Dilution Protocol Standard Operating Procedure: 1. For samples with unknown concentration, perform an initial screening at two dilutions (e.g., 1:10 and 1:100). 2. If the higher dilution yields a significantly higher result (e.g., >150% of the lower dilution value), repeat testing with a further dilution series. 3. Report the result from the dilution that falls mid-range within the assay's validated linear dynamic range.
5.2 Assay Optimization to Extend Dynamic Range Protocol for Reagent Titration: 1. Titrate Capture Antibody: Coat plates with varying concentrations of capture antibody (e.g., 0.5, 1, 2, 5 µg/mL). 2. Titrate Detection Antibody: Similarly, test a range of detection antibody concentrations. 3. Challenge with High Standard: Run an extended high-concentration standard curve with each combination. 4. Analyze: Identify the reagent combination that pushes the hook point to the highest concentration while maintaining a low limit of detection.
The Scientist's Toolkit: Key Research Reagent Solutions
| Item | Function | Example/Notes |
|---|---|---|
| High-Affinity Monoclonal Antibody Pair | Minimizes dissociation, pushes hook point higher. | Essential for sandwich assays; affinity constants (Kd) < 10^-9 M preferred. |
| Assay Diluent with Blockers | Reduces non-specific binding in diluted samples. | Contains inert proteins (BSA, casein), surfactants (Tween-20). |
| Heterophilic Blocking Reagents | Prevents interference from human anti-animal antibodies. | Used in patient sample testing to avoid false hooks. |
| Matrix-Matched Calibrators | Provides accurate calibration in the sample's milieu. | Critical for serum/plasma assays to control for matrix effects. |
| Signal Amplification System | Increases assay sensitivity without increasing hook risk. | Enzymatic (HRP/ALP), fluorescent (Eu3+), or polymeric (poly-HRP) labels. |
Data Analysis and Curve Fitting
A 5-parameter logistic (5PL) curve fit is superior to 4PL for characterizing the asymmetric calibration curves that can indicate an approaching hook effect.
Table 2: Comparison of Curve-Fitting Models for Hook-Prone Data
| Model | Formula (Simplified) | Advantages | Disadvantages for Hook Effect |
|---|---|---|---|
| 4-Parameter Logistic (4PL) | y = d + (a-d)/(1+(x/c)^b) | Robust, standard. | Symmetric; cannot model high-dose hook downturn. |
| 5-Parameter Logistic (5PL) | y = d + (a-d)/(1+(x/c)^b)^g | Asymmetry parameter (g) can model downturn. | More complex, requires more data points. |
Proactive identification and management of hook effects are non-negotiable for assay integrity in research and clinical development. Integrating routine dilution protocols, optimizing reagent stoichiometry, and employing appropriate data analysis models are essential practices. Within the broader ELISA methodology thesis, understanding this phenomenon underscores the necessity of rigorous assay characterization across the entire potential concentration spectrum to avoid critical misinterpretations of quantitative data.
Introduction Within the comprehensive framework of Enzyme-Linked Immunosorbent Assay (ELISA) methodologies—including direct, indirect, sandwich, and competitive formats—the twin pillars of sensitivity (the lowest detectable concentration) and dynamic range (the span between the lowest and highest quantifiable concentrations) are paramount. This technical guide details actionable strategies for assay refinement, grounded in current research and best practices, to push these performance boundaries for research and drug development.
Core Refinement Strategies
Signal Generation and Amplification The cornerstone of enhancing sensitivity is amplifying the detectable signal per unit of analyte. Traditional enzyme-substrate systems (e.g., HRP/TMB) have limits. Advanced techniques include:
- Tyramide Signal Amplification (TSA): Utilizes HRP to catalyze the deposition of numerous labeled tyramide molecules at the site of the primary antibody, leading to a 10-100x signal increase.
- Enzyme-Labeled Fluorescent (ELF) Substrates: Produce an intensely fluorescent, precipitable product at the reaction site, enabling both high sensitivity and spatial resolution.
- Enhanced Chemiluminescence: Optimization of luminol-based substrates with enhancers like phenols can increase light output and duration, improving the signal-to-noise ratio.
Background Reduction Sensitivity is defined by the signal-to-noise ratio. Reducing background is as critical as amplifying signal.
- Blocking Optimization: Moving beyond standard BSA or casein to proprietary, polymer-based blocking buffers can reduce non-specific binding more effectively.
- Wash Stringency: Increasing ionic strength (e.g., with 500-600 mM NaCl) or adding mild detergents (e.g., 0.05% Tween-20) in wash buffers disrupts low-affinity interactions.
- Antibody Cross-Absorption: Using secondary antibodies pre-adsorbed against sera from multiple species minimizes cross-reactivity in complex samples.
Reagent Optimization and Affinity Maturation The affinity of the core biorecognition elements directly dictates both sensitivity and assay range.
- Antibody Pair Screening (Sandwich ELISA): Systematic screening of multiple capture and detection antibody combinations is essential to identify pairs with high synergy, affinity, and minimal cross-reactivity.
- Recombinant High-Affinity Binders: Utilizing recombinant antibodies (e.g., scFvs, nanobodies) or alternative scaffolds engineered for picomolar to femtomolar affinities can dramatically lower detection limits.
- Labeling Efficiency: Optimizing the enzyme-to-antibody ratio in conjugation protocols ensures maximal activity without compromising immunoreactivity.
Quantitative Impact of Refinement Strategies
Table 1: Comparative Impact of Assay Refinement Techniques on Performance Parameters
| Refinement Technique | Typical Sensitivity Gain (vs. Standard) | Impact on Dynamic Range | Key Consideration |
|---|---|---|---|
| TSA Amplification | 10 - 100 fold | May compress upper limit | Can increase background; requires optimization. |
| Enhanced Chemiluminescence | 5 - 20 fold | Can extend upper limit | Requires luminometer. |
| High-Affinity Recombinant Ab | 5 - 50 fold | Often significantly extends both | Cost and availability. |
| Polymer Blocking Buffers | 2 - 5 fold (via noise reduction) | Minimal direct effect | Must be compatible with antibody pairs. |
| Wash Stringency Optimization | 2 - 10 fold (via noise reduction) | Can improve linearity | Risk of eluting low-affinity specific signal. |
Experimental Protocol: Tyramide Signal Amplification (TSA) for ELISA
Objective: To amplify HRP-derived signal in a sandwich ELISA for ultra-sensitive detection of a target cytokine.
Materials: See "The Scientist's Toolkit" below. Procedure:
- Standard Sandwich ELISA Steps: Perform the assay through to the application of the HRP-conjugated detection antibody and subsequent wash.
- TSA Reaction Preparation: Dilute the Tyramide-fluorophore or -biotin conjugate 1:100 in the supplied amplification buffer immediately before use.
- Amplification: Add the prepared tyramide working solution to each well (e.g., 100 µL/well). Incubate for 5-10 minutes at room temperature, protected from light.
- Reaction Termination: Remove the solution and wash the plate vigorously 4-6 times with wash buffer.
- Signal Development (if using tyramide-biotin): Add Streptavidin-HRP (1:5000, 100 µL/well), incubate 30 min, wash, then add fluorogenic or chemiluminescent substrate. For tyramide-fluorophore, read fluorescence directly.
- Detection: Measure fluorescence or chemiluminescence with a plate reader.
Visualization of Key Concepts
TSA Amplification Workflow for ELISA
Strategic Pillars of Assay Refinement
The Scientist's Toolkit
Table 2: Essential Research Reagent Solutions for High-Performance ELISA Refinement
| Reagent / Material | Function / Purpose |
|---|---|
| High-Affinity Matched Antibody Pair | Provides the foundational specificity and affinity; critical for sandwich assay sensitivity and range. |
| Tyramide Signal Amplification (TSA) Kit | Contains optimized tyramide conjugates and buffer for robust, reproducible signal amplification. |
| Polymer-Based Blocking Buffer | Superiorly blocks non-specific binding sites on the plate and sample matrix, lowering background. |
| Recombinant Protein Calibrant | Provides highly accurate, consistent standard curves free of serum or carrier protein interference. |
| Stable, Low-Noise Chemiluminescent Substrate | Generates a bright, prolonged signal for detection with wide dynamic range. |
| Low-Binding, High-Protein-Binding Plates | Maximizes antibody coating efficiency while minimizing passive adsorption of reagents. |
| Streptavidin Conjugates (HRP/Fluorescent) | Essential for use with biotinylated detection antibodies or biotin-tyramide amplification. |
Best Practices for Sample Preparation and Handling to Prevent Interference
Within the comprehensive framework of ELISA methodologies—encompassing direct, indirect, sandwich, and competitive formats—the integrity of the final result is inextricably linked to pre-analytical processes. Sample preparation and handling constitute the most critical, yet often most variable, phase in immunoassay workflows. Improper techniques can introduce interference, leading to false positives, false negatives, and compromised data reproducibility. This guide details evidence-based practices to mitigate common interferents such as hemolysis, lipemia, cross-reactivity, matrix effects, and analyte degradation.
Sample Collection and Anticoagulant Use
The choice of collection tube and anticoagulant must align with the assay's requirements. Heparin, EDTA, and citrate can interfere with binding events if not appropriately considered.
Table 1: Common Anticoagulants and Their Potential Interference in ELISA
| Anticoagulant | Typical Use | Potential Interference Mechanism | Recommended Mitigation |
|---|---|---|---|
| Heparin | Plasma chemistry | Binds to proteins, can inhibit antigen-antibody interactions | Use serum or check assay validation for heparin tolerance. Avoid for kinase targets. |
| K2/K3 EDTA | Plasma, immunology | Chelates divalent cations (e.g., Mg²⁺, Ca²⁺); can disrupt enzyme conjugates. | Use validated assays. Do not use for alkaline phosphatase (AP)-based detection. |
| Sodium Citrate | Coagulation studies | Dilution effect, alters ionic strength. | Account for dilution factor (usually 1:9) in concentration calculations. |
| Serum (No anticoagulant) | Broad serology | Fibrin clot formation can trap analyte. | Ensure complete clot formation (30 min, RT) and clear centrifugation. |
Pre-Analytical Handling: Time, Temperature, and Cycles
Analyte stability dictates handling protocols. A live search of recent literature underscores the impact of repeated freeze-thaw cycles on biomarker integrity.
Table 2: Impact of Freeze-Thaw Cycles on Analyte Recovery (%)
| Analyte Type | 1 Cycle | 2 Cycles | 3 Cycles | 4 Cycles | Recommended Max |
|---|---|---|---|---|---|
| Cytokines (e.g., IL-6) | 98-102% | 95-98% | 85-92% | 75-85% | 2 cycles |
| Phosphoproteins | 95% | 80% | 65% | <50% | 1 cycle (aliquot!) |
| Large Proteins (e.g., IgM) | 100% | 98% | 96% | 90% | 3 cycles |
Protocol: Establishing Sample Stability
- Aliquot Fresh Sample: Divide a homogeneous sample into multiple low-binding microtubes.
- Create Stability Cohorts: Process some aliquots immediately (baseline). Subject others to defined conditions (e.g., 24h at 4°C, RT, or repeated freeze-thaw between -80°C and RT).
- Parallel Assay: Analyze all cohorts in the same ELISA plate to minimize inter-assay variance.
- Calculate Recovery: (Mean concentration of stressed sample / Mean concentration of baseline) x 100%. Recovery <85% indicates instability.
Addressing Matrix Effects
Matrix effects occur when sample components differentially modulate the immunoassay reaction compared to the standard diluent.
Protocol: Standard Diluent Spike-and-Recovery Experiment
- Prepare Spiked Samples: Spike a known amount of the purified target analyte into the sample matrix (e.g., serum, plasma, tissue homogenate) and into the assay's standard diluent buffer.
- Prepare Controls: Include unspiked matrix and diluent as background controls.
- Run ELISA: Measure the concentration of the spike in both matrix and diluent.
- Calculate Recovery: % Recovery = [([Spiked matrix] - [Unspiked matrix]) / [Spiked diluent]] x 100%.
- Interpretation: Acceptable recovery is typically 80-120%. Low recovery suggests inhibitory matrix effects; high recovery suggests interference causing overestimation.
Removal of Common Interferents
For Lipemic/Hemolyzed/Icteric Samples:
- Lipemia: Clarify by ultracentrifugation (100,000 x g, 30 min, 4°C) or use commercially available lipid removal reagents.
- Hemolysis: Remove hemoglobin via filtration (0.22 µm after centrifugation) or use specific immunoabsorption columns. Avoid hemolyzed samples for assays where hemoglobin is a known interferent (e.g., many HRP-based systems).
- Bilirubin: Consider sample dilution if validated, or use bilirubin-oxidizing agents.
For Heterophilic Antibody Interference:
- Add proprietary heterophilic blocking reagent (HBR) or normal IgG (from the same species as the detection antibody) to the sample diluent.
- Use assay formats with F(ab')2 fragments to minimize Fc receptor interactions.
- Re-test with a different assay format or manufacturer.
The Scientist's Toolkit: Key Research Reagent Solutions
| Item | Function & Rationale |
|---|---|
| Protease Inhibitor Cocktails | Prevents degradation of protein analytes during sample collection and storage by inhibiting serine, cysteine, metallo-, and other proteases. |
| Phosphatase Inhibitors | Critical for preserving phosphorylation states in phospho-protein ELISAs (e.g., Sandwich ELISA for p-ERK). |
| Heterophilic Blocking Reagent | Blocks human anti-mouse antibodies (HAMA) and other heterophilic antibodies that can cause false elevation or suppression of signal. |
| Low-Protein-Binding Tubes & Tips | Minimizes adsorptive loss of low-abundance proteins and peptides to plastic surfaces. |
| Matrix-Matched Calibrators | Calibration standards prepared in a matrix similar to the sample (e.g., charcoal-stripped serum) to correct for background and matrix effects. |
| Sample Dilution Buffer (with blockers) | Optimized buffer containing irrelevant proteins (e.g., BSA, casein) to reduce non-specific binding when samples require dilution. |
Workflow and Pathway Visualizations
Title: Sample Workflow with Key Interference Points
Title: Decision Pathway for Interference Troubleshooting
ELISA Validation & Selection: Comparing Formats for Your Research Needs
Within the rigorous framework of ELISA method development—encompassing direct, indirect, sandwich, and competitive formats—the validation of analytical performance is paramount. This whitepaper provides an in-depth technical guide to the four core validation parameters: specificity, sensitivity, precision, and accuracy. These parameters form the cornerstone of method reliability for researchers, scientists, and drug development professionals, ensuring that ELISA data is robust, reproducible, and fit for purpose in both research and regulatory contexts.
Specificity
Specificity is the ability of an assay to measure solely the analyte of interest in the presence of other potentially cross-reactive components in the sample matrix.
Methodological Evaluation:
- Cross-Reactivity Studies: Test structurally similar compounds (e.g., metabolites, isoforms, related proteins) at high concentrations. Calculate cross-reactivity as:
(Concentration of Analyte / Concentration of Interferent) x 100%, where both yield the same response. - Interference Studies: Spike the analyte into various biologically relevant matrices (e.g., serum, plasma, tissue homogenates) and compare the measured concentration to that in a pure buffer.
- Parallelism Assessment: Perform serial dilutions of a sample with a high native analyte concentration and compare the dose-response curve to the standard curve prepared in buffer. Parallel curves indicate minimal matrix interference.
Research Reagent Solutions for Specificity Testing:
| Reagent/Material | Function in Specificity Evaluation |
|---|---|
| High-Purity Analyte Standard | Serves as the reference for the true signal. |
| Cross-Reactive Analogue Compounds | Used to challenge the antibody's binding fidelity. |
| Interference Check Solutions | Commercially available kits containing common interferents like bilirubin, hemoglobin, lipids. |
| Matrix-Blanked Standards | Standards prepared in the analyte-depleted or surrogate matrix to build a calibration curve. |
| Monoclonal Antibodies (for sandwich ELISA) | High specificity for a single epitope reduces cross-reactivity risks. |
Sensitivity
Sensitivity defines the lowest amount of analyte that can be reliably distinguished from zero. It is quantitatively expressed as the Limit of Detection (LoD) and the Limit of Quantification (LoQ).
Experimental Protocol for LoD/LoQ Determination:
- Prepare at least 16-20 replicate samples of a zero standard (blank matrix) and a low-concentration sample near the expected LoD.
- Run all replicates in a single assay (for LoD) or across multiple assays (for LoQ).
- Calculate LoD: Typically,
LoD = Mean_blank + 3*(SD_blank), where SD_blank is the standard deviation of the blank measurements. - Calculate LoQ: Defined by acceptable precision and accuracy (e.g., CV ≤20%, bias ±20%).
LoQ = Mean_blank + 10*(SD_blank)or the lowest level on the standard curve that meets the precision/accuracy criteria.
Precision
Precision is the measure of assay reproducibility, describing the closeness of agreement between a series of measurements from multiple sampling. It is stratified into three levels.
Experimental Protocols:
- Repeatability (Intra-assay Precision): Assessed by analyzing at least 3 concentration levels (low, medium, high) with a minimum of 6-10 replicates within the same assay run.
- Intermediate Precision (Inter-assay Precision): Assessed by analyzing the same 3 concentration levels over different days, with different analysts, or using different equipment. Minimum of 3 runs.
- Reproducibility: Assessed in a collaborative study across different laboratories.
Data are expressed as Coefficient of Variation (CV%): (Standard Deviation / Mean) x 100%.
Accuracy
Accuracy reflects the closeness of agreement between the measured value and the analyte's true value or an accepted reference value. It is evaluated through recovery and linearity of dilution studies.
Experimental Protocols:
- Spike-and-Recovery: Spike known amounts of analyte into the relevant sample matrix at 3-5 concentration levels. Calculate percent recovery:
(Measured Concentration / Expected Concentration) x 100%. - Linearity of Dilution: Serially dilute a sample with a high endogenous analyte concentration and assess if the measured values are proportional to the dilution factor.
Table 1: Summary of Precision and Accuracy Performance for a Hypothetical Sandwich ELISA
| Parameter | Level (Concentration) | Result (CV% or % Recovery) | Acceptance Criterion |
|---|---|---|---|
| Repeatability | Low (25 pg/mL) | 5.2% CV | ≤15% CV |
| Medium (200 pg/mL) | 3.8% CV | ≤12% CV | |
| High (800 pg/mL) | 4.1% CV | ≤12% CV | |
| Intermediate Precision | Low (25 pg/mL) | 8.7% CV | ≤20% CV |
| Medium (200 pg/mL) | 6.5% CV | ≤15% CV | |
| High (800 pg/mL) | 7.1% CV | ≤15% CV | |
| Accuracy (Recovery) | Low (25 pg/mL) | 102% | 85-115% |
| Medium (200 pg/mL) | 98% | 90-110% | |
| High (800 pg/mL) | 96% | 90-110% |
Table 2: Sensitivity and Specificity Parameters
| Parameter | Method of Determination | Result |
|---|---|---|
| Limit of Detection (LoD) | Mean(blank) + 3*SD | 5.2 pg/mL |
| Limit of Quantification (LoQ) | Lowest calibrator with CV≤20%, Bias±20% | 15.6 pg/mL |
| Cross-Reactivity (Analogue X) | (Conc. Analyte/Conc. Analogue)*100% | <0.1% |
| Parallelism (High Patient Sample) | % Recovery over serial dilution range | 92-107% |
Visualizations
Title: ELISA Validation Parameter Interdependence
Title: LoD and LoQ Determination Workflow
Title: ELISA Type Selection Decision Tree
Within the comprehensive landscape of Enzyme-Linked Immunosorbent Assay (ELISA) methodologies, selecting the appropriate format—direct, indirect, sandwich, or competitive—is a critical determinant of experimental success. This in-depth guide provides a technical framework for researchers, scientists, and drug development professionals to make informed decisions based on assay requirements, analyte properties, and desired outcomes. Each format offers distinct advantages and limitations in sensitivity, specificity, multiplexing capability, time, and cost.
Core Principles and Comparative Analysis
The fundamental difference between ELISA formats lies in the sequence and type of binding events used to detect the target analyte (antigen).
Diagram Title: Logical Decision Tree for ELISA Format Selection
Quantitative Comparison of ELISA Formats
The table below summarizes the key operational and performance characteristics of the four primary ELISA formats, based on current literature and product manuals.
Table 1: Head-to-Head Comparison of ELISA Formats
| Parameter | Direct ELISA | Indirect ELISA | Sandwich ELISA | Competitive ELISA |
|---|---|---|---|---|
| Primary Ab Conjugation | Enzyme-labeled | Unlabeled | Unlabeled (capture) | Unlabeled (in solution) |
| Secondary Ab | Not required | Enzyme-labeled | Enzyme-labeled (detection) | Enzyme-labeled |
| Key Steps | 1. Antigen immobilization2. Labeled primary Ab incubation3. Detection | 1. Antigen immobilization2. Primary Ab incubation3. Labeled secondary Ab incubation4. Detection | 1. Capture Ab immobilization2. Antigen incubation3. Detection Ab incubation4. Labeled secondary Ab* incubation5. Detection | 1. Reference Ag immobilization2. Co-incubation: Sample Ag + Labeled Ab3. Detection |
| Assay Time | Short (~2-3 hrs) | Medium (~3-4 hrs) | Long (~4-5 hrs) | Medium (~3-4 hrs) |
| Sensitivity | Low to Moderate | High (Signal Amplification) | Very High | High (for small analytes) |
| Specificity | Moderate | High | Very High (Two Ab epitopes) | High |
| Multiplexing Potential | Low | Moderate | High (with different capture spots) | Low |
| Background Signal Risk | Low | Moderate (Cross-reactivity) | Low | Moderate |
| Cost & Reagent Demand | Low (Fewer steps/reagents) | Moderate (Extra Ab) | High (Two specific Abs) | Moderate |
| Typical Application | Quick screening, known high-abundance targets | Broad research applications, immunogenicity testing | Quantitative detection of complex proteins (cytokines, biomarkers) | Small molecules, hormones, drugs, when only one Ab is available |
Note: Detection antibody in sandwich ELISA may be directly labeled, converting it to a "direct sandwich" and reducing steps.
Detailed Methodologies & Protocols
Direct ELISA Protocol
Principle: The immobilized antigen is detected directly by an enzyme-conjugated primary antibody. Detailed Protocol:
- Coating: Dilute purified antigen in carbonate-bicarbonate coating buffer (pH 9.6) to 1-10 µg/mL. Add 100 µL/well to a polystyrene microplate. Incubate overnight at 4°C or 1-2 hours at 37°C.
- Washing: Wash plate 3x with 300 µL/well of PBS containing 0.05% Tween-20 (PBST).
- Blocking: Add 200-300 µL/well of blocking buffer (e.g., 1-5% BSA or non-fat dry milk in PBST). Incubate for 1-2 hours at room temperature (RT). Wash 3x with PBST.
- Primary Antibody Incubation: Add 100 µL/well of enzyme-conjugated primary antibody (diluted in blocking buffer as optimized). Incubate for 1-2 hours at RT. Wash 3-5x thoroughly with PBST.
- Detection: Add 100 µL/well of substrate solution (e.g., TMB for HRP, pNPP for AP). Incubate in the dark for 10-30 minutes.
- Stop & Read: Add 50-100 µL/well of stop solution (e.g., 1M H2SO4 for TMB). Immediately measure absorbance at the appropriate wavelength (e.g., 450nm for TMB).
Indirect ELISA Protocol
Principle: The immobilized antigen is bound by an unlabeled primary antibody, which is then detected by an enzyme-conjugated secondary antibody. Detailed Protocol (Steps 1-3 identical to Direct ELISA):
- Coating, Washing, and Blocking: As per Direct ELISA protocol.
- Primary Antibody Incubation: Add 100 µL/well of unlabeled primary antibody (diluted in blocking buffer). Incubate 1-2 hours at RT. Wash 3-5x with PBST.
- Secondary Antibody Incubation: Add 100 µL/well of enzyme-conjugated secondary antibody (e.g., anti-species IgG-HRP, diluted in blocking buffer). Incubate for 1-2 hours at RT in the dark. Wash 3-5x thoroughly with PBST.
- Detection & Read: As per Direct ELISA steps 5-6.
Sandwich ELISA Protocol
Principle: The analyte is captured by an immobilized antibody and detected by a second, enzyme-labeled antibody targeting a different epitope. Detailed Protocol:
- Capture Antibody Coating: Dilute capture antibody in coating buffer to 2-10 µg/mL. Coat plate (100 µL/well), incubate overnight at 4°C. Wash and block as before.
- Antigen Incubation: Add 100 µL/well of sample or standard (diluted in blocking buffer). Incubate 2 hours at RT or overnight at 4°C. Wash 3-5x.
- Detection Antibody Incubation: Add 100 µL/well of biotinylated or enzyme-conjugated detection antibody (diluted in blocking buffer). Incubate 1-2 hours at RT. Wash 3-5x.
- Optional Signal Amplification (if using biotin): Add Streptavidin-HRP conjugate. Incubate 30-45 min. Wash thoroughly.
- Detection & Read: As per previous protocols.
Diagram Title: Sandwich ELISA Step-by-Step Workflow
Competitive ELISA Protocol
Principle: Sample antigen and immobilized reference antigen compete for binding to a limited amount of enzyme-labeled antibody. Signal is inversely proportional to analyte concentration. Detailed Protocol (Two Common Variations):
A. Antibody Competition (Most Common):
- Antigen Coating: Coat plate with a known amount of reference antigen (or protein conjugate for haptens) overnight. Wash and block.
- Competition: Pre-mix a constant, limiting amount of enzyme-labeled antibody with serially diluted sample/standard. Add this mixture to the coated wells.
- Incubation & Wash: Incubate 1-2 hours at RT. The labeled antibody binds either to the immobilized antigen (low signal) or the sample antigen (no plate binding, high signal). Wash to remove unbound complexes.
- Detection & Read: Add substrate. A high signal indicates low sample analyte concentration (more labeled Ab bound to plate). Generate a standard curve with decreasing signal for increasing standard concentration.
B. Antigen Competition:
- Antibody Coating: Coat plate with a capture antibody. Wash and block.
- Competition: Add a pre-mixed solution containing sample antigen and a constant amount of enzyme-labeled antigen (competitor) to the wells.
- Incubation & Wash: Incubate and wash. Labeled and unlabeled antigen compete for limited capture sites.
- Detection & Read: As above. A low signal indicates high sample analyte concentration.
Diagram Title: Competitive ELISA Antibody Competition Principle
The Scientist's Toolkit: Essential Research Reagent Solutions
Table 2: Key Reagents and Materials for ELISA
| Reagent/Material | Function & Critical Consideration |
|---|---|
| Polystyrene Microplates | Solid phase for protein adsorption. High-binding plates (e.g., Costar, Nunc) are standard. For special cases (e.g., phosphorylated proteins), use medium-binding plates to preserve epitopes. |
| Coating Buffer | Typically carbonate-bicarbonate buffer (pH 9.6) for optimal passive adsorption of proteins/antibodies via hydrophobic interactions. |
| Wash Buffer (PBST) | Phosphate-Buffered Saline (PBS) with 0.05-0.1% Tween-20. Removes unbound reagents, reduces non-specific binding. Tween concentration is critical for stringency. |
| Blocking Buffers | 1-5% BSA, casein, or non-fat dry milk in PBST. Saturates uncovered plastic surface to prevent non-specific adsorption of detection reagents. Choice affects background and compatibility (e.g., avoid biotin-rich blockers with streptavidin systems). |
| Primary Antibodies | Must be validated for ELISA. For sandwich format, a matched pair recognizing non-overlapping epitopes is essential. Monoclonal antibodies offer higher specificity. |
| Enzyme Conjugates | Horseradish Peroxidase (HRP) or Alkaline Phosphatase (AP) linked to antibodies or streptavidin. HRP is more common; avoid sodium azide in buffers as it inhibits HRP. |
| Detection Substrates | TMB (colorimetric, HRP), pNPP (colorimetric, AP), or chemiluminescent (e.g., luminol/ECL). Choice depends on required sensitivity and available instrumentation. |
| Stop Solution | Acid (e.g., 1M H2SO4 for TMB) to halt enzyme reaction and stabilize final colorimetric signal for reading. |
| Microplate Reader | Spectrophotometer capable of reading absorbance at specific wavelengths (e.g., 450nm for TMB, 405nm for pNPP). Filter-based readers are standard. |
Within the comprehensive framework of ELISA method overview—encompassing direct, indirect, sandwich, and competitive formats—a critical evaluation of performance metrics is paramount for researchers, scientists, and drug development professionals. This technical guide provides an in-depth analysis of the core analytical parameters of speed, cost, sensitivity, and specificity across ELISA variants, synthesizing current data and protocols to inform experimental design and diagnostic application.
Core Performance Metrics: Comparative Analysis
The following tables summarize quantitative data for key ELISA formats, based on aggregated findings from recent literature and technical specifications.
Table 1: Comparative Analysis of ELISA Formats by Core Metrics
| ELISA Format | Speed (Time to Result) | Approx. Cost per Sample (Reagents) | Typical Sensitivity (Detection Limit) | Typical Specificity |
|---|---|---|---|---|
| Direct ELISA | ~2-3 hours | Low ($1 - $3) | Moderate (ng-pg range) | Lower (Primary Ab cross-reactivity) |
| Indirect ELISA | ~3-4 hours | Low-Moderate ($2 - $5) | Moderate-High (ng-pg range) | High (Amplified signal) |
| Sandwich ELISA | ~4-5 hours | High ($5 - $15) | High (pg-fg range) | Very High (Two Ab epitopes) |
| Competitive ELISA | ~3-4 hours | Moderate ($4 - $10) | Variable (Depends on standard) | High (For small antigens) |
Table 2: Impact of Detection System on Sensitivity & Speed
| Detection System | Time Added | Sensitivity Gain | Cost Impact |
|---|---|---|---|
| Chromogenic (HRP/AP) | Minimal (30 min) | Baseline | Low |
| Chemiluminescent | Minimal (30 min) | 10-100x increase | Moderate |
| Fluorescent (e.g., Fluorophores) | Minimal (30 min) | High (Wide dynamic range) | High |
Detailed Methodologies for Key Experiments
Protocol 1: Standard Sandwich ELISA for Cytokine Quantification
- Objective: Quantify TNF-α concentration in cell culture supernatant with high sensitivity and specificity.
- Materials: 96-well microplate coated with capture anti-TNF-α, blocking buffer (1% BSA in PBS), samples and recombinant TNF-α standard, biotinylated detection anti-TNF-α, streptavidin-HRP conjugate, TMB substrate, stop solution (1M H₂SO₄), wash buffer (PBS with 0.05% Tween-20).
- Procedure:
- Coat plate with capture antibody (100 µL/well, 1-10 µg/mL in coating buffer). Incubate overnight at 4°C.
- Aspirate and block with 200 µL blocking buffer for 1-2 hours at room temperature (RT).
- Wash plate 3x with wash buffer.
- Add 100 µL of standards and samples per well. Incubate 2 hours at RT or overnight at 4°C.
- Wash 3x. Add 100 µL of biotinylated detection antibody (optimal dilution in blocking buffer). Incubate 1-2 hours at RT.
- Wash 3x. Add 100 µL of streptavidin-HRP (1:5000-1:20000 dilution). Incubate 30-45 minutes at RT in the dark.
- Wash 3x. Add 100 µL of TMB substrate. Incubate 5-30 minutes until color develops.
- Stop reaction with 50 µL stop solution. Read absorbance at 450 nm immediately.
Protocol 2: Competitive ELISA for Small Molecule (e.g., Mycotoxin) Detection
- Objective: Determine concentration of a small molecule antigen (e.g., Aflatoxin B1) by competition with a labeled analog.
- Materials: Microplate coated with antigen conjugate (e.g., Aflatoxin B1-BSA), blocking buffer, primary antibody specific to the target, sample/standard, HRP-labeled secondary antibody (for indirect competition) or antigen-HRP conjugate (for direct competition), substrate, stop solution.
- Procedure (Direct Competition):
- Coat and block plate as in Protocol 1.
- Pre-mix a constant concentration of antigen-HRP conjugate with varying concentrations of sample/standard.
- Add the mixture to the washed plate (100 µL/well). Simultaneously, add the primary antibody (if using indirect format). Incubate 1 hour at RT.
- Wash plate 3-5x thoroughly.
- Add substrate, incubate, stop, and read as in Protocol 1. Note: Signal is inversely proportional to target concentration in the sample.
Visualizing ELISA Methodologies and Relationships
Title: ELISA Format Selection and Metric Analysis Flow
Title: Sandwich ELISA Experimental Workflow
Title: Core ELISA Metrics and Their Determining Factors
The Scientist's Toolkit: Key Research Reagent Solutions
| Reagent / Material | Primary Function in ELISA |
|---|---|
| High-Affinity Matched Antibody Pair | Critical for sandwich ELISA; defines specificity, sensitivity, and dynamic range. |
| Recombinant Pure Antigen Standard | Essential for generating a standard curve for accurate quantitative analysis. |
| Low-Autofluorescence Microplates | Maximizes signal-to-noise ratio, especially critical for fluorescent detection. |
| Stable Chemiluminescent Substrate | Provides high signal amplification for ultra-sensitive detection. |
| High-Sensitivity Streptavidin-PolyHRP Conjugate | Amplifies detection signal significantly versus monomeric enzyme conjugates. |
| Blocking Buffer (Protein-based, e.g., BSA, Casein) | Reduces non-specific binding to improve assay specificity and background. |
| Precision Plate Washer | Ensures consistent and thorough washing to minimize variability and background. |
| Plate Reader (Absorbance/Fluorescence/Luminescence) | Captures endpoint or kinetic data with high precision and accuracy. |
Within the context of a comprehensive thesis on ELISA methodologies—spanning direct, indirect, sandwich, and competitive formats—understanding the correlation and distinction between ELISA, Western Blot, and PCR is crucial. These techniques are foundational in research and drug development for detecting and quantifying biomolecules, yet they answer fundamentally different biological questions. This guide provides a technical comparison, detailing when and how to use each method, and how data from them can be correlated to validate findings.
Core Principles and Applications
ELISA (Enzyme-Linked Immunosorbent Assay): An immunoassay for detecting and quantifying soluble antigens (e.g., cytokines, hormones) or antibodies. It offers high throughput and excellent sensitivity for target concentration in a sample.
Western Blot (Immunoblot): An immunoassay used to detect specific proteins in a complex mixture, separated by gel electrophoresis. It provides information about protein molecular weight and post-translational modifications, confirming identity.
PCR (Polymerase Chain Reaction): A molecular technique to amplify specific DNA sequences exponentially. qPCR (quantitative PCR) allows for the quantification of nucleic acid levels (gene expression, viral load).
Table 1: Technique Comparison at a Glance
| Parameter | ELISA | Western Blot | PCR/qPCR |
|---|---|---|---|
| Target Molecule | Soluble protein, peptide, antibody | Protein | DNA, RNA (cDNA) |
| Primary Output | Quantification of target | Detection & relative quantification of protein; size confirmation | Amplification & quantification of nucleic acid sequence |
| Sensitivity | High (pg/mL) | Moderate (ng-range) | Extremely High (fg-µg) |
| Throughput | Very High (96/384-well) | Low to Moderate | High (96/384-well) |
| Time to Result | ~2-5 hours | ~6 hours to overnight | ~1-3 hours |
| Key Advantage | High throughput, quantitative, ease of use | Specificity, size information, modification detection | Ultimate sensitivity, genetic information |
| Key Limitation | Potential cross-reactivity; no size data | Low throughput, semi-quantitative, technically demanding | Does not confirm functional protein |
Table 2: Typical Correlation Scenario in Vaccine Development
| Assay Stage | Technique | Purpose | Correlates With |
|---|---|---|---|
| Antibody Screening | Indirect ELISA | High-throughput serum antibody titer | – |
| Specificity Confirmation | Western Blot | Verify antibody binding to correct antigen protein band | Positive ELISA results |
| Immune Response Mechanism | qPCR (from PBMCs) | Measure cytokine gene expression | High antibody titers (ELISA) and specific reactivity (WB) |
Detailed Experimental Protocols
Protocol 1: Sandwich ELISA for Cytokine Quantification
- Coating: Coat a 96-well plate with 100 µL/well of capture antibody (1-10 µg/mL in carbonate buffer). Incubate overnight at 4°C.
- Blocking: Aspirate, wash 3x with PBS + 0.05% Tween-20 (PBST). Add 200 µL blocking buffer (1% BSA in PBS). Incubate 1-2 hours at RT.
- Sample & Standard Incubation: Aspirate, wash 3x. Add 100 µL of sample or standard dilution in assay buffer. Incubate 2 hours at RT.
- Detection Antibody Incubation: Wash 3x. Add 100 µL of biotinylated detection antibody. Incubate 1-2 hours at RT.
- Streptavidin-Enzyme Conjugate: Wash 3x. Add 100 µL of Streptavidin-HRP. Incubate 30 minutes at RT, protected from light.
- Substrate & Stop: Wash 3-5x. Add 100 µL TMB substrate. Incubate 5-30 minutes. Stop reaction with 100 µL 2N H₂SO₄.
- Readout: Measure absorbance at 450 nm immediately.
Protocol 2: Western Blot for Protein Validation
- Sample Prep: Lyse cells in RIPA buffer with protease inhibitors. Quantify protein (BCA assay). Denature 20-50 µg protein with Laemmli buffer at 95°C for 5 min.
- Electrophoresis: Load samples onto SDS-PAGE gel (8-12%). Run at constant voltage (80-120V) until dye front reaches bottom.
- Transfer: Transfer proteins to PVDF membrane using wet tank transfer at constant current (300mA) for 90 minutes.
- Blocking: Block membrane in 5% non-fat milk in TBST for 1 hour at RT.
- Primary Antibody: Incubate with primary antibody diluted in blocking buffer overnight at 4°C.
- Washing: Wash membrane 3x for 10 minutes with TBST.
- Secondary Antibody: Incubate with HRP-conjugated secondary antibody for 1 hour at RT.
- Detection: Wash 3x. Apply chemiluminescent substrate and image using a digital imager.
Protocol 3: qPCR for Gene Expression Analysis
- RNA Isolation: Extract total RNA using a guanidinium thiocyanate-phenol-chloroform method or spin-column kit. Treat with DNase I.
- cDNA Synthesis: Use 1 µg RNA, random hexamers/oligo(dT), and reverse transcriptase in a 20 µL reaction.
- qPCR Setup: Prepare reaction mix with: 1X SYBR Green Master Mix, forward/reverse primers (200 nM each), cDNA template (10 ng equivalent), and nuclease-free water to 20 µL.
- Cycling Conditions: 95°C for 3 min; 40 cycles of: 95°C for 10 sec (denaturation), 60°C for 30 sec (annealing/extension). Include melt curve analysis.
- Analysis: Calculate ∆∆Cq values relative to a housekeeping gene and control sample.
Visualizing Workflows and Relationships
Title: Decision Flow for Assay Selection & Data Correlation
Title: Sandwich ELISA Experimental Workflow
The Scientist's Toolkit: Research Reagent Solutions
Table 3: Essential Reagents and Their Functions
| Item | Primary Function | Key Consideration |
|---|---|---|
| High-Affinity, Specific Antibodies (Matched Pair for ELISA) | Target capture and detection. | Minimize cross-reactivity; validate for application. |
| Recombinant Protein Standards | Generate quantitative standard curve. | Must be pure and biologically active. |
| HRP or AP Conjugates & Chemiluminescent/Luminescent Substrates | Generate measurable signal. | Match substrate sensitivity to target abundance. |
| PVDF or Nitrocellulose Membrane | Immobilize proteins for Western Blot. | PVDF has higher binding capacity and durability. |
| SDS-PAGE Gel System | Separate proteins by molecular weight. | Choose correct % acrylamide for target protein size. |
| SYBR Green or TaqMan Probe Master Mix | Enable real-time fluorescence in qPCR. | SYBR is cost-effective; TaqMan offers higher specificity. |
| RNase Inhibitors & DNase I | Preserve RNA integrity for PCR. | Critical for accurate gene expression analysis. |
| Blocking Agents (BSA, Non-fat Milk) | Reduce non-specific binding. | Milk can contain phosphatases; use BSA for phospho-specific work. |
Selecting the optimal Enzyme-Linked Immunosorbent Assay (ELISA) format is a critical decision that underpins data accuracy and experimental success in drug development and biomedical research. This guide provides an in-depth technical analysis, framed within the broader thesis of ELISA methodologies—direct, indirect, sandwich, and competitive—to inform selection for three major analyte classes: cytokines, antibodies, and small molecules.
ELISA Format Selection Matrix
The following table summarizes the quantitative performance characteristics and primary applications of each core ELISA format, based on current literature and product specifications.
Table 1: Comparative Performance of Core ELISA Formats
| Format | Typical Sensitivity Range | Dynamic Range (Typical) | Assay Time (Hands-on) | Key Advantage | Primary Analyte Class |
|---|---|---|---|---|---|
| Direct | Moderate (ng/mL) | 2-3 logs | Shortest | Speed, minimal steps | Antigens, tagged proteins |
| Indirect | Moderate-High (ng/mL) | 2-3 logs | Short | Amplification, flexibility | Antibodies (serology) |
| Sandwich | High (pg/mL) | 3-4 logs | Long | High specificity and sensitivity | Cytokines, proteins with epitopes |
| Competitive | High (pg/mL - ng/mL) | 2-3 logs | Medium | Ideal for small, monovalent analytes | Haptens, small molecules, drugs |
Case Studies & Experimental Protocols
Case Study 1: Cytokine Quantification (IL-6) via Sandwich ELISA
Protocol:
- Coating: Coat a 96-well plate with 100 µL/well of capture anti-IL-6 monoclonal antibody (1-10 µg/mL in carbonate/bicarbonate buffer, pH 9.6). Incubate overnight at 4°C.
- Blocking: Wash plate 3x with PBS + 0.05% Tween-20 (PBST). Add 200 µL/well of blocking buffer (1% BSA or 5% non-fat dry milk in PBS). Incubate 1-2 hours at room temperature (RT). Wash 3x.
- Sample & Standard Incubation: Add 100 µL of standards (recombinant IL-6 serially diluted in assay diluent) or test samples per well. Incubate 2 hours at RT. Wash 3x.
- Detection Antibody Incubation: Add 100 µL/well of biotinylated detection anti-IL-6 antibody. Incubate 1-2 hours at RT. Wash 3x.
- Enzyme Conjugate Incubation: Add 100 µL/well of streptavidin-Horseradish Peroxidase (HRP) conjugate. Incubate 30 minutes at RT, protected from light. Wash 3x.
- Substrate & Stop: Add 100 µL/well of TMB substrate. Incubate 15-20 minutes at RT. Stop reaction with 100 µL/well of 1M H₂SO₄.
- Readout: Measure absorbance immediately at 450 nm with a reference at 570 nm.
Diagram Title: Sandwich ELISA Workflow for Cytokine Detection
Case Study 2: Serum Antibody Titer (Anti-Dengue IgG) via Indirect ELISA
Protocol:
- Antigen Coating: Coat plate with 100 µL/well of Dengue virus antigen (2 µg/mL in coating buffer). Incubate overnight at 4°C.
- Blocking: Wash; block with 200 µL/well of blocking buffer (PBST + 5% BSA) for 1 hour at RT.
- Primary Antibody Incubation: Wash; add 100 µL/well of serially diluted human serum samples (primary antibody) in dilution buffer. Include positive/negative controls. Incubate 1-2 hours at RT. Wash.
- Secondary Antibody Incubation: Add 100 µL/well of enzyme-conjugated anti-human IgG (Fc-specific) antibody. Incubate 1 hour at RT. Wash.
- Substrate & Stop: Add TMB substrate. Incubate 10-15 minutes. Stop with acid.
- Readout: Measure absorbance at 450 nm. Titer is defined as the highest serum dilution giving an absorbance above the cut-off (negative control mean + 3x SD).
Diagram Title: Indirect ELISA for Serum Antibody Detection
Case Study 3: Small Molecule Detection (Mycotoxin Ochratoxin A) via Competitive ELISA
Protocol:
- Coating with Conjugate: Coat plate with 100 µL/well of Ochratoxin A-protein conjugate (e.g., OTA-BSA) at a predetermined optimal concentration. Incubate overnight at 4°C.
- Blocking & Preparation: Wash and block as described. Simultaneously, prepare a competition mix: constant, limiting amount of anti-OTA antibody is pre-incubated with either standards (known OTA) or samples (unknown OTA) for 30 minutes.
- Competitive Incubation: Transfer the pre-incubated mixtures to the coated plate. Free antibody binds to plate-bound OTA, while analyte-bound antibody is inhibited. Incubate 1 hour at RT. Wash.
- Secondary Antibody Incubation: Add enzyme-conjugated secondary antibody against the primary antibody host species (if primary is not directly labeled). Incubate 1 hour. Wash.
- Substrate, Stop, & Readout: Develop with substrate. Note: Signal is inversely proportional to the analyte concentration in the sample/standard.
Diagram Title: Principle of Competitive ELISA Format
The Scientist's Toolkit: Essential Research Reagent Solutions
Table 2: Key Reagents and Materials for ELISA Development
| Reagent/Material | Primary Function & Rationale |
|---|---|
| High-Affinity Matched Antibody Pair (for Sandwich) | Monoclonal antibodies targeting non-overlapping epitopes ensure specificity and sensitivity. Critical for cytokine/protein assays. |
| High-Purity Antigen | Required for plate coating in indirect (serology) or as a standard for calibration. Purity directly impacts assay background and specificity. |
| Biotin-Streptavidin System | Provides signal amplification. Biotinylated detection antibody binds multiple streptavidin-enzyme conjugates, enhancing sensitivity. |
| Chemiluminescent Substrate (e.g., Luminol-based) | Offers higher sensitivity and broader dynamic range than colorimetric substrates (TMB), ideal for low-abundance analytes. |
| Blocking Agent (e.g., BSA, Casein) | Occupies nonspecific protein-binding sites on the plate and assay components, reducing background noise. Choice depends on target and sample matrix. |
| Pre-coated / Ready-to-Use Plates | Provide standardization, reduce inter-assay variability, and save time. Available for many common cytokine and biomarker targets. |
| Multiplex Bead-Based Array Kits | For simultaneous quantification of up to 100+ analytes from a single small sample volume, representing an advanced evolution of the sandwich ELISA principle. |
Regulatory Considerations for Clinical and Diagnostic ELISA Development
The development of Enzyme-Linked Immunosorbent Assay (ELISA) methods for clinical and diagnostic use occurs within a stringent global regulatory framework. This guide details the core regulatory pathways, validation requirements, and quality management systems essential for bringing ELISA-based tests to market, contextualized within the broader thesis of ELISA method development (direct, indirect, sandwich, competitive). The primary goal is to ensure that assays are safe, effective, reliable, and produce clinically actionable results.
Global Regulatory Landscape
Clinical and diagnostic ELISA kits are classified as In Vitro Diagnostic Medical Devices (IVDs). The regulatory pathway depends on the device's risk classification, which is determined by its intended use and the potential risk posed by an erroneous result.
Table 1: Key Global Regulatory Bodies and Classifications for IVD ELISA Kits
| Region | Regulatory Body | Key Regulation | Risk Classification & Examples |
|---|---|---|---|
| United States | Food and Drug Administration (FDA) | 21 CFR Part 820 (QSR), CLIA '88 | Class I (Low Risk): General wellness markers. Class II (Moderate Risk): Hormone assays (e.g., TSH). Class III (High Risk): HIV or cancer diagnostics. |
| European Union | Notified Bodies | IVD Regulation (IVDR) 2017/746 | Class A (Low Risk): Buffer solutions. Class B (Moderate Risk): Fertility tests. Class C (High Risk): Infectious disease (HBV). Class D (High Risk): Blood screening (HIV). |
| International | International Organization for Standardization (ISO) | ISO 13485:2016 | Quality Management System standard for medical device design and manufacturing. |
Core Regulatory Requirements: Analytical & Clinical Performance
Regulatory submissions require comprehensive data demonstrating that the ELISA performs as intended. This is bifurcated into Analytical and Clinical Performance Validation.
Table 2: Essential Analytical Performance Characteristics for ELISA Validation
| Parameter | Definition | Acceptance Criteria Example (Quantitative Sandwich ELISA) | Recommended Protocol (Summary) |
|---|---|---|---|
| Precision | Closeness of agreement between repeated measurements. | Intra-assay CV <10%; Inter-assay CV <15%. | Run 20 replicates of 3 samples (low, mid, high concentration) in one run (intra-assay) and over 20 different runs/days (inter-assay). |
| Accuracy | Agreement between measured value and true value. | Recovery of 85-115% from spiked samples. | Spike known quantities of analyte into a relevant matrix (e.g., serum). Compare measured concentration to expected. |
| Specificity | Ability to measure analyte unequivocally in presence of interfering substances. | <10% cross-reactivity with homologous proteins; recovery within ±15% with common interferents (hemolysis, lipids). | Test cross-reactivity with structurally similar compounds. Test interference by adding bilirubin, hemoglobin, intralipids, etc., to samples. |
| Sensitivity | Limit of Blank (LoB): Highest apparent analyte concentration in blank samples. Limit of Detection (LoD): Lowest concentration distinguishable from LoB. Limit of Quantification (LoQ): Lowest concentration measurable with stated precision/accuracy. | LoD typically 2-3x SD above mean blank signal. LoQ: CV <20% at that concentration. | Assay blank matrix samples (n≥20). LoB = Mean(blank) + 1.645SD(blank). Assay low-concentration samples (n≥20). LoD = LoB + 1.645SD(low concentration). Determine LoQ as concentration where CV reaches acceptable level (e.g., 20%). |
| Linearity & Range | Ability to provide results directly proportional to analyte concentration in the sample. | Linear regression R² > 0.99 across claimed range. | Prepare 5-6 samples spanning the entire claimed measuring range. Analyze in duplicate. Plot expected vs. observed. |
| Robustness | Capacity to remain unaffected by small, deliberate variations in method parameters. | Results remain within predefined specifications. | Deliberately vary key parameters (incubation time ±5%, temperature ±2°C, reagent lot, analyst) and assess impact on critical results. |
Clinical Performance Validation establishes the diagnostic accuracy of the test.
- Clinical Sensitivity: Proportion of true positives correctly identified (e.g., >95%).
- Clinical Specificity: Proportion of true negatives correctly identified (e.g., >98%).
- Protocols involve testing a large number of well-characterized clinical specimens from relevant patient populations and using a predicate method or clinical diagnosis as the reference standard.
Quality Management System (QMS): ISO 13485
A certified QMS is a foundational regulatory requirement. It governs all stages from design to post-market surveillance.
- Design Controls: Documented process for user needs, design inputs, outputs, verification, validation, and review.
- Process Validation: Evidence that manufacturing processes consistently produce products meeting specifications.
- Document Control & Traceability: Ensures all materials, components, and processes are documented and traceable.
- Corrective and Preventive Action (CAPA): System for addressing non-conformities.
The Scientist's Toolkit: Essential Research Reagent Solutions
Table 3: Key Reagents and Materials for Regulatory-Grade ELISA Development
| Item | Function in ELISA Development | Critical for Regulatory Compliance |
|---|---|---|
| Certified Reference Material | Provides the "gold standard" for the target analyte with defined purity and concentration. | Essential for establishing traceability and accuracy for LoD, LoQ, and calibration. |
| Matrix-Matched Calibrators & Controls | Calibrators and controls prepared in a matrix mimicking the clinical sample (e.g., human serum). | Critical for accurate quantification, accounting for matrix effects. Required for daily run validation. |
| High-Affinity, Well-Characterized Antibody Pairs (for Sandwich ELISA) | Monoclonal or polyclonal antibodies targeting distinct epitopes of the analyte. | Defines assay specificity and sensitivity. Must be screened for cross-reactivity and lot-to-lot consistency. |
| Clinical Grade Enzymes & Substrates | Enzymes (e.g., HRP, ALP) and corresponding chromogenic/chemiluminescent substrates. | Must be stable and produce consistent signal-to-noise ratios. Batch documentation is required. |
| Validated Assay Buffer Systems | Blocking buffers, sample dilution buffers, wash buffers, and conjugate stabilization buffers. | Optimized to minimize background, prevent non-specific binding, and ensure analyte stability. |
| Stable, Low-Binding Microplates | Solid phase (typically 96-well polystyrene plates) for antibody/antigen immobilization. | Must demonstrate consistent binding capacity across all wells and lots. Critical for precision. |
Experimental Protocol: Precision Testing (Inter-Assay)
Objective: To determine the intermediate precision (inter-assay variation) of a quantitative sandwich ELISA by analyzing control samples over multiple runs. Materials: Fully optimized ELISA reagents (coated plate, detection antibody conjugate, substrate, stop solution), three quality control (QC) samples (Low, Medium, High concentration), calibrated pipettes, plate washer, microplate reader. Procedure:
- Preparation: Allow all reagents and QC samples to reach room temperature. Prepare working dilutions as per the protocol.
- Study Design: For each of the three QC levels, aliquot sufficient volume for 20 separate assays.
- Assay Execution: Over 20 independent working days, with at least two different analysts using different reagent lots and instrument calibrations, perform the ELISA assay in duplicate for each QC sample. Follow the established incubation times and temperatures precisely.
- Data Analysis: For each QC level, calculate the mean concentration, standard deviation (SD), and coefficient of variation (CV% = (SD/Mean)*100) across the 20 runs.
- Acceptance: The inter-assay CV for each QC level should typically be ≤15% for a validated clinical ELISA.
Regulatory Submission Pathways
- FDA: Premarket Notification [510(k)] for substantial equivalence to a predicate device, or Premarket Approval (PMA) for novel high-risk devices.
- EU IVDR: Requires a conformity assessment by a Notified Body, including review of technical documentation and performance evaluation reports, culminating in a CE marking.
- Common Dossier: The Common Technical Document (CTD) format is widely accepted, organizing information into Quality, Non-Clinical, and Clinical modules.
Diagram Title: Regulatory Pathway for Diagnostic ELISA Development
Diagram Title: Core Validation Parameters for Diagnostic ELISA
Conclusion
ELISA remains an indispensable, versatile tool in the researcher's arsenal, with each format—direct, indirect, sandwich, and competitive—offering unique advantages tailored to specific experimental questions. Mastery of their foundational principles, meticulous methodological execution, proactive troubleshooting, and rigorous validation are paramount for generating reliable, reproducible data. The future of ELISA lies in continued innovation towards multiplexing, automation, and ultra-sensitive detection, promising to further propel its utility in biomarker validation, drug development, and point-of-care diagnostics. By strategically selecting and optimizing the appropriate ELISA format, scientists can unlock deeper insights into disease mechanisms and therapeutic efficacy.