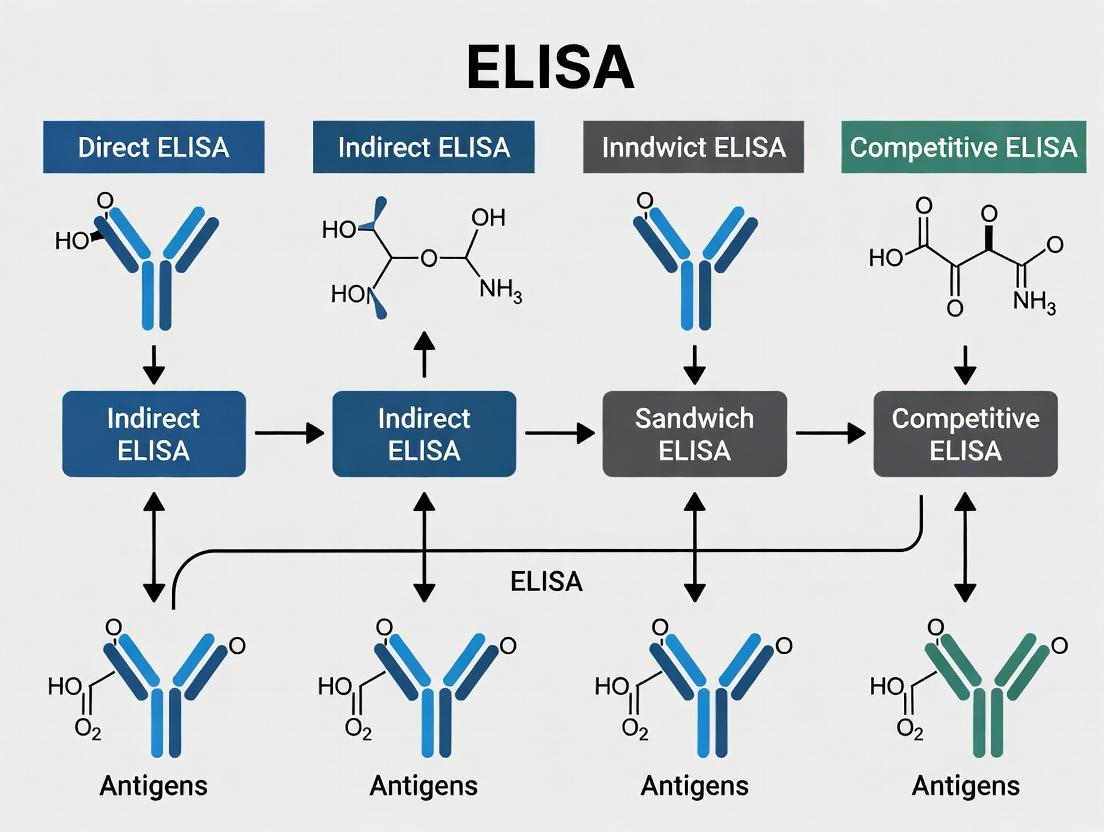
ELISA Types Explained: A Researcher's Guide to Formats, Principles & Selection
This comprehensive guide for researchers and drug development professionals details the core principles, formats, and applications of Enzyme-Linked Immunosorbent Assay (ELISA) technologies.
ELISA Types Explained: A Researcher's Guide to Formats, Principles & Selection
Abstract
This comprehensive guide for researchers and drug development professionals details the core principles, formats, and applications of Enzyme-Linked Immunosorbent Assay (ELISA) technologies. It systematically explores the fundamental mechanisms of antigen-antibody detection, the step-by-step methodologies of major ELISA types (Direct, Indirect, Sandwich, and Competitive), and their specific applications in biomarker quantification and drug discovery. The article provides actionable troubleshooting strategies for common pitfalls, discusses optimization of sensitivity and specificity, and offers a comparative analysis for validation and assay selection. It concludes with guidance on choosing the right ELISA for your experimental needs and future directions in immunoassay technology.
ELISA Fundamentals: Core Principles, Antibody Mechanics, and Detection Systems Explained
What is ELISA? Defining the Gold Standard in Immunoassays
Within the broad thesis of immunoassay technologies, the Enzyme-Linked Immunosorbent Assay (ELISA) remains the foundational and gold standard method for the qualitative detection and quantitative measurement of soluble targets, including proteins, antibodies, and hormones. Its enduring relevance in research and drug development stems from its high specificity, sensitivity, robustness, and adaptability to high-throughput formats. This guide provides an in-depth technical examination of ELISA principles, types, and protocols, framed for the advanced practitioner.
Core Principle and Signaling Pathway
ELISA is a plate-based assay technique that leverages the specificity of antigen-antibody binding and the sensitivity of a simple enzyme-mediated colorimetric reaction. A captured target molecule is immobilized on a solid phase (typically a microplate well) and detected by an antibody conjugated to an enzyme, such as Horseradish Peroxidase (HRP) or Alkaline Phosphatase (AP). The addition of a chromogenic substrate produces a measurable signal proportional to the target concentration.
Diagram Title: Core ELISA Signal Generation Pathway
Types of ELISA: A Comparative Analysis
The versatility of ELISA is manifested in several fundamental formats, each suited to specific experimental questions within a research portfolio.
Diagram Title: ELISA Formats and Primary Applications
Table 1: Comparative Analysis of Major ELISA Types
| Feature | Direct ELISA | Indirect ELISA | Sandwich ELISA | Competitive ELISA |
|---|---|---|---|---|
| Complexity | Low | Medium | High | High |
| Time | Fast | Moderate | Long | Long |
| Sensitivity | Low | High | Very High | High |
| Specificity | Moderate | High | Very High | Very High |
| Key Advantage | Speed, minimal steps | Signal amplification, flexibility | Specificity & sensitivity for complex samples | Measures small antigens |
| Primary Use Case | Antigen screening, simple samples | Antibody quantification (e.g., serology) | Cytokine, biomarker quantification | Hormones, haptens, drugs |
| Cost | Low | Low-Moderate | High | High |
Detailed Protocol: Sandwich ELISA for Cytokine Quantification
This is a standard workflow for a quantitative sandwich ELISA, representing one of the most common applications in research.
Day 1: Coating
- Dilute Capture Antibody in carbonate-bicarbonate coating buffer (pH 9.6) to a concentration typically between 1-10 µg/mL.
- Coat Microplate: Add 100 µL/well of antibody solution to a 96-well polystyrene microplate. Seal and incubate overnight at 4°C.
Day 2: Assay Steps
- Washing: Aspirate liquid and wash plate 3x with 300 µL/well of PBS containing 0.05% Tween 20 (PBST). Blot on absorbent paper.
- Blocking: Add 200-300 µL/well of blocking buffer (e.g., 5% BSA or non-fat dry milk in PBST). Incubate for 1-2 hours at room temperature (RT). Wash 3x.
- Sample & Standard Addition: Prepare serial dilutions of the protein standard in sample diluent. Add 100 µL of standards, samples, and blank (diluent alone) to assigned wells. Incubate 2 hours at RT or 1 hour at 37°C. Wash 3-5x.
- Detection Antibody Addition: Add 100 µL/well of biotinylated or enzyme-conjugated detection antibody (optimized concentration in diluent). Incubate 1-2 hours at RT. Wash 3-5x. If using a biotinylated antibody, proceed to Step 5.
- Streptavidin-Enzyme Conjugate Addition: Add 100 µL/well of Streptavidin-HRP (diluted per manufacturer's instructions). Incubate 20-30 minutes at RT, protected from light. Wash 3-5x.
- Substrate Development: Add 100 µL/well of TMB (3,3',5,5'-Tetramethylbenzidine) substrate. Incubate in the dark at RT for 5-30 minutes, monitoring for color development.
- Stop Reaction: Add 50-100 µL/well of stop solution (e.g., 1M H₂SO₄ or HCl). The blue TMB turns yellow.
- Read Absorbance: Immediately measure absorbance at 450 nm (with a reference wavelength of 570-650 nm for correction) using a microplate reader.
Data Analysis: Generate a standard curve by plotting the mean absorbance (y-axis) against the known standard concentration (x-axis) using a 4- or 5-parameter logistic (4PL/5PL) curve fit. Interpolate sample concentrations from the curve.
Diagram Title: Detailed Sandwich ELISA Experimental Workflow
The Scientist's Toolkit: Key Research Reagent Solutions
Table 2: Essential Materials and Reagents for ELISA
| Reagent / Material | Function & Critical Considerations |
|---|---|
| Polystyrene Microplates | Solid phase for protein immobilization. High-binding plates (e.g., Nunc MaxiSorp) are coated with functional groups to optimize antibody/antigen adsorption. |
| Capture & Detection Antibodies | Matched antibody pair critical for sandwich ELISA. Must bind to non-overlapping epitopes on the target with high affinity and specificity. |
| Protein Standards | Highly purified, quantified target protein for generating the standard curve. Accuracy is paramount for reliable quantification. |
| Detection Enzyme Conjugates | HRP or AP conjugated to detection antibody or streptavidin. HRP is most common due to high turnover rate and stable conjugates. |
| Chromogenic Substrates | TMB (colorimetric, read at 450 nm) is standard. For enhanced sensitivity, chemiluminescent (e.g., luminol) or fluorescent substrates can be used. |
| Blocking Buffers | Solutions of inert proteins (BSA, casein) or commercial blockers to occupy non-specific binding sites, reducing background noise. |
| Plate Washers & Readers | Automated washers ensure consistent washing. Microplate spectrophotometers measure absorbance; multimode readers handle fluorescence/luminescence. |
| Analysis Software | Software (e.g., SoftMax Pro, GraphPad Prism) for 4PL/5PL curve fitting and sample concentration interpolation. |
Recent Advancements and Quantitative Performance Data
Modern developments focus on enhancing multiplexing, sensitivity, and throughput. According to recent market analyses and product literature:
Table 3: Performance Metrics and Technological Advancements
| Parameter | Typical/Historical Range | Current Advanced Capabilities | Notes |
|---|---|---|---|
| Detection Sensitivity | ~1-10 pg/mL (sandwich) | <0.1 pg/mL (ultrasensitive) | Achieved via improved conjugates, signal amplification (e.g., S-Poly-HRP), or digital ELISA platforms. |
| Dynamic Range | 2-3 log units | 4-5 log units | Broader range reduces sample dilutions, enabled by improved curve-fitting algorithms and reagents. |
| Multiplexing | Singleplex (traditional) | 10-50+ targets (Luminex/MSD) | Electrochemiluminescence (MSD) or bead-based (Luminex) platforms allow parallel measurement. |
| Assay Time | 6-8 hours (standard) | 90 minutes - 3 hours (rapid) | Streamlined protocols, one-step incubations, and pre-coated, ready-to-use plates. |
| Throughput | 96-well plate | 384- and 1536-well plates | Compatible with full laboratory automation (liquid handlers, robotic arms). |
| Inter-Assay CV | 10-15% | <10% (optimized kits) | Critical for reproducibility in longitudinal studies; depends on reagent lot consistency. |
ELISA endures as the gold standard in immunoassays due to its unparalleled combination of specificity, quantitative accuracy, and adaptability. Within a comprehensive research thesis on immunoassay types, it represents the critical benchmark against which newer technologies (such as SIMOA or proximity ligation assays) are measured. Mastery of its principles, formats, and optimization strategies remains an indispensable skill for researchers and drug development professionals engaged in biomarker discovery, pharmacokinetic studies, and diagnostic development. The evolution of ELISA into faster, more sensitive, and multiplexed formats ensures its continued centrality in the quantitative analysis of biomolecules.
This whitepaper details the foundational principle underpinning all Enzyme-Linked Immunosorbent Assay (ELISA) formats. The specific, high-affinity binding between an antigen and its corresponding antibody, coupled with an enzyme-mediated colorimetric signal amplification, forms the core of this ubiquitous technology. Understanding this principle is essential for researchers selecting and optimizing ELISA types for specific applications in drug development, diagnostics, and basic research.
Core Principle: Antigen-Antibody Binding
The interaction is characterized by non-covalent forces (hydrogen bonds, ionic interactions, Van der Waals forces, and hydrophobic effects). Key quantitative parameters define this interaction:
Table 1: Key Parameters of Antigen-Antibody Binding
| Parameter | Definition | Typical Range/Values | Significance in ELISA |
|---|---|---|---|
| Affinity (K~a~) | Equilibrium association constant. | 10^4^ to 10^12^ M^-1^ | Higher affinity leads to more sensitive assays with lower detection limits. |
| Avidity | Overall binding strength of multivalent interactions. | N/A (functional measure) | Enhances effective binding strength, critical for capture of complex antigens. |
| Cross-Reactivity | Binding to non-target antigens with similar epitopes. | Aim for <1% | Impacts specificity; must be minimized via careful antibody selection. |
| Kinetics (k~on~, k~off~) | Rates of association and dissociation. | k~on~: 10^3^-10^7^ M^-1^s^-1^; k~off~: 10^-1^-10^-6^ s^-1^ | k~off~ rate influences wash stringency; slower k~off~ improves retention. |
Core Principle: Enzyme-Mediated Detection
Signal generation relies on an enzyme conjugated to an antibody (or other binding molecule). The enzyme catalyzes the conversion of a colorless substrate into a colored, fluorescent, or chemiluminescent product.
Table 2: Common Enzyme-Substrate Systems in ELISA
| Enzyme | Common Source | Substrate (Colorimetric) | Detection Product (λ~max~) | Time to Signal (approx.) |
|---|---|---|---|---|
| Horseradish Peroxidase (HRP) | Armoracia rusticana | TMB (3,3',5,5'-Tetramethylbenzidine) | Blue (370 nm) / Yellow (450 nm after stop) | 5-30 min |
| Alkaline Phosphatase (AP) | Calf Intestinal | pNPP (p-Nitrophenyl Phosphate) | Yellow (405 nm) | 15-60 min |
| β-Galactosidase | E. coli | ONPG (o-Nitrophenyl-β-D-galactopyranoside) | Yellow (420 nm) | 30-120 min |
| HRP | Armoracia rusticana | ABTS (2,2'-Azinobis [3-ethylbenzothiazoline-6-sulfonic acid]) | Green (410 nm, 650 nm) | 10-60 min |
Generalized Experimental Protocol: Indirect ELISA
This protocol exemplifies the core principle for detecting specific antibodies in sample serum.
Protocol: Indirect ELISA for Antibody Detection
- Coating: Dilute the target antigen in carbonate/bicarbonate coating buffer (50 mM, pH 9.6). Add 50-100 µL per well to a polystyrene microplate. Incubate overnight at 4°C or for 1-2 hours at 37°C.
- Washing: Aspirate liquid. Wash plate 3 times with 200-300 µL PBS containing 0.05% Tween 20 (PBST) per well using a plate washer or manual pipetting. Blot plate on absorbent paper.
- Blocking: Add 150-200 µL of blocking buffer (e.g., 1-5% BSA or non-fat dry milk in PBST) per well. Incubate for 1-2 hours at 37°C or overnight at 4°C. Wash as in Step 2.
- Primary Antibody Incubation: Dilute the test serum sample or primary antibody in blocking buffer. Add 50-100 µL per well. Incubate for 1-2 hours at 37°C. Wash as in Step 2.
- Enzyme-Conjugated Secondary Antibody Incubation: Dilute the species-specific enzyme-conjugated secondary antibody (e.g., Goat anti-Human IgG-HRP) in blocking buffer. Add 50-100 µL per well. Incubate for 1-2 hours at 37°C in the dark. Wash thoroughly (4-5 times) as in Step 2.
- Substrate Addition: Prepare enzyme substrate (e.g., TMB) according to manufacturer's instructions. Add 50-100 µL per well. Incubate in the dark at room temperature for 5-30 minutes, monitoring for color development.
- Stop Reaction: Add 50-100 µL of stop solution (e.g., 1M H~2~SO~4~ for TMB) per well. The color will change from blue to yellow.
- Detection: Measure the absorbance of each well immediately using a microplate reader at the appropriate wavelength (e.g., 450 nm for stopped TMB).
Figure 1: Indirect ELISA Workflow for Antibody Detection
Signaling Pathway Visualization
The core detection principle involves an enzymatic cascade that amplifies the primary binding event.
Figure 2: ELISA Signal Amplification Pathway
The Scientist's Toolkit: Research Reagent Solutions
Table 3: Essential Reagents for ELISA Implementation
| Reagent/Material | Function & Rationale | Key Considerations |
|---|---|---|
| Microplate (Polystyrene) | Solid phase for immobilization of capture molecule. | High binding capacity plates for proteins (>400 ng IgG/cm²); choose clear for colorimetric, black/white for luminescence. |
| Coating Buffer (Carbonate-Bicarbonate, pH 9.6) | Optimal pH for passive adsorption of proteins to polystyrene via hydrophobic interactions. | Freshly prepared; high pH (9.6) gives proteins a net negative charge, enhancing binding to the hydrophilic plate. |
| Wash Buffer (PBS with 0.05% Tween 20) | Removes unbound reagents; Tween 20 minimizes non-specific background binding. | Maintain consistent wash volume and number; ensure complete aspiration between washes. |
| Blocking Agent (BSA, Casein, Non-fat Dry Milk) | Saturates remaining protein-binding sites on the plate and well surfaces to prevent non-specific adsorption. | Must be irrelevant to the assay system. Concentration (1-5%) and type (protein vs. protein-free) require optimization. |
| Detection Antibody (Enzyme-Conjugate) | Binds specifically to the target molecule and provides enzymatic activity for signal generation. | Conjugate stability (HRP is less stable than AP). Optimize dilution to balance signal-to-noise ratio. |
| Chromogenic Substrate (e.g., TMB, pNPP) | Enzyme substrate that yields a measurable colored product upon catalysis. | Sensitivity and required read time vary. TMB is sensitive, fast, and safe (non-carcinogenic). |
| Stop Solution (e.g., 1M H~2~SO~4~, 2M NaOH) | Halts the enzymatic reaction abruptly by denaturing the enzyme or altering pH. | Must be compatible with substrate (acid stop for TMB/HRP, base not used for pNPP/AP). |
| Microplate Spectrophotometer | Precisely measures the absorbance of the colored product in each well. | Must have correct filter (e.g., 450 nm for stopped TMB). Dual-wavelength readings can correct for optical imperfections. |
Introduction Within the broader thesis of understanding ELISA types for research—from direct and indirect to sandwich and competitive assays—the fundamental performance and sensitivity of any format are dictated by its core components. This technical guide deconstructs the anatomy of an Enzyme-Linked Immunosorbent Assay (ELISA), detailing the function, selection criteria, and experimental protocols for its four key pillars: the plate, antibodies, substrate, and blockers. Mastery of these elements is essential for researchers and drug development professionals to design robust, reproducible assays.
1. The Plate: The Solid-Phase Foundation The microtiter plate is the physical and chemical foundation of the ELISA. Its primary function is to immobilize the capture molecule (antigen or antibody). The choice of plate material and surface coating is critical for assay performance.
- Material: Typically polystyrene or polycarbonate, chosen for its protein-binding capacity.
- Surface Binding: Passive adsorption relies on hydrophobic and ionic interactions between the plastic and non-polar regions of proteins. Newer plates utilize covalent coupling chemistries for more stable immobilization.
- Well Types: Standard high-binding, medium-binding, and low-binding plates are available to optimize the signal-to-noise ratio based on the analyte and assay sensitivity requirements.
Table 1: Common ELISA Plate Types and Characteristics
| Plate Type | Binding Capacity | Primary Coating | Typical Use Case |
|---|---|---|---|
| High-Binding | >400 ng IgG/cm² | Passive adsorption (hydrophobic) | Standard sandwich ELISA; capturing antibodies. |
| Medium-Binding | ~200 ng IgG/cm² | Passive adsorption | For antigens or antibodies prone to denaturation. |
| Low-Binding | <50 ng IgG/cm² | Hydrophilic surface | To minimize non-specific binding in assays with high analyte concentration. |
| Covalent/Linker | Variable | NHS, Glutaraldehyde, etc. | For small molecules, peptides, or unstable proteins. |
Protocol: Plate Coating Optimization Objective: To determine the optimal concentration of capture antibody or antigen for plate coating.
- Prepare a 2-fold serial dilution of the capture molecule in carbonate-bicarbonate buffer (pH 9.6) or PBS (pH 7.4).
- Dispense 100 µL of each dilution across rows of a high-binding ELISA plate. Include a well with coating buffer only as a blank.
- Seal plate and incubate overnight at 4°C or for 1-2 hours at 37°C.
- Wash plate 3x with PBS containing 0.05% Tween-20 (PBST).
- Proceed with blocking and subsequent assay steps using a constant, known positive control sample.
- Plot signal vs. concentration. The optimal coating concentration is the lowest point on the plateau of the curve, maximizing signal while conserving reagent.
2. Antibodies: The Specificity and Signal Generators ELISA relies on the specific interaction between a capture antibody and a detection antibody. The detection antibody is conjugated to an enzyme that generates the measurable signal.
- Capture Antibody: Must be highly specific, purified, and used in a matched pair (for sandwich ELISA) that recognizes a different epitope than the detection antibody.
- Detection Antibody: Conjugated to an enzyme such as Horseradish Peroxidase (HRP) or Alkaline Phosphatase (AP). The choice dictates the available substrate chemistry.
- Key Metrics: Affinity, specificity, and cross-reactivity data from the supplier are paramount. Batch-to-batch consistency is critical for longitudinal studies.
3. Blockers: Minimizing Non-Specific Background Blocking is the process of saturating all unoccupied protein-binding sites on the plate after coating to prevent non-specific adhesion of detection reagents, which causes high background noise.
- Common Blocking Buffers: 1-5% Bovine Serum Albumin (BSA), non-fat dry milk, casein, or fish gelatin in PBST.
- Selection Criteria: Must be inert to the assay components. Non-fat milk is cost-effective but contains biotin and phosphatase, which interfere with streptavidin- or AP-based systems. BSA is more defined and preferred for phosphorylated targets.
- Incubation: Typically 1-2 hours at room temperature with gentle agitation.
Protocol: Blocking Buffer Comparison Objective: To evaluate the efficiency of different blocking buffers in minimizing background.
- Coat a plate with a low, known concentration of target antigen. Include uncoated wells.
- Divide the plate and block different sections with 200 µL/well of: 1% BSA/PBST, 3% BSA/PBST, 5% non-fat dry milk/PBST, and 1% casein/PBST.
- Incubate for 1 hour at RT.
- Wash 3x with PBST.
- Add detection antibody conjugate (at its working concentration) to half the wells in each blocked section. Add conjugate diluent only to the other half (background control).
- Incubate, wash, and develop with substrate. Measure OD.
- Compare the signal-to-noise ratio (Signal from antigen-coated wells / Signal from uncoated wells) for each blocker.
4. The Substrate: Generating the Measurable Signal The enzyme conjugated to the detection antibody catalyzes the conversion of a substrate into a colored (chromogenic), fluorescent, or luminescent product.
- HRP Substrates: TMB (3,3',5,5'-Tetramethylbenzidine) yields a blue color that turns yellow after acid stop; sensitive and most common. ABTS and OPD are alternatives.
- AP Substrates: pNPP (p-Nitrophenyl Phosphate) yields a yellow product; used for chromogenic detection.
- Enhanced Chemiluminescence (ECL): Used with HRP for ultra-sensitive, high dynamic range detection, measured by a luminometer.
Table 2: Common ELISA Substrate Systems
| Enzyme | Substrate | Product Type | Stop Solution | Readout (nm) |
|---|---|---|---|---|
| Horseradish Peroxidase (HRP) | TMB | Chromogenic | 1M H₂SO₄ or HCl | 450 nm |
| Horseradish Peroxidase (HRP) | OPD | Chromogenic | 1M H₂SO₄ | 492 nm |
| Alkaline Phosphatase (AP) | pNPP | Chromogenic | 1M NaOH | 405-415 nm |
| Horseradish Peroxidase (HRP) | Luminol/H₂O₂ Enhancer | Chemiluminescent | Not required | Luminometer |
Protocol: Substrate Kinetic Read Objective: To determine the optimal development time for a chromogenic substrate.
- Set up positive control, negative control, and blank wells.
- After final wash, add substrate to all wells simultaneously using a multichannel pipette.
- Immediately place the plate in the pre-warmed plate reader.
- Initiate a kinetic read, measuring absorbance (e.g., at 650 nm for TMB, before acid stop) every 30-60 seconds for 15-20 minutes.
- Plot OD vs. time. The optimal development time is within the linear phase of the positive control curve, before saturation. Standardize this time for all future assays.
Visualization: Direct vs. Sandwich ELISA Workflow
The Scientist's Toolkit: Essential ELISA Reagent Solutions
| Reagent Category | Specific Example | Critical Function |
|---|---|---|
| Coating Buffer | Carbonate-Bicarbonate Buffer (pH 9.6) | Optimizes protein adsorption to polystyrene plate via hydrophobic interactions. |
| Wash Buffer | PBS with 0.05% Tween 20 (PBST) | Removes unbound reagents; Tween-20 reduces non-specific binding. |
| Blocking Agent | Bovine Serum Albumin (BSA), Fraction V | Saturates residual binding sites to minimize background signal. |
| Detection Antibody | HRP-Conjugated Anti-Species IgG | Binds specifically to target; HRP enzyme catalyzes signal generation. |
| Chromogenic Substrate | TMB (3,3',5,5'-Tetramethylbenzidine) | HRP substrate yielding a measurable color change (blue to yellow). |
| Stop Solution | 1M Sulfuric Acid (H₂SO₄) | Stops the enzymatic reaction and stabilizes final color for reading. |
| Plate Sealers | Adhesive Polyester Film | Prevents evaporation and contamination during incubations. |
Conclusion The integrity of any ELISA, regardless of its format within the broader classification, hinges on the informed selection and optimization of its anatomical components. The plate determines immobilization efficiency, antibodies confer specificity, blockers control background, and the substrate defines sensitivity and dynamic range. By systematically applying the protocols and principles outlined for each component, researchers can deconstruct assay failures, tailor systems for novel targets, and generate reliable, high-quality data to advance drug discovery and fundamental research.
Abstract This technical guide provides an in-depth analysis of the core detection reagents that define the functionality and performance of various Enzyme-Linked Immunosorbent Assay (ELISA) formats. Framed within the broader thesis of selecting the optimal ELISA type for a specific research goal, this whitepaper details the chemical properties, selection criteria, and experimental protocols for conjugates, enzymes, and their corresponding substrates. The choice of these components directly impacts key assay parameters including sensitivity, dynamic range, multiplexing capability, and throughput.
Core Detection System Components
The detection "signal" in an ELISA is generated through a cascade: the target is captured by a specific antibody, which is linked via a conjugate to an enzyme. This enzyme then catalyzes the conversion of a substrate into a measurable product.
Conjugates: The Signal-Linking Bridge
Conjugates are molecules where a detection antibody (or other biorecognition element like streptavidin) is covalently coupled to a reporter enzyme. The choice of conjugate is critical for assay design.
Common Conjugation Chemistries:
- Glutaraldehyde: A homobifunctional crosslinker that links amine groups. Can lead to polymerization.
- Periodate Oxidation: Used for glycosylated enzymes like HRP; oxidizes sugar residues to aldehydes for coupling to amines.
- Heterobifunctional Crosslinkers (e.g., SMCC): Feature maleimide and NHS ester groups for controlled, site-specific coupling between thiols and amines, reducing enzyme inactivation.
Protocol 1.1: Standard Protocol for HRP-Antibody Conjugation Using Periodate Oxidation
- Oxidation: Dissolve 5 mg of HRP in 1.0 mL of 0.1 M sodium periodate. Stir for 20 minutes at room temperature (RT), protected from light.
- Dialysis: Transfer the solution to a dialysis cassette and dialyze against 1 mM sodium acetate buffer (pH 4.4) overnight at 4°C.
- Conjugation: Adjust the pH of the oxidized HRP to 9.0-9.5 with 0.2 M sodium carbonate buffer (pH 9.5). Immediately add 5 mg of the antibody (IgG) to the solution. Incubate with gentle stirring for 2 hours at RT.
- Stabilization: Add 0.1 mL of fresh sodium borohydride solution (4 mg/mL) and incubate for 2 hours at 4°C.
- Purification: Purify the conjugate via size-exclusion chromatography (e.g., Sephadex G-25) equilibrated with PBS. Add an equal volume of glycerol and store at -20°C.
Enzymes: The Signal Amplifiers
Enzymes catalyze the conversion of substrates, providing signal amplification. The two most prevalent enzymes are Horseradish Peroxidase (HRP) and Alkaline Phosphatase (AP).
Table 1: Key Properties of Common ELISA Reporter Enzymes
| Property | Horseradish Peroxidase (HRP) | Alkaline Phosphatase (AP) |
|---|---|---|
| EC Number | 1.11.1.7 | 3.1.3.1 |
| Optimal pH | ~5.0-6.0 (can vary with substrate) | ~9.0-10.0 |
| Cofactor/Ions | Heme group, requires H₂O₂ | Requires Zn²⁺ and Mg²⁺ |
| Inhibition | Cyanides, azides, sulfides | EDTA, inorganic phosphate |
| Turnover Rate | Very High (~10³-10⁶ s⁻¹) | High (~10³ s⁻¹) |
| Typical Conjugate Size | ~44 kDa | ~140 kDa (dimer) |
| Key Advantage | High activity, small size, inexpensive | Very stable, low background in biological samples |
| Key Disadvantage | Susceptible to inhibitors in samples (e.g., azide) | Larger size may cause steric hindrance |
Substrates: The Signal Generators
Substrates are converted by the enzyme into colored (chromogenic), fluorescent (fluorogenic), or light-emitting (luminescent) products.
Table 2: Characteristics of Common ELISA Substrate Types
| Substrate Type | Example (Enzyme) | Product Measurement | Dynamic Range | Sensitivity | Typical Use Case |
|---|---|---|---|---|---|
| Chromogenic | TMB (HRP) | Absorbance (450 nm) | ~2-3 logs | Moderate (pg/mL) | Qualitative/quantitative endpoint assays, visual assessment. |
| Chromogenic | pNPP (AP) | Absorbance (405 nm) | ~2-3 logs | Moderate (pg/mL) | Qualitative/quantitative endpoint assays. |
| Chemiluminescent | Luminol/H₂O₂ + enhancers (HRP) | Luminescence (RLU) | ~4-6 logs | High (fg/mL - pg/mL) | High-sensitivity quantitative assays, Western blotting. |
| Chemiluminescent | CDP-Star / CSPD (AP) | Luminescence (RLU) | ~4-6 logs | High (fg/mL - pg/mL) | Ultra-sensitive assays, e.g., reporter gene assays. |
| Fluorogenic | QuantaBlu (HRP) | Fluorescence (Ex ~325 nm, Em ~420 nm) | ~3-4 logs | High (pg/mL) | Sensitive quantitative assays, lower background than chromogenic. |
Protocol 1.2: Standard Workflow for a Quantitative Sandwich ELISA Using TMB
- Coating: Coat a 96-well microplate with 100 µL/well of capture antibody (1-10 µg/mL in carbonate/bicarbonate buffer, pH 9.6). Seal and incubate overnight at 4°C.
- Washing & Blocking: Aspirate and wash plate 3x with 300 µL PBS-T (PBS + 0.05% Tween-20). Add 300 µL/well of blocking buffer (e.g., 1% BSA in PBS). Incubate 1-2 hours at RT.
- Sample & Standard Incubation: Aspirate block. Add 100 µL/well of sample (diluted in sample diluent) or standard in duplicate. Incubate 2 hours at RT.
- Washing: Wash plate 3-5x with PBS-T.
- Detection Antibody Incubation: Add 100 µL/well of HRP-conjugated detection antibody (diluted per manufacturer in blocking buffer). Incubate 1-2 hours at RT.
- Washing: Wash plate 3-5x with PBS-T.
- Substrate Incubation: Add 100 µL/well of TMB substrate solution. Incubate for 10-20 minutes at RT, protected from light. Observe blue color development.
- Stop Reaction: Add 50 µL/well of 2N H₂SO₄ to stop the reaction. The color will change from blue to yellow.
- Readout: Immediately measure absorbance at 450 nm (reference 570-650 nm) using a plate reader.
- Analysis: Generate a standard curve using a 4- or 5-parameter logistic (4PL/5PL) fit and interpolate sample concentrations.
Signaling Pathways and Workflow
The biochemical pathway and experimental sequence for a typical chemiluminescent sandwich ELISA are depicted below.
Diagram 1: HRP Chemiluminescent Pathway & ELISA Workflow
The Scientist's Toolkit: Research Reagent Solutions
Table 3: Essential Reagents for ELISA Development and Execution
| Item | Function & Rationale |
|---|---|
| High-Affinity Matched Antibody Pair | A capture and detection antibody binding to non-overlapping epitopes on the target antigen. Critical for specificity and sensitivity in sandwich ELISA. |
| HRP or AP Conjugates | Streptavidin-conjugated or secondary antibody-conjugated enzymes. Enable flexible detection via biotinylated antibodies or direct secondary detection. |
| Low-Autofluorescence Microplates | Solid support optimized for protein binding (e.g., high-binding polystyrene) and minimal background in fluorescent/luminescent assays. |
| Chromogenic Substrate (e.g., TMB) | For stable, visible color development. Essential for endpoint assays and qualitative analysis. |
| Enhanced Chemiluminescent (ECL) Substrate | Contains enhancers for prolonged, bright light emission. Required for high-sensitivity, quantitative assays with a wide dynamic range. |
| Blocking Agent (e.g., BSA, Casein) | Non-specific protein used to saturate uncoated plastic surface, minimizing background noise from non-specific binding. |
| Wash Buffer with Surfactant (e.g., PBS-T) | Removes unbound reagents; the surfactant (Tween-20) reduces non-specific interactions. |
| Precision Pipettes & Multichannel Pipette | Ensure accurate and reproducible liquid handling, especially critical for serial dilutions and plate washing. |
| Plate Reader (Absorbance/Fluorescence/Luminescence) | Instrument for quantitation. Must be compatible with the chosen detection modality (wavelength or filter for absorbance/fluorescence, integration time for luminescence). |
| Microplate Washer (Automated/Manual) | Provides consistent and thorough washing, a key factor in reducing background and improving reproducibility. |
Selection Guide within the ELISA Thesis Framework
The choice of conjugate-enzyme-substrate system is dictated by the ELISA format selected for the research question.
- Direct/Indirect ELISA (for antibody detection): Typically use enzyme-conjugated secondary antibodies (anti-species) with chromogenic substrates for simplicity and cost-effectiveness.
- Sandwich ELISA (for antigen detection): Prioritize sensitivity. Use biotin-streptavidin amplification systems (biotinylated detection Ab + Streptavidin-HRP/AP) with a chemiluminescent substrate for maximal sensitivity.
- Competitive/Inhibition ELISA (for small molecules): Often employ chromogenic substrates for a robust, straightforward signal inversely proportional to analyte concentration.
- Multiplex ELISA (Luminex/MSD): Rely on fluorogenic or electrochemiluminescent substrates where the signal is spatially or temporally resolved for multiple analytes in a single well.
Conclusion The performance of any ELISA is fundamentally governed by the careful selection and optimization of its core detection reagents: the conjugate, the enzyme, and the substrate. Integrating the properties of these components—considering size, activity, stability, and signal output—with the requirements of the chosen ELISA format enables researchers to design assays with the necessary sensitivity, specificity, and dynamic range for robust drug development and biomedical research. This guide provides the foundational knowledge and protocols to make these critical decisions within a structured experimental thesis.
Within the comprehensive thesis on ELISA types, this guide details the four core methodologies that form the foundation of enzyme-linked immunosorbent assay (ELISA) technology. These techniques are indispensable for researchers, scientists, and drug development professionals for detecting and quantifying proteins, antibodies, and antigens with high specificity and sensitivity. Each pillar offers distinct advantages tailored to different experimental requirements, from simple antigen detection to complex competitive inhibition assays.
Core Methodologies and Comparative Analysis
Direct ELISA
This format involves a single, labeled primary antibody. The antigen is immobilized directly onto the polystyrene microplate well. A conjugated detection antibody (typically with an enzyme like HRP) is then added, which binds specifically to the antigen. A substrate is added to produce a measurable signal proportional to the antigen amount.
- Key Advantage: Speed and simplicity, with minimal steps and no cross-reactivity from secondary antibodies.
- Primary Disadvantage: Lower signal amplification and potential need for labeling every primary antibody.
Indirect ELISA
This method uses two antibodies: an unlabeled primary antibody that binds the immobilized antigen, and an enzyme-conjugated secondary antibody that recognizes the Fc region of the primary antibody.
- Key Advantage: High signal amplification due to multiple secondary antibodies binding to a single primary, and flexibility as the same labeled secondary can be used with various primary antibodies.
- Primary Disadvantage: Potential for cross-reactivity and longer procedure time.
Sandwich ELISA
Requires two antibodies that bind to different, non-overlapping epitopes on the target antigen. The capture antibody is first immobilized on the plate. The antigen sample is added and captured. A detection antibody (direct or indirect format) is then used to complete the "sandwich," enabling quantification.
- Key Advantage: High specificity and sensitivity, excellent for complex samples as antigen does not need purification prior to assay.
- Primary Disadvantage: Requires two matched antibodies, increasing development complexity and cost.
Competitive ELISA
Used primarily for detecting small antigens or haptens with limited epitopes. The sample antigen and a labeled reference antigen compete for a limited number of binding sites on a capture antibody. The signal is inversely proportional to the concentration of antigen in the sample.
- Key Advantage: Robust for small molecules, less susceptible to sample matrix effects, and effective for detecting antigen in complex mixtures.
- Primary Disadvantage: More complex data interpretation, as less signal indicates more target analyte.
Quantitative Comparison of ELISA Formats
Table 1: Core Characteristics of the Four ELISA Pillars
| Parameter | Direct ELISA | Indirect ELISA | Sandwich ELISA | Competitive ELISA |
|---|---|---|---|---|
| Complexity | Low | Medium | High | High |
| Time to Result | ~2 hours | ~3 hours | ~4 hours | ~3-4 hours |
| Sensitivity | Low (ng-pg range) | High (pg-fg range) | Highest (pg-fg range) | High (pg range) |
| Specificity | Moderate | High | Very High | High |
| Signal Amplification | None | High | Very High | None |
| Antigen Requirement | Must be adsorbable | Must be adsorbable | Must have ≥2 epitopes | Can be small haptens |
| Key Application | Antigen screening, simple detection | Antibody detection, immunogenicity | Cytokine/quantitative protein analysis | Hormone, drug, small molecule detection |
Table 2: Typical Reagent Consumption per 96-well Plate
| Reagent | Direct ELISA | Indirect ELISA | Sandwich ELISA | Competitive ELISA |
|---|---|---|---|---|
| Coating Antibody | - | - | 10 µg | 10 µg |
| Capture Antigen | 1-10 µg | 1-10 µg | - | 1-10 µg |
| Primary Antibody | 0.5-1 µg (conjugated) | 0.1-0.5 µg | 0.5-1 µg | 0.5-1 µg |
| Secondary Antibody | - | 0.1-0.2 µg (conjugated) | 0.1-0.2 µg (conjugated) | - |
| Sample Volume | 50-100 µL | 50-100 µL | 50-100 µL | 50-100 µL |
| Enzyme Substrate | 100 µL | 100 µL | 100 µL | 100 µL |
Detailed Experimental Protocols
Protocol 1: Indirect ELISA for Antibody Titer Determination
Objective: To determine the concentration of a specific antibody in serum.
- Coating: Dilute purified antigen in carbonate-bicarbonate coating buffer (pH 9.6) to 1-10 µg/mL. Add 100 µL per well of a 96-well plate. Incubate overnight at 4°C.
- Washing: Aspirate and wash plate 3x with 300 µL/well PBS containing 0.05% Tween-20 (PBST).
- Blocking: Add 200 µL/well of blocking buffer (e.g., 5% non-fat dry milk or 1% BSA in PBST). Incubate for 1-2 hours at room temperature (RT). Wash 3x with PBST.
- Primary Antibody Incubation: Serially dilute test serum samples in blocking buffer. Add 100 µL/well. Include negative control (blocking buffer) and positive control. Incubate 1-2 hours at RT. Wash 3x.
- Secondary Antibody Incubation: Add 100 µL/well of enzyme-conjugated secondary antibody (e.g., HRP-anti-species IgG) diluted in blocking buffer. Incubate for 1 hour at RT. Wash 3-5x thoroughly.
- Detection: Add 100 µL/well of chromogenic substrate (e.g., TMB). Incubate for 10-30 minutes in the dark.
- Stop & Read: Add 50 µL/well of stop solution (e.g., 1M H₂SO₄). Measure absorbance immediately at 450 nm using a plate reader.
Protocol 2: Sandwich ELISA for Cytokine Quantification
Objective: To quantify a specific cytokine in cell culture supernatant.
- Capture Antibody Coating: Dilute anti-cytokine capture antibody in PBS to 2-4 µg/mL. Coat plates with 100 µL/well. Seal and incubate overnight at 4°C.
- Wash & Block: Wash plate 3x with PBST. Block with 200 µL/well of assay diluent (e.g., 10% FBS in PBS) for 1 hour at RT. Wash 3x.
- Sample & Standard Incubation: Prepare a standard curve using recombinant cytokine in assay diluent (e.g., 2-fold dilutions from 1000 pg/mL). Add 100 µL of standards or samples per well. Incubate for 2 hours at RT. Wash 5x.
- Detection Antibody Incubation: Add 100 µL/well of biotinylated anti-cytokine detection antibody at recommended dilution. Incubate for 1-2 hours at RT. Wash 5x.
- Enzyme Conjugate Incubation: Add 100 µL/well of Streptavidin-HRP conjugate. Incubate for 20-30 minutes at RT. Wash 7x.
- Detection & Analysis: Add substrate, stop, and read as in Protocol 1. Plot standard curve absorbance vs. concentration and interpolate sample values.
Protocol 3: Competitive ELISA for Small Molecule Detection
Objective: To measure the concentration of a small molecule drug in plasma.
- Coating: Coat plate with a drug-protein conjugate (e.g., drug-BSA) in coating buffer. Incubate overnight at 4°C. Wash and block as in Protocol 1.
- Competition Reaction: In separate tubes, pre-mix a constant, limiting amount of anti-drug primary antibody with serially diluted drug standards or unknown samples. Incubate for 1 hour at 37°C to allow competition for antibody binding sites.
- Transfer to Plate: Transfer 100 µL of each antibody-analyte mixture to the coated plate. Free antibody will bind to immobilized drug on the plate. Incubate for 1 hour at RT. Wash 5x.
- Secondary Antibody Detection: Add enzyme-conjugated secondary antibody. Incubate and wash.
- Detection & Analysis: Develop with substrate, stop, and read. Higher sample drug concentration leads to less antibody bound to the plate and a lower signal.
Visualizing ELISA Workflows
Direct ELISA Workflow
Indirect ELISA Workflow
Sandwich ELISA Workflow Note: If detection antibody is not pre-conjugated, an indirect step with a labeled secondary is required.
Competitive ELISA Principle
The Scientist's Toolkit: Essential Research Reagent Solutions
Table 3: Key Reagents and Materials for ELISA
| Reagent / Material | Function & Purpose | Common Examples / Notes |
|---|---|---|
| Microplate | Solid phase for immobilization of biomolecules. | Polystyrene, 96-well; High-binding plates for proteins, medium-binding for sticky molecules. |
| Coating Buffer | Provides optimal pH and ionic strength for passive adsorption. | Carbonate-Bicarbonate buffer (pH 9.6) is standard. PBS (pH 7.4) for some antibodies. |
| Blocking Buffer | Saturates unoccupied binding sites to minimize non-specific background. | 1-5% BSA, 5% non-fat dry milk, or proprietary protein blockers in PBS/TBS with detergent. |
| Wash Buffer | Removes unbound reagents while maintaining assay conditions. | PBS or TBS with 0.05-0.1% Tween 20 (PBST/TBST). |
| Detection Antibodies | Provide specificity and signal generation. | Primary (monoclonal/polyclonal) and enzyme-conjugated secondary (anti-IgG, HRP/ALP label). |
| Chromogenic Substrate | Enzymatic conversion produces measurable color change. | TMB (Tetramethylbenzidine - blue, read at 450nm), OPD (o-Phenylenediamine - yellow, 492nm). |
| Stop Solution | Halts enzyme reaction, stabilizes final signal. | 1M H₂SO₄ (for TMB), 1M HCl (for OPD). |
| Plate Reader | Quantifies absorbance (optical density) of each well. | Filter-based or monochromator-based spectrophotometers capable of reading 96/384-well plates. |
| Assay Diluent | Matrix for diluting samples/standards to match assay conditions. | Often contains a protein base (BSA, serum) and detergent to reduce non-specific interactions. |
| Streptavidin-Biotin System | Signal amplification system for high-sensitivity assays. | Biotinylated detection antibody + Streptavidin-HRP conjugate. |
| Recombinant Protein Standards | Provides known quantities for generating a standard curve for quantification. | Highly pure, characterized antigen for accurate calibration. |
ELISA Protocol Deep Dive: Step-by-Step Methods, Applications, and Data Interpretation
Within the broader thesis of immunoassay methodologies, ELISA (Enzyme-Linked Immunosorbent Assay) represents a cornerstone technique for analyte detection. Direct ELISA, the simplest format, is characterized by the use of a single, target-specific primary antibody that is directly conjugated to a reporter enzyme. This direct detection scheme positions it as a rapid and streamlined option, particularly suited for scenarios where target antigen is abundant and cross-reactivity is not a primary concern.
Detailed Protocol for Direct ELISA
Principle: The target antigen is immobilized directly onto a polystyrene microplate well. A conjugated primary antibody (enzyme-linked) is then added, which binds specifically to the immobilized antigen. After washing, a chromogenic substrate is added, and the enzymatic reaction produces a measurable signal proportional to the amount of antigen present.
Step-by-Step Methodology:
- Coating: Dilute the antigen of interest in a suitable carbonate/bicarbonate coating buffer (pH 9.6) to a concentration typically ranging from 1–10 µg/mL. Add 50–100 µL per well to a 96-well microplate. Seal the plate and incubate overnight at 4°C or for 1–2 hours at 37°C.
- Washing: Discard the coating solution. Wash the plate three times with 200–300 µL of wash buffer (e.g., PBS containing 0.05% Tween 20, PBS-T) per well. Blot plate on absorbent paper to remove residual liquid.
- Blocking: Add 150–200 µL of blocking buffer (e.g., 1–5% BSA or non-fat dry milk in PBS) to each well to occupy any remaining protein-binding sites. Incubate for 1–2 hours at 37°C or overnight at 4°C. Wash as in Step 2.
- Primary Antibody Incubation: Dilute the enzyme-conjugated primary antibody in blocking buffer or PBS-T. The optimal concentration must be determined by titration but often falls in the 0.1–1.0 µg/mL range. Add 50–100 µL per well. Incubate for 1–2 hours at 37°C. Wash thoroughly 3–5 times.
- Detection: Prepare the appropriate substrate solution (e.g., TMB for HRP, pNPP for AP). Add 50–100 µL per well. Incubate in the dark at room temperature for a defined period (e.g., 5–30 minutes).
- Signal Measurement: Stop the reaction by adding a stop solution (e.g., 1M H₂SO₄ for TMB). Immediately measure the absorbance of each well using a microplate reader at the appropriate wavelength (e.g., 450 nm for TMB, 405 nm for pNPP).
Quantitative Advantages in Speed and Simplicity
The primary advantage of the direct ELISA format is its procedural speed, stemming from fewer incubation and wash steps compared to indirect or sandwich formats. This results in a significantly shorter total hands-on and assay time.
Table 1: Comparative Assay Timeline of Common ELISA Formats
| Step | Direct ELISA | Indirect ELISA | Sandwich ELISA |
|---|---|---|---|
| Primary Incubation | 1 step (Conjugated Prim. Ab) | 1 step (Unconjugated Prim. Ab) | 2 steps (Capture Ab then Antigen) |
| Secondary Incubation | Not Required | 1 step (Conjugated Sec. Ab) | 1 step (Detection Ab) |
| Typical Total Incubation Time | 2–3 hours | 4–5 hours | 5–8 hours |
| Total Number of Wash Steps | ~5–7 | ~7–9 | ~9–12 |
Applications for High-Abundance Targets
The simplicity of direct ELISA comes with trade-offs, primarily lower sensitivity and the need for conjugated primary antibodies for every target. Therefore, its optimal applications are:
- Screening of Protein Expression: Rapid confirmation of high-level recombinant protein expression in bacterial or eukaryotic systems.
- Quality Control: Checking the concentration and integrity of purified proteins (e.g., vaccine antigens, enzyme preparations) where levels are high.
- Detection of Abundant Serum Proteins: Measuring major serum components like albumin or immunoglobulins in diagnostic samples.
- Viral Titer Determination: Quantifying high-concentration viral stocks in cell culture supernatants using antibodies against viral coat proteins.
Table 2: Suitability of Direct ELISA Based on Target Abundance
| Target Abundance Level | Example Targets | Recommended ELISA Format | Justification |
|---|---|---|---|
| Very High (> 1 µg/mL) | Recombinant His-tagged protein, IgG in ascites, Viral lysate | Direct ELISA | Speed is paramount; sensitivity is not limiting. |
| High (100 ng/mL – 1 µg/mL) | Cytokines in stimulated cell lysate, Serum albumin | Direct or Indirect ELISA | Direct may suffice; indirect offers potential for signal amplification if needed. |
| Low to Moderate (< 100 ng/mL) | Serum cytokines, Phospho-specific epitopes, Hormones | Indirect or Sandwich ELISA | Require the signal amplification (indirect) or enhanced specificity/sensitivity (sandwich). |
Workflow and Pathway Visualization
Diagram 1: Direct ELISA Procedural Workflow
Diagram 2: Direct ELISA Signal Generation Pathway
The Scientist's Toolkit: Key Research Reagent Solutions
Table 3: Essential Materials for a Direct ELISA Experiment
| Reagent/Material | Function & Critical Consideration |
|---|---|
| High-Binding Polystyrene Microplate | Provides a surface for passive adsorption of antigen. Must be chosen for optimal protein binding capacity. |
| Purified Antigen | The target molecule for detection. Purity and stability are crucial for specific coating. |
| Coating Buffer (Carbonate-Bicarbonate, pH 9.6) | Alkaline buffer that enhances electrostatic interaction between the plate and most proteins, improving adsorption efficiency. |
| Enzyme-Conjugated Primary Antibody | The core detection reagent. Must be highly specific and possess a high specific activity (enzyme:antibody ratio). Common conjugates: HRP (Horseradish Peroxidase) or AP (Alkaline Phosphatase). |
| Blocking Agent (BSA, Casein, Non-Fat Dry Milk) | Proteins used to saturate non-specific binding sites on the plate, reducing background noise. Must be non-reactive with the detection system. |
| Wash Buffer (PBS with 0.05% Tween 20, PBS-T) | Removes unbound reagents. The detergent (Tween 20) reduces non-specific binding. |
| Enzyme Substrate (TMB, pNPP) | Chromogenic compound cleaved by the reporter enzyme to produce a measurable color change. TMB (for HRP) is a sensitive, common choice. |
| Stop Solution (e.g., 1M H₂SO₄) | Rapidly halts the enzyme-substrate reaction at a defined endpoint, stabilizing the signal for measurement. |
| Microplate Spectrophotometer | Instrument to quantitatively measure the absorbance (Optical Density, OD) of the colored product in each well. |
Within the broader taxonomy of enzyme-linked immunosorbent assay (ELISA) formats, the indirect ELISA with signal amplification represents a critical evolution for serological applications. This format is distinguished by its two-stage detection system: an unlabeled primary antibody (from the sample) is first captured, followed by an enzyme-conjugated secondary antibody directed against the primary antibody's species/isotype. The incorporation of additional amplification steps, such as biotin-streptavidin systems or tyramide signal amplification (TSA), further enhances sensitivity, making it the preeminent choice for detecting low-abundance antibodies in sera, such as those against viral pathogens, autoantigens, or following vaccination.
Core Principle and Amplified Signaling Pathways
Diagram Title: Indirect ELISA with Biotin-Streptavidin Amplification Workflow
Detailed Experimental Protocol
Reagent Preparation & Coating
- Coating: Dilute purified antigen in carbonate-bicarbonate coating buffer (50 mM, pH 9.6) to an optimal concentration (typically 1-10 µg/mL). Add 100 µL/well to a 96-well microplate.
- Incubation: Seal plate and incubate overnight at 4°C (or 1-2 hours at 37°C).
- Washing: Aspirate coating solution. Wash plate 3x with 300 µL/well of Wash Buffer (PBS or Tris-based with 0.05% Tween 20, pH 7.4). Blot dry on absorbent paper.
Blocking
- Add 200-300 µL/well of blocking buffer (e.g., 5% non-fat dry milk or 1% BSA in Wash Buffer).
- Incubate for 1-2 hours at room temperature (RT) or 37°C.
- Wash as in step 1.3.
Primary Antibody (Sample) Incubation
- Prepare serial dilutions of test serum/plasma in sample diluent (blocking buffer or commercial diluent).
- Add 100 µL/well of diluted samples, controls (positive, negative), and blank (diluent only).
- Incubate for 1-2 hours at RT or 37°C.
- Wash 3-5x thoroughly.
Amplified Detection System Incubation
Option A: Standard Enzyme-Linked Secondary Antibody
- Add 100 µL/well of species/isotype-specific antibody conjugated to HRP (or AP), diluted per manufacturer's instructions.
- Incubate 1 hour at RT, protected from light.
- Wash 5x.
Option B: Biotin-Streptavidin Amplification (Recommended for High Sensitivity)
- Add 100 µL/well of biotinylated secondary antibody, diluted in diluent. Incubate 1 hour at RT. Wash 5x.
- Add 100 µL/well of streptavidin-poly-HRP conjugate (e.g., streptavidin linked to a polymer of HRP enzymes). Incubate 30 minutes at RT, protected from light. Wash 5-7x stringently.
Signal Development and Readout
- Prepare enzyme substrate immediately before use:
- For HRP: TMB (3,3',5,5'-Tetramethylbenzidine). Stop solution: 1M H₂SO₄ or HCl.
- For AP: pNPP (p-Nitrophenyl Phosphate). Stop solution: 1M NaOH.
- Add 100 µL substrate/well. Incubate in the dark at RT for 5-30 minutes (monitor development).
- Add 50-100 µL stop solution/well.
- Read absorbance immediately on a plate reader at appropriate wavelength (TMB: 450 nm; pNPP: 405 nm).
Data Analysis
- Subtract blank (background) absorbance from all values.
- Plot mean absorbance of duplicate/triplicate wells against serum dilution or calculate units relative to a standard curve.
- Determine cut-off value (typically mean of negative controls + 3 standard deviations). Samples with absorbance above cut-off are considered positive.
The Scientist's Toolkit: Essential Research Reagent Solutions
| Reagent / Material | Function & Critical Notes |
|---|---|
| High-Binding Polystyrene Plate | Optimal passive adsorption of hydrophobic antigens. |
| Purified Antigen (Recombinant/Viral Lysate) | The capture target; purity is critical for specificity. |
| Carbonate-Bicarbonate Buffer (pH 9.6) | High pH enhances protein binding to plastic. |
| Blocking Agent (BSA, Casein, Serum) | Covers non-specific binding sites to reduce background. |
| Wash Buffer (PBS/TBS + 0.05% Tween 20) | Removes unbound reagents; detergent minimizes non-specific binding. |
| Reference Sera (Positive/Negative) | Essential assay controls for validation and cut-off calculation. |
| Biotinylated Secondary Antibody | High-affinity binder with multiple biotin tags for amplification. |
| Streptavidin-Poly-HRP Conjugate | Amplification hub; one streptavidin binds multiple biotins, each poly-HRP carries many enzyme molecules. |
| Chromogenic Substrate (TMB/pNPP) | Enzyme catalyzes color change; sensitivity differs. TMB is most common for HRP. |
| Microplate Spectrophotometer | Quantifies colorimetric signal at specific wavelengths. |
Performance Data & Comparative Analysis
Table 1: Comparison of Indirect ELISA Detection Systems
| Parameter | Standard Indirect ELISA (HRP-Secondary) | Amplified Indirect ELISA (Biotin-Streptavidin-Poly-HRP) | Tyramide Signal Amplification (TSA) |
|---|---|---|---|
| Typical Limit of Detection (LOD) | ~0.1 - 1 ng/mL specific Ab | ~1 - 10 pg/mL specific Ab | <0.1 pg/mL specific Ab |
| Signal:Noise Ratio | Moderate (10:1 - 50:1) | High (50:1 - 200:1) | Very High (200:1 - 1000:1) |
| Dynamic Range | 2-3 logs | 3-4 logs | 4-5+ logs |
| Incubation Time (Detection Step) | 60 min | 90 min (60 + 30) | 90-120 min (multi-step) |
| Key Advantage | Simplicity, speed | Excellent sensitivity/robustness | Extreme sensitivity for rare antibodies |
| Key Disadvantage | Lower sensitivity | Potential for high background if washing is inadequate | Complex protocol, expensive reagents |
Table 2: Representative Serological Applications
| Disease Target | Antigen Type | Typical Sample | Amplification Used? | Clinical/Research Utility |
|---|---|---|---|---|
| SARS-CoV-2 | Spike RBD, Nucleocapsid | Human serum/plasma | Yes (Biotin-Streptavidin) | Seroprevalence, vaccine response |
| HIV | gp41, p24 | Human serum | Yes | Diagnosis, monitoring |
| Autoimmune (e.g., ANA) | dsDNA, Histones | Human serum | Sometimes | Diagnosis of SLE |
| Lyme Disease | VlsE, OspC | Human serum | Yes | Confirmatory testing |
| Monoclonal Antibody Screening | Target protein | Hybridoma supernatant | No (Primary screen) | High-throughput clone selection |
Advanced Protocol: Tyramide Signal Amplification (TSA) Integration
For ultra-sensitive detection, integrate TSA after the biotin-streptavidin step:
- After streptavidin-HRP incubation and washing, add 100 µL/well of biotinyl-tyramide or fluorophore-tyramide solution.
- Incubate for 5-10 minutes. The HRP catalyzes the deposition of numerous labeled tyramide molecules onto nearby proteins.
- Wash thoroughly.
- For colorimetric readout: Add streptavidin-poly-HRP (again) followed by TMB substrate. For fluorescent readout: Directly read fluorescence if fluorophore-tyramide was used.
Diagram Title: Tyramide Signal Amplification (TSA) Mechanism
Troubleshooting and Optimization
- High Background: Increase wash frequency/volume, change blocking agent (switch to BSA if using serum), decrease concentration of detection conjugates.
- Low Signal: Check antigen coating efficiency (increase concentration/time), confirm secondary antibody specificity and activity, optimize incubation times/temperatures, switch to an amplified system.
- High Variation (Poor Replicates): Ensure consistent washing, check pipette calibration, mix all reagents thoroughly before addition, avoid plate edge effects by using outer wells for controls only.
The indirect ELISA with signal amplification is a cornerstone technique in modern serology, offering an optimal balance of specificity, sensitivity, and scalability. Its adaptability—from standard to biotin-streptavidin to TSA-enhanced formats—allows researchers to tailor the assay precisely to the required detection threshold and dynamic range for applications ranging from infectious disease serology to immunogenicity testing in drug development.
The Enzyme-Linked Immunosorbent Assay (ELISA) is a foundational technique in quantitative biochemistry. Within the taxonomy of ELISA types—including direct, indirect, and competitive formats—the sandwich ELISA stands out for its exceptional specificity and sensitivity. This makes it the gold standard for quantifying low-abundance analytes, such as cytokines, growth factors, and other biomarkers, directly from complex biological matrices like serum, plasma, cell culture supernatants, and tissue homogenates. This guide details a high-sensitivity protocol optimized for such challenging applications, providing researchers with the methodological depth required for robust and reproducible data in drug development and biomedical research.
Principle and Advantage of Sandwich ELISA
The sandwich configuration employs two antibodies that bind to distinct, non-overlapping epitopes on the target analyte. The capture antibody is immobilized on a solid phase (typically a microplate well) and binds the analyte from the sample. After washing, a detection antibody, conjugated to an enzyme (e.g., Horseradish Peroxidase, HRP), binds to a different epitope on the captured analyte, forming the "sandwich." Following another wash, a substrate is added, and the resulting enzymatic signal is proportional to the analyte concentration.
Key Advantages for Complex Samples:
- High Specificity: Two epitope recognitions minimize cross-reactivity.
- High Sensitivity: Effective concentration of the analyte from the sample onto the plate and reduced background from sample matrix.
- Tolerance for Complex Matrices: Sample impurities are removed during washes, allowing quantification in serum, plasma, etc.
High-Sensitivity Protocol: A Step-by-Step Guide
Stage 1: Plate Coating & Blocking
- Coating: Dilute the capture antibody in a carbonate/bicarbonate coating buffer (pH 9.6). Add 50-100 µL per well to a high-binding polystyrene microplate. Seal and incubate overnight at 4°C.
- Washing: Aspirate and wash the plate 3 times with 300 µL of wash buffer (e.g., PBS with 0.05% Tween-20, PBST). Blot thoroughly on absorbent paper.
- Blocking: Add 200-300 µL of blocking buffer (e.g., 1% BSA or 5% non-fat dry milk in PBST) per well. Incubate for 1-2 hours at room temperature (RT). Wash as in Step 2.
Stage 2: Sample and Standard Incubation
- Standard Curve: Prepare a serial dilution (typically 2-fold or 10-fold) of the recombinant analyte in the same matrix as the unknown samples (e.g., diluted serum) to account for matrix effects.
- Incubation: Add 100 µL of standards, samples, and appropriate controls (blank, spike-recovery) per well. Incubate for 2 hours at RT or overnight at 4°C for maximum sensitivity. Wash 3-5 times.
Stage 3: Detection Antibody Incubation
- Add the enzyme-conjugated detection antibody (diluted in blocking buffer) at the manufacturer's recommended concentration (typically 50-100 µL/well).
- Incubate for 1-2 hours at RT, protected from light. Wash 3-5 times thoroughly.
Stage 4: Signal Development and Readout
- Substrate Addition: Add 100 µL of chromogenic (e.g., TMB for HRP) or chemiluminescent substrate per well. Incubate for 5-30 minutes in the dark.
- Stop (for Chromogenic): Add 50-100 µL of stop solution (e.g., 1M H₂SO₄ for TMB).
- Measurement: Read absorbance immediately (e.g., 450 nm for TMB) or measure luminescence.
Stage 5: Data Analysis
- Subtract the average blank (zero standard) value from all standard and sample readings.
- Generate a 4- or 5-parameter logistic (4PL/5PL) standard curve using appropriate software.
- Interpolate sample concentrations from the curve.
Critical Enhancements for Sensitivity & Reproducibility
- Antibody Pair Selection: Use monoclonal/polyclonal or two high-affinity monoclonal antibodies from different host species to prevent cross-reactivity.
- Signal Amplification: Employ biotin-streptavidin systems (biotinylated detection antibody + streptavidin-HRP) for significant signal enhancement.
- Modified Substrates: Use enhanced chemiluminescent (ECL) substrates for HRP, which offer a wider dynamic range and higher sensitivity than chromogenic substrates.
- Extended Incubations: Overnight incubation of samples at 4°C increases binding efficiency.
- Sample Pre-treatment: Dilute samples in assay buffer to minimize matrix interference. For some targets, filtration or pre-clearing may be necessary.
Data Presentation: Key Performance Metrics
Table 1: Comparison of Substrate Systems for High-Sensitivity Sandwich ELISA
| Substrate Type | Example | Detection Limit (Typical) | Dynamic Range | Readout Method |
|---|---|---|---|---|
| Chromogenic | TMB (HRP) | 1-10 pg/mL | ~2 logs | Absorbance (450 nm) |
| Enhanced Chemiluminescent | Amersham ECL Prime | 0.1-1 pg/mL | 3-4 logs | Luminescence |
| Electrochemiluminescent | MSD SULFO-TAG | <0.1 pg/mL | >4 logs | Electrochemiluminescence |
Table 2: Impact of Protocol Modifications on Assay Sensitivity (Representative Data for IL-6)
| Protocol Modification | Standard (2h RT sample incub.) | Enhanced (Overnight 4°C incub.) | Amplified (Biotin-Streptavidin + ECL) |
|---|---|---|---|
| Lower Limit of Detection (LLOD) | 3.5 pg/mL | 1.2 pg/mL | 0.25 pg/mL |
| Upper Limit of Quantification | 250 pg/mL | 200 pg/mL | 1000 pg/mL |
| %CV (Inter-assay) | 12% | 10% | 8% |
The Scientist's Toolkit: Research Reagent Solutions
Table 3: Essential Materials for High-Sensitivity Sandwich ELISA
| Item | Function & Critical Consideration |
|---|---|
| Matched Antibody Pair | Pre-optimized capture and detection antibodies specific to the target analyte, ensuring no epitope overlap. |
| High-Binding 96-Well Plate | Polystyrene plates with high protein-binding capacity for efficient capture antibody immobilization. |
| Blocking Buffer (Protein-Based) | 1-5% BSA or casein in wash buffer to prevent non-specific binding of proteins to coated wells. |
| Wash Buffer (PBST) | Phosphate-buffered saline with a mild detergent (Tween-20) to remove unbound material while preserving the immune complex. |
| Recombinant Protein Standard | Highly pure, quantified analyte for generating the standard curve. Must be compatible with the antibody pair. |
| Biotin-Streptavidin System | Signal amplification system: Biotinylated detection antibody binds multiple enzyme-conjugated streptavidin molecules. |
| Enhanced Chemiluminescent (ECL) Substrate | A luminol-based substrate for HRP that produces a sustained, high-intensity light signal for low-level detection. |
| Microplate Reader | Instrument capable of measuring absorbance (for chromogenic) or luminescence (for ECL/chemiluminescent assays). |
Visualized Workflows and Relationships
Title: High-Sensitivity Sandwich ELISA Procedural Workflow
Title: Strategic Pathways to Enhance ELISA Sensitivity
Title: Decision Logic for High-Sensitivity Protocol Application
The Enzyme-Linked Immunosorbent Assay (ELISA) represents a cornerstone technique in quantitative immunoanalysis. Within the broader thesis of ELISA formats, Competitive ELISA (also termed Inhibition ELISA) serves a unique and critical function, particularly for the detection of low molecular weight (<1000 Da) analytes. Unlike direct or sandwich ELISA formats which require two distinct epitopes for capture and detection, competitive formats are ideal for small molecules, haptens, and drugs that possess a single antigenic determinant. In this format, the analyte of interest competes with a labeled analog for a limited number of antibody binding sites. The resulting signal is inversely proportional to the analyte concentration, enabling precise quantification crucial for therapeutic drug monitoring, toxicology, and biomarker analysis.
Core Principle and Signaling Pathway
Title: Competitive ELISA Principle and Signal Generation
Detailed Experimental Protocol
Materials and Reagents Preparation
- Coating Antigen: Hapten-Keyhole Limpet Hemocyanin (KLH) or Bovine Serum Albumin (BSA) conjugate (1-10 µg/mL in carbonate-bicarbonate buffer, pH 9.6).
- Blocking Buffer: 1-5% BSA or 5% non-fat dry milk in PBS with 0.05% Tween 20 (PBST).
- Primary Antibody: Monoclonal or polyclonal antibody specific to the target hapten/small molecule. Optimal dilution (e.g., 1:1000 to 1:50000) determined by checkerboard titration.
- Analyte Standard Series: Prepare serial dilutions of the pure drug/small molecule in appropriate matrix (e.g., PBS, assay buffer, or negative serum).
- Enzyme-Conjugated Tracer: Hapten conjugated to Horseradish Peroxidase (HRP) or Alkaline Phosphatase (ALP). Use at optimal dilution.
- Wash Buffer: 1X PBS with 0.05% Tween 20.
- Substrate: TMB (3,3',5,5'-Tetramethylbenzidine) for HRP or pNPP (p-Nitrophenyl Phosphate) for ALP.
- Stop Solution: 2M H₂SO₄ (for TMB) or 3M NaOH (for pNPP).
Step-by-Step Procedure
Day 1: Coating and Blocking
- Coat the wells of a 96-well microplate with 100 µL of coating antigen solution. Seal and incubate overnight at 4°C.
- Aspirate the coating solution and wash the plate three times with wash buffer (300 µL/well) using a plate washer or manual pipetting.
- Add 300 µL of blocking buffer to each well. Incubate for 1-2 hours at room temperature (RT) or 37°C.
- Aspirate and wash three times as before.
Day 2: Competition and Detection
- Competition Step: To each well, add 50 µL of either the standard analyte or unknown sample. Immediately add 50 µL of the primary antibody solution. For controls, include a maximum binding control (no analyte, antibody only) and a blank (no antibody, no analyte). Shake gently and incubate for 1-2 hours at RT or 37°C.
- Aspirate and wash plate 3-5 times thoroughly.
- Add 100 µL of the enzyme-conjugated tracer (hapten-HRP/ALP) to each well. Incubate for 1 hour at RT.
- Aspirate and wash 5 times to remove unbound tracer.
- Signal Development: Add 100 µL of substrate solution per well. Incubate in the dark for 15-30 minutes (or until desired color develops).
- Stop the reaction by adding 100 µL of stop solution.
- Read the absorbance immediately using a microplate reader (e.g., 450 nm for TMB, 405 nm for pNPP).
Data Analysis Workflow
Title: Competitive ELISA Data Analysis Workflow
Key Performance Data and Validation Parameters
Table 1: Typical Validation Parameters for a Competitive ELISA for Drug Monitoring
| Parameter | Target Value / Description | Example Data (Theophylline Assay) |
|---|---|---|
| Dynamic Range | Linear or logistic region of the standard curve | 0.5 – 50 µg/mL |
| Limit of Detection (LoD) | Mean blank + 3(SD) | 0.2 µg/mL |
| Limit of Quantification (LoQ) | Mean blank + 10(SD) or CV <20% | 0.5 µg/mL |
| Intra-Assay Precision (CV%) | Repeatability within a single run | <8% |
| Inter-Assay Precision (CV%) | Reproducibility across different runs | <12% |
| Accuracy (% Recovery) | Measured concentration vs. Spiked known concentration | 85-115% |
| Cross-Reactivity | % Signal inhibition by structural analogs | <5% for major metabolites |
| Matrix Effect | Signal comparison in buffer vs. biological matrix | Recovery within 15% in serum |
Table 2: Comparison of ELISA Formats for Different Analyte Types
| Format | Ideal Analyte Size | Epitopes Required | Signal vs. Concentration | Best For |
|---|---|---|---|---|
| Direct/Indirect | Proteins, Viruses, Cells | One | Directly Proportional | Antibody screening, pathogen detection |
| Sandwich | Large Proteins (>10 kDa) | Two (non-overlapping) | Directly Proportional | Cytokines, hormones, complex antigens |
| Competitive/Inhibition | Small Molecules, Haptens (<1 kDa) | One | Inversely Proportional | Drugs, toxins, hormones (T3, cortisol) |
The Scientist's Toolkit: Research Reagent Solutions
Table 3: Essential Materials for Competitive ELISA Development
| Item | Function & Rationale | Example/Specifications |
|---|---|---|
| Hapten-Carrier Conjugate | Serves as the immobilized coating antigen. The carrier protein (BSA, KLH, OVA) provides sites for passive adsorption to the plate. | Theophylline-BSA conjugate, 10 mg/mL in PBS. |
| High-Affinity Monoclonal Antibody | Provides specificity. High affinity (low Kd) is critical for assay sensitivity and low LoD. | Mouse anti-digoxin IgG, clone DG-1, Kd = 1 nM. |
| Enzyme-Labeled Tracer | Competes with free analyte for antibody binding. Generates the measurable signal. | Methotrexate-HRP conjugate, RZ >3.0. |
| Chromogenic Substrate | Converted by the enzyme to a colored, measurable product. TMB is most common for HRP. | TMB Super Sensitive, single-component, ready-to-use. |
| Low-Binding Microplates | Minimizes non-specific adsorption of small molecules and antibodies, reducing background. | Polypropylene or specially treated polystyrene plates. |
| Precision Plate Washer | Ensures consistent and thorough removal of unbound reagents, critical for low background. | Automated washer with adjustable soak time and aspiration strength. |
| Spectrophotometric Plate Reader | Accurately measures the absorbance of the developed color in all wells simultaneously. | Filter-based or monochromator-based reader for 450 nm and 620 nm (reference). |
| Curve-Fitting Software | Analyzes the non-linear competitive binding data using a 4- or 5-parameter logistic model. | SoftMax Pro, GraphPad Prism, or R with drc package. |
This technical guide details the quantitative analytical core of the Enzyme-Linked Immunosorbent Assay (ELISA), a cornerstone technique in biomedical research and drug development. Framed within a comprehensive thesis on ELISA methodologies, this document provides researchers with the principles and practical protocols for transforming raw optical density (OD) readings from microplate wells into accurate, normalized analyte concentrations. The focus is on the construction and application of standard curves, data normalization strategies, and robust concentration calculation, which are fundamental to all ELISA types, including direct, indirect, sandwich, and competitive assays.
ELISA provides a powerful platform for detecting and quantifying proteins, antibodies, and hormones. The transition from analog signal (color development) to digital data (OD) and finally to a biologically meaningful concentration value is a critical multistep process. The accuracy of this process hinges on the proper generation of a standard curve using known concentrations of a reference analyte, followed by appropriate normalization of sample data to account for inter-assay variability.
The Standard Curve: Foundation of Quantification
A standard curve is a plot of OD values (response) against the known concentrations of a serially diluted standard. It defines the relationship between signal and analyte amount for a specific assay under specific conditions.
Preparation of Standard Dilutions
The standard must be a purified form of the target analyte with a known concentration. A typical 8-point standard curve is prepared via serial dilution.
Protocol: Two-Fold Serial Dilution for Standard Curve
- Materials: Standard stock solution, assay diluent (as specified in kit protocol), sterile microcentrifuge tubes, pipettes and tips.
- Procedure: a. Label eight tubes (S1-S8). Add the recommended volume of diluent to all tubes except S1. b. Prepare the top standard concentration (S1) by diluting the stock to the kit-specified highest concentration (e.g., 1000 pg/mL). c. Perform a serial dilution: Transfer an equal volume from S1 to S2, mix thoroughly. Transfer from S2 to S3, and so on, through S8. S8 serves as the zero standard (background). d. The typical dilution scheme yields concentrations as shown in Table 1.
Table 1: Example Serial Dilution Scheme for a Standard Curve
| Tube Label | Relative Dilution | Example Concentration (pg/mL) | Assay Replicates |
|---|---|---|---|
| S1 | 1:1 (Neat) | 1000 | Duplicate |
| S2 | 1:2 | 500 | Duplicate |
| S3 | 1:4 | 250 | Duplicate |
| S4 | 1:8 | 125 | Duplicate |
| S5 | 1:16 | 62.5 | Duplicate |
| S6 | 1:32 | 31.25 | Duplicate |
| S7 | 1:64 | 15.63 | Duplicate |
| S8 (Blank) | Zero Standard | 0 | Duplicate |
Curve Fitting and Model Selection
After assay completion, the mean OD for each standard is plotted against its concentration. The data is fitted using an appropriate regression model.
Table 2: Common Regression Models for ELISA Standard Curves
| Model | Equation | Best For | Key Parameter (R² Goal) |
|---|---|---|---|
| Linear | y = mx + c | Data points forming a straight line over a narrow range. | R² > 0.99 |
| Four-Parameter Logistic (4PL) | y = d + (a - d) / (1 + (x/c)^b ) | Typical sigmoidal curve with upper and lower asymptotes. Most common for ELISA. | R² > 0.99 |
| Five-Parameter Logistic (5PL) | Adds an asymmetry parameter to 4PL | Asymmetric sigmoidal curves. | R² > 0.99 |
Note: Modern ELISA analysis software typically employs 4PL or 5PL regression for optimal fit across the entire dynamic range.
Data Normalization Techniques
Normalization minimizes well-to-well and plate-to-plate variability not due to analyte concentration.
Common Normalization Methods:
- Background Subtraction: Subtract the mean OD of the zero standard (S8) or blank wells (containing only substrate) from all other OD readings.
- Positive Control Normalization: Include a control sample with known, mid-range reactivity on every plate. Express sample results as a percentage of this control's OD or calculated concentration.
- Inter-Plate Calibration: Use a normalized calibrator sample to generate a correction factor between plates in a multi-plate experiment.
Concentration Calculation
Once the standard curve equation is defined, the concentration of unknown samples (x) is calculated from their background-subtracted OD (y).
For a 4PL curve, the equation is solved for x:
x = c * ( (a - d) / (y - d) - 1 )^(1/b)
Where: a = upper asymptote, b = slope factor, c = inflection point (EC50), d = lower asymptote.
Values falling outside the standard curve range (above the top standard or below the limit of detection) should be reported as such and not extrapolated.
Experimental Workflow Diagram
Workflow: ELISA Data Analysis from OD to Concentration
Conceptual 4-Parameter Logistic (4PL) Curve Diagram
Model: 4-Parameter Logistic Regression Curve
The Scientist's Toolkit: Research Reagent Solutions
Table 3: Essential Materials for Quantitative ELISA
| Item | Function in Quantification |
|---|---|
| Recombinant Protein Standard | Purified analyte of known concentration. Serves as the reference for generating the standard curve. Must be identical or immunologically similar to the target. |
| Assay Diluent Buffer | Matrix for serial dilution of standards and samples. Typically contains proteins (e.g., BSA) to prevent non-specific binding and mimic sample matrix. |
| Microplate Reader | Spectrophotometer capable of measuring absorbance at specific wavelengths (e.g., 450 nm for TMB substrate). Precision is critical for accurate OD readings. |
| 4PL/5PL Curve-Fitting Software | Dedicated software (e.g., SoftMax Pro, GraphPad Prism, ELISA analysis modules) to perform robust nonlinear regression on standard data. |
| Precision Multi-Channel Pipettes | Enable accurate and reproducible transfer of standards and samples across the plate, minimizing technical error in replicate wells. |
| Validated ELISA Kit or Antibody Pair | For sandwich ELISAs, a matched, validated capture and detection antibody pair is essential for specific, linear signal generation proportional to analyte concentration. |
ELISA Troubleshooting Guide: Solving Common Problems and Optimizing Sensitivity & Specificity
Within the comprehensive study of ELISA types—direct, indirect, sandwich, and competitive—researchers often encounter two critical performance hurdles: poor assay sensitivity and high background signal. These issues compromise data reliability, obscuring the detection of low-abundance analytes and invalidating quantitative results. This guide systematically diagnoses root causes and prescribes corrective actions, framed within the broader optimization of immunoassay parameters.
Primary Causes and Quantitative Impact
The following table categorizes common issues, their effects on key assay parameters, and typical quantitative outcomes if unresolved.
Table 1: Impact of Common Issues on ELISA Performance
| Category | Specific Cause | Effect on Sensitivity | Effect on Background | Typical Signal Impact |
|---|---|---|---|---|
| Antibody Issues | Low affinity/avidity | Severe Reduction | Minimal | Signal ≤ 2x background |
| Non-optimal concentration (too high/low) | Reduction or Loss | Increase (if too high) | Poor standard curve (R² < 0.98) | |
| Assay Mechanics | Inadequate washing | Minimal | Severe Increase | Background OD > 0.3 |
| Overly long incubation steps | Variable | Severe Increase | High plate variability (CV > 15%) | |
| Signal Detection | Substrate over-incubation | False Increase | Severe Increase | Signal saturation at low [analyte] |
| Enzyme conjugate too concentrated | False Increase | Severe Increase | High background in blanks | |
| Plate & Reagents | Non-specific binding (NSB) | Reduction | Severe Increase | High signal in negative controls |
| Contaminated reagents | Variable | Increase | Unusual curve distortion | |
| Sample & Buffer | Sample matrix interference | Severe Reduction | Increase | Recovery rates outside 80-120% |
| Buffer pH/Ionic strength off | Reduction | Increase | Poor reproducibility |
Detailed Experimental Protocols for Diagnosis & Correction
Protocol 1: Checkerboard Titration for Optimal Reagent Concentrations Purpose: To determine the optimal pair of capture and detection antibody concentrations that maximize signal-to-noise (S/N) ratio.
- Coat a microplate with capture antibody in a two-dimensional dilution series (e.g., 0.5, 1, 2, 4 µg/mL) down the rows. Include coating buffer as blank. Incubate overnight at 4°C.
- Wash plate 3x with PBS + 0.05% Tween-20 (PBST).
- Block with 200 µL/well of 3% BSA in PBS for 1-2 hours at RT.
- Wash 3x with PBST.
- Apply antigen at a single, mid-range concentration in dilution buffer to all wells. Incubate 2 hours at RT.
- Wash 3x.
- Apply detection antibody in a 2D dilution series across columns (e.g., 0.1, 0.2, 0.4, 0.8 µg/mL). Incubate 1-2 hours at RT.
- Wash 3x.
- Apply enzyme-conjugated secondary (if needed) at recommended dilution. Incubate 1 hour at RT.
- Wash 5x.
- Develop with TMB substrate for a fixed time (e.g., 10 min). Stop with acid.
- Read absorbance. Calculate S/N for each pair. The optimal pair is the lowest concentration combination yielding the highest S/N.
Protocol 2: Systematic Investigation of High Background Purpose: To isolate the component causing non-specific binding.
- Setup Control Wells:
- A: Complete assay with all reagents + sample.
- B: Omit sample (analyte).
- C: Omit detection antibody.
- D: Omit primary and detection antibodies (Conjugate control).
- E: Substrate-only control.
- Run the standard assay protocol.
- Interpretation:
- High signal in B: NSB from detection system.
- High signal in C & D: NSB from conjugate. Optimize conjugate dilution or change blocking agent.
- High signal in E: Substrate contamination or non-specific reaction with plate/blocker.
Visualizing Workflows and Pathways
Title: High Background Diagnostic Decision Tree
Title: ELISA Specific Signal vs. Non-Specific Noise Pathways
The Scientist's Toolkit: Essential Research Reagent Solutions
Table 2: Key Reagents for Troubleshooting ELISA Performance
| Reagent / Material | Primary Function | Role in Troubleshooting |
|---|---|---|
| High-Affinity, Validated Antibody Pair | Specific capture and detection of analyte. | Foundation of assay; prevents poor sensitivity due to weak binding. |
| Bovine Serum Albumin (BSA) or Casein | Blocking agent to occupy non-specific sites. | Reduces background from protein adsorption; optimal concentration is key. |
| Tween-20 in Wash Buffer (PBST) | Non-ionic detergent. | Minimizes non-specific hydrophobic interactions; critical for low background. |
| Chromogenic Substrate (e.g., TMB) | Enzyme (HRP/AP) catalyzed color development. | Must be fresh and stable; over-incubation is a major cause of high background. |
| Precision Microplate Washer | Consistent and thorough well washing. | Inadequate washing is the most frequent cause of high, variable background. |
| Plate Reader with Kinetic Function | Measures absorbance over time. | Allows dynamic signal monitoring to identify optimal development time. |
| High-Binding, Low-NSB Microplates | Solid phase for antibody immobilization. | Ensures efficient coating and minimizes passive adsorption of reagents. |
| Heterophilic Antibody Blocking Reagent | Blocks interfering serum proteins. | Mitigates matrix interference in biological samples that causes false signals. |
Optimizing Antibody Pairs and Concentrations for Sandwich ELISA
Within the broader thesis of understanding ELISA types for biomedical research, the sandwich ELISA stands as a cornerstone for sensitive and specific antigen detection. Its performance is fundamentally governed by the precise selection and optimization of matched antibody pairs and their working concentrations. This guide provides an in-depth technical framework for researchers to systematically optimize these critical parameters, ensuring robust assay development for drug discovery and diagnostic applications.
Principles of Antibody Pair Selection
The foundational requirement for a sandwich ELISA is a matched pair of antibodies that bind to distinct, non-overlapping epitopes on the target antigen. The capture antibody is immobilized on a solid phase, while the detection antibody is conjugated to an enzyme (e.g., HRP, ALP).
Key Criteria:
- Specificity: Both antibodies must be highly specific for the target antigen with minimal cross-reactivity.
- Affinity: High-affinity antibodies (typically monoclonal) are preferred for superior sensitivity and low background.
- Epitope Compatibility: Antibodies must bind simultaneously without steric hindrance. Epitope mapping or pilot pairing experiments are essential.
- Isotype: For monoclonal pairs, using antibodies of different subclasses (e.g., mouse IgG1 for capture, mouse IgG2a for detection) can reduce cross-reactivity in subsequent steps.
Experimental Protocol for Antibody Pair Screening
A checkerboard titration is the gold standard method for identifying the optimal combination of capture and detection antibody concentrations.
Materials:
- Purified target antigen at a known concentration.
- Candidate capture and detection antibodies.
- ELISA microplate (e.g., high-binding polystyrene).
- Coating Buffer (0.05 M Carbonate-Bicarbonate, pH 9.6).
- Blocking Buffer (e.g., 1-5% BSA or casein in PBS).
- Wash Buffer (PBS with 0.05% Tween 20, PBST).
- Detection Antibody Diluent.
- Enzyme Substrate (e.g., TMB for HRP).
- Stop Solution (e.g., 1M H2SO4).
- Plate reader.
Procedure:
- Coating: Dilute each candidate capture antibody in coating buffer across a range of concentrations (e.g., 0.5, 1, 2, 4 µg/mL). Add 100 µL/well to the plate. Incubate overnight at 4°C.
- Washing: Wash plate 3x with PBST.
- Blocking: Add 300 µL/well of blocking buffer. Incubate 1-2 hours at room temperature (RT). Wash 3x.
- Antigen Addition: Add a fixed, moderate concentration of purified antigen (e.g., mid-point of expected detection range) in diluent buffer. Incubate 2 hours at RT. Wash 3x.
- Detection Antibody Titration: For each capture antibody condition, titrate each candidate detection antibody (e.g., 0.1, 0.25, 0.5, 1 µg/mL). Add 100 µL/well. Incubate 1-2 hours at RT. Wash 3-5x.
- Enzyme Conjugate: If the detection antibody is not directly conjugated, add an appropriate enzyme-labeled secondary antibody. Incubate 1 hour at RT. Wash thoroughly.
- Substrate Development: Add enzyme substrate. Incubate for a fixed time (e.g., 10-15 minutes).
- Signal Measurement: Stop the reaction and read absorbance immediately.
Data Analysis and Optimization
The goal is to identify the pair and concentration combination that yields the highest signal-to-noise (S/N) ratio, where noise is the signal from a no-antigen control.
Optimal Point Identification: The optimal combination is typically at the point just before the signal plateau, ensuring efficient antibody usage without excess. This is visualized in the checkerboard results.
Table 1: Example Checkerboard Titration Results (Absorbance at 450nm)
| Capture [µg/mL] | Detection [0.1 µg/mL] | Detection [0.25 µg/mL] | Detection [0.5 µg/mL] | Detection [1.0 µg/mL] | Background (No Ag) |
|---|---|---|---|---|---|
| 0.5 | 0.25 | 0.55 | 0.80 | 0.95 | 0.05 |
| 1.0 | 0.45 | 0.95 | 1.35 | 1.50 | 0.06 |
| 2.0 | 0.50 | 1.10 | 1.55 | 1.65 | 0.08 |
| 4.0 | 0.52 | 1.15 | 1.60 | 1.70 | 0.10 |
Calculation of S/N Ratio for 1.0 µg/mL Capture, 0.5 µg/mL Detection: 1.35 / 0.06 = 22.5
Table 2: Derived Signal-to-Noise Ratios
| Capture [µg/mL] | Det. 0.1 µg/mL S/N | Det. 0.25 µg/mL S/N | Det. 0.5 µg/mL S/N | Det. 1.0 µg/mL S/N |
|---|---|---|---|---|
| 0.5 | 5.0 | 11.0 | 16.0 | 19.0 |
| 1.0 | 7.5 | 15.8 | 22.5 | 25.0 |
| 2.0 | 6.3 | 13.8 | 19.4 | 20.6 |
| 4.0 | 5.2 | 11.5 | 16.0 | 17.0 |
Interpretation: In this example, the combination of 1.0 µg/mL capture and 0.5 µg/mL detection offers an excellent S/N ratio (22.5) while conserving reagent. Higher detection antibody concentrations offer diminishing returns.
The Scientist's Toolkit: Essential Research Reagent Solutions
Table 3: Key Reagents for Sandwich ELISA Optimization
| Reagent | Function & Importance in Optimization |
|---|---|
| High-Affinity, Monoclonal Antibody Pairs | Essential for specificity and sensitivity. Pre-validated pairs save time but require concentration optimization. |
| Recombinant Purified Antigen | Critical as a positive control for checkerboard titrations and standard curve generation. Must be identical to the native target. |
| Low-Binding or High-Binding Microplates | Plate chemistry must be compatible with the capture antibody isotype to ensure efficient immobilization. |
| Blocking Agents (BSA, Casein, Blotto) | Reduces nonspecific binding. Different agents may be optimal for different antibody-antigen systems. |
| HRP or ALP Conjugation Kits | For labeling detection antibodies if unconjugated pairs are used. Homogeneous conjugation is vital for consistent signal. |
| Chemiluminescent or Chromogenic Substrates | Signal generation. Chemiluminescent substrates generally offer higher sensitivity and wider dynamic range. |
| Plate Washer & Precision Microplate Reader | Consistent washing is critical for low background. A sensitive reader with appropriate filters is necessary for accurate quantification. |
Critical Validation Steps Post-Optimization
Once the optimal pair and concentrations are identified, validate the assay with:
- Standard Curve: Using serial dilutions of purified antigen to determine the working range, limit of detection (LOD), and limit of quantification (LOQ).
- Specificity: Test against related proteins or samples containing potential cross-reactants.
- Matrix Effects: Spike-and-recovery experiments using the intended sample matrix (e.g., serum, cell lysate).
- Precision: Assess intra-assay and inter-assay coefficients of variation (CV).
Workflow and Pathway Diagrams
Sandwich ELISA Step-by-Step Workflow
Key Factors for Optimal Sandwich ELISA
Blocking Buffer Selection and Incubation Optimization to Minimize Non-Specific Binding
The Enzyme-Linked Immunosorbent Assay (ELISA) remains a cornerstone technique in biomedical research and diagnostic development. Within the broader thesis of ELISA optimization—encompassing direct, indirect, sandwich, and competitive formats—the critical step of blocking is universally paramount. Non-specific binding (NSB) of detection antibodies or conjugated enzymes to the solid phase (typically a polystyrene microplate) generates high background noise, obscures true signal, and drastically compromises assay sensitivity, specificity, and reproducibility. This guide provides an in-depth technical analysis of blocking buffer formulation and incubation parameter optimization as the primary strategy to mitigate NSB, thereby enhancing the reliability of all ELISA types.
Fundamentals of Non-Specific Binding and Blocking Mechanisms
NSB arises from hydrophobic, ionic, or charge-based interactions between assay components and the plastic surface or from nonspecific protein-protein interactions. Effective blocking agents occupy these potential binding sites. The choice of agent depends on the assay's specific reactants and the nature of the immobilized target.
Quantitative Comparison of Common Blocking Buffers
The efficacy of a blocking buffer is measured by the signal-to-noise ratio (S/N), where signal is the absorbance from a true positive sample and noise is the absorbance from a blank (no analyte) well. Lower noise indicates superior blocking.
Table 1: Performance Metrics of Common Blocking Buffer Formulations
| Blocking Agent & Typical Concentration | Key Mechanism of Action | Advantages | Disadvantages | Optimal Use Case |
|---|---|---|---|---|
| BSA (1-5% w/v in PBS/TBS) | Saturates hydrophobic sites; adds a charge barrier. | Inert, widely available, inexpensive. | May contain bovine IgGs causing interference; variable lot-to-lot quality. | General purpose; indirect/sandwich ELISAs with animal sera-derived antibodies. |
| Non-Fat Dry Milk (NFDM) (1-5% w/v) | Complex mixture of caseins, whey proteins, lactose. | Highly effective, very low cost, reduces hydrophobic interactions. | Contains endogenous biotin and phosphoproteins; can spoil; not suitable for streptavidin-based detection. | High-throughput screening where biotin is not used. |
| Casein (1-3% w/v) | Purified phosphoprotein from milk; forms a uniform layer. | Consistent, low background, often protease-free. | More expensive than NFDM; requires heating to solubilize. | Phosphoprotein studies and assays requiring high consistency. |
| Fish Skin Gelatin (0.1-1% w/v) | Low molecular weight protein, non-mammalian. | Minimal cross-reactivity with mammalian antibodies; clear solution. | Less robust for high-density plates; can be expensive. | Assays using mammalian primary and secondary antibodies. |
| Serum (5-10% v/v) | Complex mixture mimicking immunoassay conditions. | Effective for difficult assays with high NSB. | Expensive, highly variable, contains countless interfering factors. | Troubleshooting stubborn NSB after simpler agents fail. |
| Synthetic Blockers (e.g., BlockAid, StartingBlock) | Defined synthetic polymers or protein mixtures. | Consistent, animal-free, often biotin-free, fast. | Proprietary, can be costly. | Critical drug development assays requiring defined components. |
Table 2: Impact of Incubation Parameters on Blocking Efficacy Data derived from standardized sandwich ELISA optimization experiments.
| Parameter | Typical Range | Optimized Effect on NSB (Background OD) | Recommended Starting Point |
|---|---|---|---|
| Incubation Time | 30 min - Overnight | Background OD decreases asymptotically with time, plateauing after 1-2 hours. | 1 hour at room temperature (RT). |
| Temperature | 4°C, RT (22-25°C), 37°C | RT typically offers best kinetic balance. 37°C can increase NSB for protein-based blockers. | Room Temperature (22-25°C). |
| Buffer Volume | 150-300 µL/well | Must completely cover plate surface. Insufficient volume causes edge effects. | 200 µL for a standard 96-well plate. |
| Additive: Tween-20 | 0.05 - 0.1% v/v | Critical: Disrupts hydrophobic interactions. Reduces background by >50% in most systems. | 0.05% Tween-20 in blocking and wash buffers. |
| Post-Block Wash | 1-3 washes | Removes excess, unbound blocker. More than 3 washes offers minimal benefit. | 3 washes with Wash Buffer (PBS/TBS + 0.05% Tween-20). |
Detailed Experimental Protocol for Systematic Blocking Optimization
Objective: To empirically determine the optimal blocking buffer and incubation time for a novel indirect ELISA detecting Target Protein X.
Materials:
- Coated microplate (antigen immobilized)
- Candidate blocking buffers (e.g., 2% BSA/PBST, 3% NFDM/PBST, 1% Casein/PBST)
- Primary antibody (rabbit anti-Target X)
- HRP-conjugated secondary antibody (goat anti-rabbit IgG)
- Wash Buffer (PBS + 0.05% Tween-20)
- TMB Substrate Solution
- Stop Solution (1M H₂SO₄)
- Plate reader (450 nm)
Methodology:
- Blocking Regimen: Divide the coated plate into sections. Block each section with a different candidate buffer. Within each buffer section, implement different incubation times (30 min, 1 hr, 2 hr, overnight at 4°C). Include unblocked wells as negative controls.
- Wash: Wash all wells 3x with 300 µL Wash Buffer.
- Primary Antibody: Add diluted primary antibody to all test wells. Incubate 1 hr at RT.
- Wash: Repeat step 2.
- Secondary Antibody: Add diluted HRP-conjugated secondary antibody. Incubate 1 hr at RT in the dark.
- Wash: Repeat step 2.
- Detection: Add TMB substrate, incubate for a fixed time (e.g., 10 min), then stop the reaction.
- Data Analysis: Read absorbance at 450 nm. Calculate the S/N ratio for each condition using a known weak positive sample. The condition yielding the highest S/N ratio (high signal, lowest background in blank wells) is optimal.
Visualizing the Blocking Workflow and NSB Pathways
Blocking Workflow and NSB Impact Pathways
ELISA Protocol with Blocking Optimization Step
The Scientist's Toolkit: Key Research Reagent Solutions
Table 3: Essential Materials for Blocking Optimization Experiments
| Item | Function in Blocking Optimization | Example Product/Catalog Note |
|---|---|---|
| Microplates, High-Binding | Consistent, high-protein-binding surface to standardize coating and blocking challenges. | Thermo Scientific Nunc MaxiSorp; Corning Costar 9018. |
| Purified Blocking Proteins | Defined agents for controlled experiments (BSA, Casein). Must be protease-free. | Sigma-Aldrich Bovine Serum Albumin (Fraction V); Millipore Purified Casein. |
| Non-Ionic Detergent | Critical wash buffer additive to disrupt hydrophobic NSB. | Thermo Scientific Pierce Tween-20. |
| Protein-Free Blocking Buffers | Synthetic, defined blockers for critical assays requiring animal-free components. | Thermo Scientific SuperBlock (PBS or TBS); Vector Laboratories Blocker CASEIN. |
| Plate Sealer | Prevents evaporation during blocking and antibody incubations, ensuring consistency. | Thermo Scientific Microplate Adhesive Sealing Films. |
| Microplate Washer | Provides consistent, thorough washing to remove unbound blocker and antibodies. | BioTek 405 TS Microplate Washer. |
| HRP-Conjugated Antibodies | High-quality, affinity-purified detection antibodies minimize NSB. | Jackson ImmunoResearch Goat Anti-Rabbit IgG (H+L); Abcam anti-species HRP conjugates. |
| Chromogenic TMB Substrate | Sensitive, low-background substrate for HRP. | Thermo Scientific Ultra TMB; Seracare KPL TMB. |
Within the critical framework of ELISA research, from direct and indirect assays to competitive and sandwich ELISAs, the wash step is the universal fulcrum upon which assay validity balances. A single poorly executed wash can cascade into catastrophic data unreliability, rendering even the most sophisticated ELISA type explained to researchers moot. This technical guide examines the failure modes of automated plate washers and the inherent risks of manual washing, providing rigorous protocols to safeguard experimental reproducibility in drug development and research.
The Critical Role of Washing in ELISA
Washing removes unbound reagents, minimizes background noise, and maximizes the signal-to-noise ratio. Inadequate washing leads to high background and false positives; overly aggressive washing can elute specifically bound antigen-antibody complexes, causing false negatives.
Quantitative Impact of Wash Failures
Table 1: Common Wash Failures and Their Quantitative Impact on ELISA Performance
| Failure Mode | Probable Cause | Measured Effect on OD | Impact on CV |
|---|---|---|---|
| Incomplete Aspiration | Clogged probe, improper alignment | Increase up to 40% | >15% |
| Inconsistent Soak Time | Manual timing error, programmer fault | Variable; CV increase up to 25% | 10-25% |
| Residual Volume | Low dispense pressure, worn pumps | Increase up to 35% | >20% |
| Cross-Contamination | Dirty probe exterior, splash | Spurious positive signals | N/A |
| Buffer Insufficiency | Empty reservoir, tubing leak | Dramatic increase, often >50% | >30% |
Automated Plate Washer Malfunctions: Diagnosis and Calibration
Automated washers are precision instruments prone to mechanical and software failures that compromise reproducibility.
Key Malfunction Categories:
- Probe/Pipetting Head Issues: Clogs, misalignment, and wear.
- Fluidics System Failures: Peristaltic pump degradation, valve sticking, tubing leaks.
- Software/Control Errors: Incorrectly programmed soak times, aspirate/dispense heights.
Protocol 1: Monthly Performance Qualification (PQ) for Automated Plate Washers
- Objective: Quantitatively assess aspirate efficiency, dispense volume accuracy, and cross-contamination.
- Materials: Empty microplate, calibrated analytical balance, water, dye solution (e.g., 0.5% Tartrazine), spectrophotometer.
- Method:
- Residual Volume Test: Weigh a dry plate. Program washer to fill all wells with water. Aspirate fully. Re-weigh plate. Calculate mean residual volume/well (1 mg ≈ 1 µL).
- Dispense Uniformity Test: Use dye solution. Dispense into all wells. Measure OD at 405nm for each well. Calculate CV across the plate. Acceptable CV <5%.
- Cross-Contamination Test: Fill alternating wells (A1, C1, E1, etc.) with dye. Run a standard wash cycle with buffer. Measure OD in adjacent empty wells. Signal should be <0.05 OD above buffer blank.
- Acceptance Criteria: Document results against baseline PQ specs. Failures necessitate immediate maintenance.
Manual Washing Pitfalls and Standardized Mitigation
Manual washing, often used in resource-limited settings, is highly vulnerable to operator-induced variability.
Protocol 2: Standardized Manual Wash Procedure for High-Reproducibility ELISA
- Objective: Eliminate variability in decanting, soaking, and patting.
- Materials: Wash buffer, squirt bottle or multichannel pipette, microplate, absorbent paper stack, timed interval bell.
- Method:
- Decanting: In one fluid motion, invert the plate over a sink and shake vigorously vertically 3-5 times.
- Striking: Firmly blot the inverted plate onto a fresh, layered stack of absorbent paper. Rotate 90° and repeat. Use a new paper stack for each wash step.
- Filling: Using a calibrated squirt bottle or multichannel pipette, fill each well completely. Do not allow tips to touch the plate or well contents.
- Soaking: Allow the filled plate to sit for a standardized time (e.g., 60 seconds ± 5 sec). Use a timer.
- Repetition: Repeat steps 1-4 for the prescribed number of washes (typically 3-6x).
- Critical Control: Assign a single, trained operator to wash all plates for a given experiment to minimize inter-operator variability.
The Scientist's Toolkit: Essential Reagents & Materials
Table 2: Research Reagent Solutions for Robust ELISA Wash Steps
| Item | Function & Specification | Rationale for Reproducibility |
|---|---|---|
| Coated ELISA Plate | High-binding, lot-consistent plates. | Minimizes well-to-well variation in antigen/antibody immobilization. |
| Wash Buffer (PBS/Tween-20) | 1X PBS, 0.05% Tween-20, pH 7.4. Freshly prepared or aliquoted. | Consistent ionic strength and detergent concentration reduces non-specific binding variability. |
| Calibrated Multichannel Pipette | Regularly serviced, with volume accuracy verified. | Ensures uniform dispense volume across all wells during manual wash steps. |
| Non-Absorbent Blotting Paper | Thick, layered stack, dedicated to blotting. | Prevents wicking of wash buffer back into wells, a major source of high background. |
| Automated Washer Calibration Kit | Dye solution, balance, plate reader. | Enables routine performance verification, catching drifts before they affect data. |
| Microplate Sealing Tape | During incubation steps. | Prevents evaporation and well-to-well contamination prior to washing. |
Diagrams for ELISA Wash Integrity Workflow
Title: ELISA Wash Step Integrity Decision Workflow
Title: Root Causes and Corrective Actions for Washer Failures
Within the broader thesis of ELISA types explained for researchers, understanding the nuances of substrate development is paramount. The final enzymatic reaction, converting a colorless substrate into a colored, fluorescent, or chemiluminescent product, is the critical endpoint of most ELISA formats. The reliability, sensitivity, and precision of this readout hinge directly on the stability of the substrate solution and the precise timing of its reaction. This guide details the technical best practices governing substrate handling, storage, and reaction kinetics to ensure robust and reproducible signal generation across research and drug development applications.
Core Principles of Substrate Chemistry & Signal Decay
ELISA substrates are classified by their detection modality: Colorimetric (e.g., TMB, OPD, ABTS), Chemiluminescent (e.g., Luminol-based, Acridan-based), and Fluorescent (e.g., 4-MUP, QuantaBlu). Signal instability arises from:
- Chemical Degradation: Spontaneous oxidation of the substrate by ambient oxygen or light.
- Enzymatic Instability: Loss of HRP or AP enzyme activity prior to substrate addition.
- Reaction Kinetics: Non-linear signal development over time (lag, linear, and plateau phases).
- Environmental Factors: Temperature fluctuations, pH shifts, and contaminant introduction.
Quantitative Stability Data & Best Practices
The following tables summarize key quantitative findings from recent literature and technical documentation on substrate stability.
Table 1: Stability of Common ELISA Substrates Under Recommended Storage Conditions
| Substrate (Type) | Enzyme | Recommended Storage | Shelf Life (Unopened) | Post-Reconstitution/Opening Stability | Key Stability Factor |
|---|---|---|---|---|---|
| TMB (Colorimetric) | HRP | 2-8°C, protected from light | 12-24 months | 1-3 months at 2-8°C | Oxidation by light & air; acidic stop solution halts reaction. |
| One-Step Ultra TMB | HRP | 2-8°C | 12 months | 6 months at 2-8°C | Stabilized, ready-to-use formulations show enhanced longevity. |
| Luminol/Enhancer (Chemilum.) | HRP | 2-8°C | 12-18 months | 2-8 weeks at 2-8°C | Highly susceptible to oxidation; light-sensitive. |
| AP Chemiluminescent | AP | 2-8°C | 12 months | <1 week at 2-8°C | Dioxetane-based substrates are notoriously labile post-activation. |
| 4-MUP (Fluorescent) | AP | 2-8°C | 12 months | 3 months at 2-8°C | Relatively stable, but susceptible to microbial contamination. |
Table 2: Impact of Reaction Timing on Signal-to-Noise Ratio (SNR)
| Substrate | Optimal Linear Range (Post-Add) | Typical Incubation (Room Temp) | Signal Plateau Time | Consequence of Over-Incubation |
|---|---|---|---|---|
| TMB | 5-30 minutes | 10-30 minutes | ~60 minutes | Increased background, possible substrate exhaustion, bubble formation. |
| Fast Kinetic Luminol | 2-10 minutes | 1-5 minutes | 20-30 minutes | Rapid signal decay (glow-type); photon output diminishes. |
| Glow-type Luminol | 10-60 minutes | 5-30 minutes | Several hours | Generally stable, but can increase well-to-well crosstalk. |
| AP Chemiluminescent | 5-60 minutes | 10-60 minutes | >60 minutes | Rapid decay post-plateau; critical timing required for reproducibility. |
Experimental Protocol: Validating Substrate Performance & Stability
Objective: To empirically determine the optimal incubation time and lot-to-lot consistency of a TMB substrate for a specific in-house sandwich ELISA.
Materials: See "The Scientist's Toolkit" below. Procedure:
- Plate Coating & Assay: Perform the standard ELISA protocol up to the addition of the HRP-conjugated detection antibody and final wash.
- Substrate Preparation: Equilibrate the TMB substrate (from two different lot numbers) to room temperature in the dark for 30 minutes.
- Kinetic Reaction Setup:
- Add TMB substrate to all wells simultaneously using a multichannel pipette.
- Immediately place the plate in a pre-warmed microplate reader (set to 25°C).
- Initiate kinetic read mode at 650 nm (or dual wavelength 450/650 nm for acidic stop) every 30 seconds for a total of 45 minutes.
- Data Analysis:
- Plot absorbance (y-axis) vs. time (x-axis) for key wells: high positive, low positive, negative control.
- Identify the linear phase of the reaction for each lot.
- Calculate the ∆Absorbance/minute for each lot during the linear phase. Variability >15% may indicate formulation issues.
- Determine the time point where the low positive signal clearly distinguishes from the negative control (mean + 3*SD).
- Stability Challenge (Optional):
- Aliquot a new TMB vial. Leave one aliquot at room temperature with light exposure for 24h.
- Repeat the kinetic read with the stressed aliquot vs. a fresh aliquot. Note the reduction in slope (∆Abs/min) and earlier plateau.
The Scientist's Toolkit: Research Reagent Solutions
| Item | Function & Importance |
|---|---|
| Stabilized, Ready-to-Use TMB | Single-component, hydrogen peroxide included. Minimizes pipetting error, offers improved batch consistency and longer open-vial stability. |
| Low-Binding, Amber Microcentrifuge Tubes | For aliquoting chemiluminescent substrates. Prevents adsorption of reagents and protects from light-induced degradation. |
| Temperature-Controlled Microplate Reader | Essential for kinetic reads. Maintains consistent reaction temperature, critical for comparing assays run at different times. |
| Multi-Dispense Peristaltic Pipette | For rapid, simultaneous substrate addition across the entire plate. Eliminates timing artifacts caused by sequential well addition. |
| Opaque or Foil Plate Sealers | Used immediately after adding chemiluminescent substrates to prevent any light leakage during incubation, which can cause uneven signal. |
| Precision Stop Solution (e.g., 1M H₂SO₄) | For colorimetric (TMB) assays. Accurate concentration and rapid addition are vital to reproducibly halt the enzymatic reaction. |
Visualizing Workflows & Pathways
Diagram 1: Substrate Handling & Signal Acquisition Workflow
Diagram 2: Substrate Reaction & Signal Degradation Pathways
Adherence to stringent timing and storage protocols is not a mere procedural detail but a foundational element of reliable ELISA data. As elucidated within the framework of ELISA types explained for researchers, the choice of substrate and its handling directly impacts the dynamic range, sensitivity, and reproducibility of the assay. By implementing the kinetic validation protocols, utilizing the recommended toolkit, and strictly controlling environmental variables, researchers and drug developers can ensure that substrate-derived signals are an accurate reflection of analyte concentration, thereby underpinning robust scientific conclusions.
Choosing the Right ELISA: A Comparative Analysis for Assay Validation and Selection
Within the broader thesis of understanding ELISA as a foundational immunoassay, this whitepaper provides a head-to-head comparison of the four principal ELISA types: Direct, Indirect, Sandwich, and Competitive. For researchers and drug development professionals, selecting the optimal format is critical for assay performance, budget, and timeline. This guide presents an in-depth technical analysis of their operational parameters, supported by current experimental data and protocols.
Quantitative Comparison of ELISA Types
The following table summarizes the core performance and practical metrics for each ELISA type, synthesized from recent literature and commercial assay kit data.
Table 1: Performance and Practical Metrics of ELISA Types
| ELISA Type | Typical Sensitivity (Lower Detection Limit) | Specificity | Approx. Cost per Sample (Relative) | Hands-On & Total Time | Primary Best Use Case |
|---|---|---|---|---|---|
| Direct | Moderate-High (ng-pg/mL) | Lower | $ | ~2-3 hours (Fastest) | High-throughput screening of abundant proteins; antigen-antibody binding studies. |
| Indirect | High (pg/mL) | High | $$ | ~3-4 hours | General immune response detection (e.g., serology for antibodies); enhanced signal. |
| Sandwich | Highest (fg-pg/mL) | Highest | $$$ | ~4-5 hours (Longest) | Quantifying low-abundance biomarkers, cytokines, hormones in complex samples. |
| Competitive | High (pg/mL) | High | $$ | ~3-4 hours | Measuring small molecules (haptens), drugs, or antigens with only one epitope. |
Detailed Methodologies for Key Protocols
1. Sandwich ELISA Protocol for Cytokine Quantification
- Plate Coating: Dilute capture antibody in carbonate-bicarbonate coating buffer (pH 9.6) to 2-10 µg/mL. Add 100 µL/well to a 96-well microplate. Seal and incubate overnight at 4°C.
- Washing & Blocking: Aspirate and wash plate 3x with PBS containing 0.05% Tween-20 (PBST). Add 300 µL/well of blocking buffer (e.g., 5% BSA in PBS). Incubate for 1-2 hours at room temperature (RT). Wash 3x with PBST.
- Sample & Standard Incubation: Prepare serial dilutions of the recombinant cytokine standard in assay diluent. Add 100 µL of standards or pre-diluted samples to appropriate wells. Include blank wells. Incubate for 2 hours at RT or overnight at 4°C. Wash 3-5x.
- Detection Antibody Incubation: Add 100 µL/well of biotinylated detection antibody (diluted per manufacturer's recommendation). Incubate for 1-2 hours at RT. Wash 3-5x.
- Enzyme Conjugate Incubation: Add 100 µL/well of streptavidin-Horseradish Peroxidase (HRP) conjugate. Incubate for 30-60 minutes at RT in the dark. Wash 3-5x.
- Signal Development & Detection: Add 100 µL/well of TMB substrate. Incubate for 5-30 minutes in the dark. Stop the reaction with 50 µL/well of 2N H₂SO₄. Read absorbance immediately at 450 nm with a reference at 570-650 nm.
2. Competitive ELISA Protocol for Small Molecule Detection
- Plate Coating: Coat plate with antigen-conjugate (e.g., drug-BSA conjugate) at 1-5 µg/mL in coating buffer, 100 µL/well, overnight at 4°C.
- Washing & Blocking: Wash and block as in the Sandwich protocol.
- Competitive Reaction: Pre-mix a constant concentration of primary antibody with serial dilutions of the sample/standard (containing the free analyte). Add 100 µL of this mixture to each well. The free and plate-bound antigen compete for limited antibody binding sites. Incubate 1-2 hours at RT. Wash.
- Secondary Antibody Incubation: Add 100 µL/well of enzyme-conjugated secondary antibody (e.g., anti-species HRP). Incubate 1 hour at RT. Wash.
- Signal Development: Develop with TMB, stop, and read. Note: Signal intensity is inversely proportional to analyte concentration in the sample.
Visualizing ELISA Workflows and Selection Logic
ELISA Type Selection Decision Tree
Sandwich vs Competitive ELISA Workflow Comparison
The Scientist's Toolkit: Key Research Reagent Solutions
Table 2: Essential Reagents and Materials for ELISA Development
| Item | Function & Importance in ELISA |
|---|---|
| High-Affinity, Matched Antibody Pair | The cornerstone of Sandwich ELISA. A capture antibody and a detection antibody binding non-overlapping epitopes ensure high specificity and sensitivity. |
| Recombinant Purified Antigen Standard | Essential for generating a standard curve for absolute quantification. Must be identical to the target analyte for accurate results. |
| Blocking Agent (BSA, Casein, etc.) | Prevents non-specific binding of proteins to the well surface, reducing background noise and improving signal-to-noise ratio. |
| Streptavidin-Biotin System | Amplification system. Biotinylated detection antibody binds multiple enzyme-conjugated streptavidin molecules, significantly enhancing detection sensitivity. |
| High-Sensitivity Chromogenic/Luminescent Substrate (e.g., Ultra-TMB, ECL) | Generates measurable signal. Choice impacts dynamic range and lower limit of detection (LLOD). Luminescent substrates often offer superior sensitivity. |
| Plate Washer & Microplate Reader | Automation ensures consistent washing to reduce variability. A quality spectrophotometer or luminometer is critical for accurate endpoint measurement. |
| Low-Binding Microplates | Specialized plates with surface treatment (e.g., Nunc MaxiSorp) maximize protein adsorption and uniformity for the solid phase. |
Within the broader thesis on "ELISA Types Explained for Researchers," the validation of any quantitative enzyme-linked immunosorbent assay (ELISA) is paramount. This technical guide details the four core analytical validation parameters—Accuracy, Precision, Linearity, and Limit of Detection/Limit of Quantification (LOD/LOQ)—that researchers and drug development professionals must rigorously establish to ensure data reliability, assay robustness, and regulatory compliance for pharmacokinetic, biomarker, and immunogenicity assessments.
Core Validation Parameters
Accuracy
Accuracy measures the closeness of agreement between the test result obtained by the ELISA and an accepted reference value (the true value). It is often expressed as percent recovery.
Experimental Protocol (Spike-and-Recovery):
- Prepare a known concentration of the pure analyte (reference standard) in the same matrix as the samples (e.g., serum, plasma).
- Spike this analyte into the native matrix at low, mid, and high concentrations across the assay range.
- Analyze the spiked samples alongside a standard curve prepared in assay buffer (non-matrix).
- Calculate percent recovery for each spike level: Recovery (%) = (Measured Concentration in Matrix / Expected Spiked Concentration) × 100
Acceptance Criterion: Typically 80-120% recovery, depending on assay stringency and matrix complexity.
Precision
Precision describes the closeness of agreement between a series of measurements from multiple sampling of the same homogeneous sample. It is assessed at three levels:
- Repeatability (Intra-assay): Variation within a single plate/run.
- Intermediate Precision (Inter-assay): Variation between different runs, days, or analysts.
- Reproducibility: Variation between laboratories (often required for method transfer).
Experimental Protocol:
- Prepare quality control (QC) samples at low, mid, and high concentrations (e.g., LLQC, MQC, HQC).
- For intra-assay precision: Analyze each QC sample in a minimum of 5-6 replicates on the same plate.
- For intermediate precision: Analyze each QC sample in duplicates or triplicates across a minimum of 3-6 independent assay runs performed on different days, possibly by different analysts.
- Calculate the mean, standard deviation (SD), and percent coefficient of variation (%CV) for each QC level. %CV = (SD / Mean) × 100
Acceptance Criterion: %CV ≤ 20% (often ≤15% for tighter assays) for all QC levels.
Linearity
Linearity is the ability of the ELISA to produce results that are directly proportional to the concentration of the analyte in the sample within a given range. It defines the assay's working dynamic range.
Experimental Protocol (Standard Curve Dilutional Linearity):
- Prepare a high-concentration stock of the reference standard.
- Serially dilute the stock in assay buffer to create a standard curve covering the expected range (e.g., 8-10 points).
- Run the standard curve in duplicate in at least 3 independent assays.
- Plot the mean measured signal (OD) against the theoretical concentration.
- Perform a regression analysis (e.g., 4- or 5-parameter logistic). Assess the coefficient of determination (R²) or the fit of the back-calculated concentrations.
Acceptance Criterion: R² ≥ 0.99 is commonly targeted. Back-calculated standard concentrations should be within 20% of nominal (25% at LLOQ).
Limit of Detection (LOD) and Limit of Quantification (LOQ)
- LOD: The lowest concentration of analyte that can be reliably distinguished from zero (blank). It is a sensitivity parameter.
- LOQ (or LLOQ): The lowest concentration that can be quantified with acceptable accuracy and precision. It defines the lower end of the quantifiable range.
Experimental Protocol (Based on Signal-to-Noise or SD of Blank):
- LOD: Measure the mean optical density (OD) and standard deviation (SD) of at least 16-20 replicate blank (zero-concentration) samples.
- Calculate: LOD = Mean_Blank + 3 × SD_Blank. Convert this OD value to concentration via the standard curve.
- LOQ: Prepare and analyze a minimum of 5-6 replicates of a low-concentration sample at or near the estimated LOQ across multiple runs.
- The LOQ is the concentration where both accuracy (80-120% recovery) and precision (≤20% CV) criteria are met.
The following table summarizes the core validation parameters, their typical experimental setups, and common acceptance benchmarks for a quantitative ELISA.
Table 1: Summary of ELISA Key Validation Parameters
| Parameter | Definition | Typical Experimental Method | Key Metric(s) | Common Acceptance Criteria |
|---|---|---|---|---|
| Accuracy | Closeness to true value | Spike-and-recovery in relevant matrix | % Recovery | 80-120% Recovery |
| Precision | Closeness of replicate measures | Analysis of QCs (Low, Mid, High) across runs | % Coefficient of Variation (%CV) | Intra-assay: ≤15% CV Inter-assay: ≤20% CV |
| Linearity | Proportionality of response | Analysis of a serially diluted standard curve | Coefficient of Determination (R²) | R² ≥ 0.99 |
| LOD | Lowest detectable concentration | Analysis of multiple blank samples | MeanBlank + 3×SDBlank | Signal distinguishable from blank |
| LOQ | Lowest quantifiable concentration | Analysis of low-level samples with accuracy/precision | % Recovery, %CV | Recovery: 80-120% Precision: ≤20% CV |
ELISA Validation Workflow
The following diagram outlines the logical sequence and decision points in the core ELISA validation process.
Diagram Title: ELISA Validation Parameter Workflow
The Scientist's Toolkit: Key Research Reagent Solutions
The following table lists essential materials and reagents critical for performing ELISA validation experiments.
Table 2: Essential Reagents for ELISA Validation
| Item | Function in Validation |
|---|---|
| Purified Reference Standard | Provides the known analyte concentration for generating the standard curve, used as the truth standard for accuracy (spike/recovery). |
| Matrix-Matched Quality Controls (QCs) | Prepared at low, mid, and high concentrations in the biological matrix (e.g., serum) to assess precision and accuracy across the range. |
| Assay Diluent (Matrix-based) | Used to dilute samples and standards while mimicking the sample matrix to minimize matrix effects for accurate recovery. |
| Capture & Detection Antibody Pair | The core immunoreagents that define assay specificity. Must be validated for lack of cross-reactivity. |
| Precision Pipettes & Calibrator | Critical for accurate volumetric measurements during serial dilution and sample/reagent addition. Regular calibration is mandatory. |
| Validated ELISA Plate Reader | Instrument for measuring optical density (OD). Must be validated for precision, linearity of response, and proper wavelength filters. |
| Data Analysis Software | Software capable of 4- or 5-parameter logistic (4PL/5PL) regression for standard curve fitting and calculation of validation statistics. |
Within the broader thesis on ELISA types for research, understanding the operational and strategic differences between traditional and multiplex platforms is crucial for experimental design and resource allocation. This guide provides a technical comparison to inform scaling decisions.
Core Principles and Quantitative Comparison
Traditional ELISA (Enzyme-Linked Immunosorbent Assay) is a plate-based immunoassay for detecting and quantifying a single analyte. It relies on the specific binding of an antigen by an antibody, which is then linked to an enzyme-based colorimetric detection system.
Multiplex ELISA (e.g., Luminex xMAP, MSD, bead-based arrays) enables the simultaneous quantification of multiple analytes (from a handful to 100+) from a single sample well. It uses capture antibodies immobilized on distinct, coded substrates (fluorescent beads or electrochemiluminescent spots).
Quantitative Performance Data
Table 1: Head-to-Head Technical Comparison
| Parameter | Traditional Sandwich ELISA | Multiplex Bead-Based ELISA |
|---|---|---|
| Analytes per Well | 1 | 2-500+ (Typical: 10-100) |
| Sample Volume Required | 50-100 µL per analyte | 25-50 µL for all analytes |
| Dynamic Range | Typically 2-3 logs | Typically 3-4 logs (wider) |
| Time to Complete Assay | 4-8 hours (hands-on) | 3-5 hours (less hands-on) |
| Throughput (Samples/Day) | Moderate (limited by plates) | High (multiplex advantage) |
| Sensitivity | High (pg/mL) | Comparable to slightly lower (fg/mL for MSD) |
| Cross-Reactivity Risk | Low | Requires rigorous antibody pair validation |
| Cost per Data Point | Low | Higher per well, but lower per analyte |
Table 2: Economic & Workflow Scaling Implications
| Scaling Scenario | Recommended Platform | Rationale |
|---|---|---|
| Pilot Study (1-5 targets, 100s samples) | Traditional ELISA | Lower startup cost, established protocols. |
| High-Throughput Screening (1 target, 1000s samples) | Automated Traditional ELISA | Optimized single-plex can be faster/cheaper. |
| Pathway Analysis (10-50 targets, 10s-100s samples) | Multiplex ELISA | Maximizes data from precious samples (e.g., patient biopsies, CSF). |
| Biomarker Discovery | Multiplex ELISA | Unbiased screening of many candidates. |
| Limited Sample Volume | Multiplex ELISA | Conserves irreplaceable material. |
Detailed Experimental Protocols
Protocol 1: Traditional Sandwich ELISA
- Coating: Dilute capture antibody in carbonate/bicarbonate coating buffer (pH 9.6). Add 100 µL/well to a 96-well plate. Incubate overnight at 4°C.
- Washing: Aspirate and wash plate 3x with PBS containing 0.05% Tween-20 (PBST).
- Blocking: Add 300 µL/well of blocking buffer (e.g., 1% BSA or 5% non-fat dry milk in PBS). Incubate 1-2 hours at room temperature (RT). Wash 3x.
- Sample & Standard Addition: Add 100 µL/well of sample or standard dilution in assay diluent. Incubate 2 hours at RT. Wash 3x.
- Detection Antibody Addition: Add 100 µL/well of biotinylated or enzyme-conjugated detection antibody. Incubate 1-2 hours at RT. Wash 3x.
- Streptavidin-Enzyme Conjugate: If using biotin, add 100 µL/well of Streptavidin-HRP. Incubate 30 minutes at RT. Wash 3x.
- Substrate Addition: Add 100 µL/well of TMB substrate. Incubate 5-30 minutes in the dark.
- Stop & Read: Add 50 µL/well of stop solution (e.g., 2N H₂SO₄). Measure absorbance immediately at 450 nm with a correction at 570 nm.
Protocol 2: Bead-Based Multiplex ELISA (Luminex Principle)
- Bead Preparation: Vortex and sonicate magnetic, color-coded beads coupled with distinct capture antibodies. Add a bead mixture to all wells of a filter-bottom microplate.
- Washing: Wash beads 2x with wash buffer using a vacuum manifold or magnet.
- Sample & Standard Addition: Add 50 µL of standard or sample to appropriate wells. Add 50 µL of assay buffer. Seal and incubate on a plate shaker (2 hours, RT, protected from light).
- Washing: Wash beads 3x as in step 2.
- Detection Antibody Addition: Add 50 µL of biotinylated detection antibody cocktail to each well. Seal and incubate on a shaker (1 hour, RT, protected from light).
- Washing: Wash beads 3x.
- Streptavidin-Phycoerythrin (SAPE) Addition: Add 50 µL of SAPE to each well. Seal and incubate on a shaker (30 minutes, RT, protected from light).
- Washing: Wash beads 3x.
- Resuspension & Reading: Resuspend beads in 100-150 µL of reading buffer. Analyze on a Luminex instrument, which identifies each bead by its internal color and quantifies the bound SAPE fluorescence.
Visualizing Workflows and Decision Pathways
Traditional Sandwich ELISA Workflow
Bead-Based Multiplex ELISA Workflow
Platform Selection Decision Tree
The Scientist's Toolkit: Essential Research Reagent Solutions
Table 3: Key Reagents and Materials
| Item | Function in ELISA | Key Consideration for Scaling |
|---|---|---|
| Matched Antibody Pairs | Capture and detection; defines specificity & sensitivity. | For multiplex, pre-validated panels are essential to avoid cross-talk. |
| High-Binding Plates (Traditional) | Maximizes antibody adsorption. | Consistency across plate lots is critical for high-throughput. |
| Magnetic Beads (Multiplex) | Solid support for capture antibodies; coded by fluorescence. | Bead stability and uniform coupling are paramount. |
| Biotin-Streptavidin System | Signal amplification; common in both platforms. | High-quality, stable conjugates reduce background. |
| Luminex or MSD Instrumentation | For multiplex: reads bead code & signal intensity. | Major capital cost; access via core facilities is common. |
| Plate Washer | Automated removal of unbound material. | Essential for reproducibility in scaled workflows. |
| Assay Diluent/Blocking Buffer | Reduces non-specific binding and matrix effects. | May require optimization for complex sample types (e.g., serum). |
| Multiplex Data Analysis Software | Analyzes complex calibration curves and cross-talk correction. | A critical, often overlooked, component of multiplex workflows. |
Within the thesis of ELISA types explained for researchers, Enzyme-Linked Immunosorbent Assay (ELISA) remains a cornerstone technology in clinical and preclinical research. Its versatility supports critical applications: quantifying Pharmacokinetic (PK) parameters, detecting anti-drug antibodies (ADA) for immunogenicity assessment, and measuring biomarker levels. The fundamental principle involves the specific binding of an antigen by an antibody, with an enzyme label providing a measurable signal. The selection of a fit-for-purpose assay—balancing sensitivity, specificity, precision, and throughput—is paramount for generating reliable data that informs drug development decisions.
Core ELISA Formats and Selection Criteria
The choice of ELISA format is dictated by the analyte of interest and the required assay performance characteristics.
Direct ELISA: The antigen is immobilized and detected directly by a labeled primary antibody. Simple and fast, but lower sensitivity and potential for non-specific binding. Indirect ELISA: Immobilized antigen is bound by an unlabeled primary antibody, which is then detected by a labeled secondary antibody. Offers signal amplification and flexibility. Sandwich ELISA: Requires two antibodies binding distinct epitopes on the target antigen—a capture antibody and a detection antibody. Offers high specificity and sensitivity, ideal for complex samples. Competitive/Inhibition ELISA: Used for small molecules or antigens with a single epitope. Sample antigen competes with a labeled reference antigen for a limited number of antibody-binding sites. Signal inversely proportional to analyte concentration.
Table 1: Fit-for-Purpose ELISA Format Selection Guide
| Application | Recommended Format | Key Rationale | Typical Sensitivity Range | Throughput |
|---|---|---|---|---|
| PK (Large Molecule) | Sandwich ELISA | High specificity for the therapeutic protein in biological matrices; robust quantification. | 50 – 500 pg/mL | High |
| PK (Small Molecule) | Competitive ELISA | Effective for haptens/small molecules with limited epitopes. | 0.1 – 10 ng/mL | Medium |
| Immunogenicity (ADA Screening) | Bridging ELISA (Sandwich format) | Detects ADA capable of binding two drug molecules; good drug tolerance. | 50 – 500 ng/mL (anti-drug IgG) | Medium-High |
| Immunogenicity (ADA Confirmation) | Competitive Inhibition | Confirms specificity by demonstrating signal inhibition with excess free drug. | N/A (% Inhibition reported) | Medium |
| Biomarker (Cytokines, etc.) | Sandwich ELISA | Optimal sensitivity and specificity for low-abundance proteins in serum/plasma. | 1 – 50 pg/mL | High |
Detailed Experimental Protocols
Protocol 1: Sandwich ELISA for Therapeutic Protein PK Analysis
Objective: Quantify concentration of a monoclonal antibody (mAb) therapeutic in serum. Materials: See "The Scientist's Toolkit" below. Procedure:
- Coating: Dilute anti-idiotypic capture antibody in carbonate/bicarbonate coating buffer (pH 9.6) to 2 µg/mL. Add 100 µL/well to a 96-well microplate. Seal and incubate overnight at 4°C.
- Washing: Aspirate wells and wash 3x with 300 µL/well of PBS containing 0.05% Tween-20 (PBST).
- Blocking: Add 200 µL/well of blocking buffer (e.g., 3% BSA in PBST). Incubate for 1-2 hours at room temperature (RT). Wash 3x with PBST.
- Sample & Standard Addition: Prepare serial dilutions of the mAb reference standard in normalized matrix (e.g., 1% BSA in PBST). Dilute study samples appropriately. Add 100 µL of standard, sample, or control per well. Incubate 2 hours at RT with gentle shaking. Wash 5x with PBST.
- Detection Antibody Addition: Add 100 µL/well of biotinylated detection antibody (specific to a different epitope on the mAb) at optimal concentration (e.g., 0.5 µg/mL in assay buffer). Incubate 1 hour at RT. Wash 5x with PBST.
- Enzyme Conjugate Addition: Add 100 µL/well of streptavidin-Horseradish Peroxidase (HRP) diluted per manufacturer's instructions. Incubate 30 minutes at RT in the dark. Wash 5x with PBST.
- Substrate Development: Add 100 µL/well of TMB substrate. Incubate for 10-20 minutes at RT in the dark until blue color develops.
- Stop Reaction: Add 50 µL/well of 1M H2SO4 stop solution. Read absorbance immediately at 450 nm with a 570 nm or 620 nm reference wavelength.
- Data Analysis: Generate a 4- or 5-parameter logistic (4PL/5PL) standard curve. Interpolate sample concentrations from the curve.
Protocol 2: Bridging ELISA for ADA Screening
Objective: Detect anti-drug antibodies (ADA) in serum samples. Procedure:
- Coating: Dilute the drug (therapeutic protein) in coating buffer to 2 µg/mL. Coat plates as in Protocol 1.
- Blocking/Washing: Block and wash as in Protocol 1.
- Sample Incubation: Add 100 µL/well of diluted study samples, positive control (spiked polyclonal ADA), and negative control (pooled normal serum). Incubate 1-2 hours at RT. Wash 5x with PBST.
- Detection Drug Incubation: Add 100 µL/well of biotinylated drug at optimal concentration. Incubate 1 hour at RT. Wash 5x with PBST.
- Signal Development & Analysis: Follow steps 6-9 from Protocol 1. Samples with signal above the pre-determined cut point (e.g., mean + 1.96SD of naive samples) are considered screening-positive.
Visualization of Workflows and Pathways
The Scientist's Toolkit: Research Reagent Solutions
Table 2: Essential ELISA Materials and Reagents
| Item | Function | Key Considerations |
|---|---|---|
| Microplates (High Binding) | Solid phase for immobilization of capture reagent. | Polystyrene, treated for optimal protein binding (e.g., Nunc MaxiSorp). |
| Capture & Detection Antibodies | Provide assay specificity. Matched pair for sandwich assays. | Anti-idiotypic for PK; drug/anti-drug for ADA. Must target non-overlapping epitopes. |
| Detection Enzyme Conjugate | Generates measurable signal. Common: HRP or Alkaline Phosphatase (AP). | Streptavidin-HRP for biotin-based systems. Secondary antibody-HRP for indirect formats. |
| Chromogenic Substrate (TMB/OPD) | Enzyme substrate that yields a colored product. | TMB (3,3',5,5'-Tetramethylbenzidine) is most common; stop with acid. |
| Blocking Buffer (BSA/Casein) | Blocks non-specific binding sites on the plate and reagents. | Typically 1-5% protein in PBST. Must be optimized to minimize background. |
| Wash Buffer (PBST) | Removes unbound reagents between steps. | Tween-20 concentration critical (usually 0.05%). Automated washers improve reproducibility. |
| Reference Standard | Calibrates the assay and enables quantification. | Must be well-characterized, pure, and identical to analyte (PK) or representative (ADA). |
| Assay Diluent/Matrix | Diluent for standards and samples. Mimics sample matrix. | Critical for PK assays. Often contains a protein and detergents to minimize matrix effects. |
Within the broader landscape of immunoassay techniques, the Enzyme-Linked Immunosorbent Assay (ELISA) has long been the cornerstone for quantifying proteins and biomarkers. However, evolving research demands for higher sensitivity, multiplexing capability, and dynamic range have driven the development of advanced platforms. This guide, framed within the thesis of understanding ELISA alternatives, provides an in-depth technical comparison of three leading platforms: Meso Scale Discovery (MSD), Luminex xMAP, and Quanterix Simoa. Each serves as a powerful complement or alternative to conventional ELISA, addressing specific experimental challenges in drug development and biomedical research.
Meso Scale Discovery (MSD): Utilizes electrochemiluminescence (ECL) detection. Capture antibodies are bound to carbon electrode-coated plates. Upon voltage application, a sulfonated tag on the detection antibody emits light, which is measured. This technology reduces background noise and offers a broad dynamic range.
Luminex xMAP: Employs color-coded magnetic or polystyrene microspheres (beads) impregnated with fluorescent dyes. Each bead set is coated with a specific capture antibody, allowing multiplexing of up to 500 targets in a single well. Detection is via a second, reporter antibody and a flow-cytometry based analyzer.
Quanterix Simoa (Single Molecule Array): An ultra-sensitive digital ELISA technology. Beads coated with capture antibodies are incubated with sample, then with enzyme-labeled detection antibodies. Beads are then isolated into femtoliter-sized wells. A fluorescent substrate is added; the presence of a single enzyme molecule generates a concentrated, detectable signal, enabling single-molecule detection.
Quantitative Platform Comparison
Table 1: Core Technical Specifications and Performance Metrics
| Parameter | Conventional ELISA | MSD ECL | Luminex xMAP | Simoa |
|---|---|---|---|---|
| Detection Mechanism | Colorimetric (Absorbance) | Electrochemiluminescence | Fluorescence (Flow Cytometry) | Fluorescence (Digital Counting) |
| Typical Sensitivity (Lower Limit) | pg/mL (1-10 pg/mL) | fg/mL - pg/mL (0.1-1 pg/mL) | pg/mL (1-10 pg/mL) | fg/mL (0.01-0.1 pg/mL) |
| Dynamic Range | ~2-3 logs | ~4-5 logs | ~3-4 logs | ~4-5 logs |
| Multiplexing Capacity | Singleplex | Low-plex (up to 10-plex) | High-plex (up to 500-plex) | Singleplex & Low-plex (up to 6-plex) |
| Sample Volume Required | 50-100 µL | 25-50 µL | 25-50 µL | 50-200 µL |
| Throughput | High | High | High (for multiplex) | Medium |
| Key Advantage | Cost-effective, simple | Wide dynamic range, low background | High multiplex capability | Exceptional sensitivity |
Table 2: Application Suitability and Cost Considerations
| Consideration | MSD | Luminex | Simoa |
|---|---|---|---|
| Best For | Cytokines, pharmacokinetics (PK), biomarkers needing wide range. | Cytokine panels, signaling pathways, biomarker discovery. | Neurological biomarkers (e.g., GFAP, NfL), low-abundance cytokines, early disease detection. |
| When to Consider vs. ELISA | Need better sensitivity/dynamic range without moving to ultra-sensitive. | Need to measure many analytes simultaneously from limited sample. | Target is below detection limit of conventional/ECL assays. |
| Approximate Cost per Sample (Relative) | Moderate-High (1.5-3x ELISA) | High for low-plex, cost-effective for high-plex data point. | High (3-5x ELISA) |
| Instrumentation | Sector Imager series | MAGPIX/Luminex 200/FLEXMAP 3D | HD-X or SR-X Analyzer |
Experimental Protocol Highlights
Protocol 1: MSD Multiplex Cytokine Assay Workflow
- Plate Preparation: MSD MULTI-ARRAY plates pre-coated with capture antibodies.
- Blocking: Add 150 µL/well of MSD Blocker A for 30 min with shaking.
- Sample & Standard Incubation: Wash 3x with PBS-T. Add 25 µL of standard or sample per well. Incubate 2 hours with shaking.
- Detection Antibody Incubation: Wash 3x. Add 25 µL of Sulfo-Tag labeled detection antibody cocktail. Incubate 1-2 hours with shaking.
- Read Buffer Addition: Wash 3x. Add 150 µL of MSD GOLD Read Buffer.
- Data Acquisition: Immediately read plate on MSD Sector Imager. Data analysis using MSD Discovery Workbench software.
Protocol 2: Luminex Magnetic Bead-Based Multiplex Assay
- Bead Preparation: Vortex and sonicate magnetic bead cocktail. Add 50 µL of beads to each well of a microplate.
- Wash: Place plate on a magnetic separator. Discard supernatant after beads are immobilized.
- Assay Incubation: Resuspend beads in 50 µL of standards or samples. Incubate for 1 hour at RT on a plate shaker. Wash twice.
- Detection Antibody Incubation: Add 50 µL of biotinylated detection antibody cocktail. Incubate 30 minutes. Wash twice.
- Streptavidin-Phycoerythrin (SA-PE) Incubation: Add 50 µL of SA-PE. Incubate 10 minutes. Wash twice.
- Resuspension & Reading: Resuspend beads in 100-150 µL of drive fluid. Analyze on Luminex analyzer (e.g., MAGPIX). Report fluorescence intensity (MFI).
Protocol 3: Simoa Digital ELISA Protocol
- Bead Incubation: Mix paramagnetic capture beads with sample and biotinylated detection antibody in a reaction vessel. Incubate to form immunocomplexes.
- Wash and Label: Wash beads and resuspend in Streptavidin-β-galactosidase (SBG) enzyme conjugate. Incubate.
- Wash and Separation: Wash beads and resuspend in resorufin β-D-galactopyranoside (RGP) substrate. Load bead mixture into the Simoa disc containing array of microwells.
- Sealing and Imaging: Beads are sealed into wells. Wells are imaged by a high-speed camera to identify those containing beads (both active and inactive).
- Fluorescence Detection: The fluorescence signal from each well is measured. An "active" well (containing an enzyme-labeled immunocomplex) shows high fluorescence.
- Digital Analysis: The ratio of active beads to total beads is calculated, enabling absolute quantification at the single-molecule level.
Platform Selection and Workflow Diagrams
Decision Workflow for Immunoassay Platform Selection
Simoa Digital ELISA Core Process Flow
The Scientist's Toolkit: Essential Research Reagent Solutions
Table 3: Key Reagents and Materials for Advanced Immunoassay Platforms
| Item | Function | Platform Specificity |
|---|---|---|
| Electrochemiluminescent (ECL) Labels | Ruthenium chelate labels that emit light upon electrochemical stimulation. | Core to MSD technology. |
| Magnetic/Coded Microspheres | Polystyrene beads with unique fluorescent signatures for analyte capture. | Core to Luminex technology. |
| Streptavidin-Phycoerythrin (SA-PE) | Fluorescent reporter that binds to biotinylated detection antibodies. | Common detection reagent in Luminex assays. |
| Paramagnetic Beads with Capture Ab | Beads for target capture, manipulated by magnets, used in digital arrays. | Core to Simoa and some Luminex/MSD assays. |
| β-Galactosidase Enzyme Conjugate | Enzyme (e.g., Streptavidin-β-Gal) that generates fluorescent product from substrate. | Critical enzyme for Simoa detection. |
| Resorufin β-D-Galactopyranoside (RGP) | Fluorescent enzyme substrate for β-Galactosidase. | Simoa-specific substrate. |
| Multiplex Assay Buffer/A-Blocker | Protein-based buffer to reduce non-specific binding in multiplex formats. | Essential for MSD and Luminex to maintain specificity. |
| Calibration Kit & Quality Controls | Pre-measured analyte standards and controls for instrument/assay calibration. | Mandatory for all quantitative platforms (MSD, Luminex, Simoa). |
The selection between MSD, Luminex, and Simoa platforms is not a matter of which is universally superior, but which is most appropriate for the specific research question within the immunoassay toolkit. For researchers requiring the utmost sensitivity to detect trace biomarkers, Simoa is unparalleled. For comprehensive profiling of cytokine networks or signaling pathways, Luminex's multiplex power is transformative. When analyzing analytes with wide concentration ranges or seeking improved performance over ELISA, MSD offers a robust solution. By understanding the technical foundations, performance parameters, and practical workflows of these platforms, researchers can make informed decisions to advance biomarker discovery, pharmacokinetic studies, and diagnostic development.
Conclusion
Selecting and executing the optimal ELISA format is a critical decision point in experimental design, directly impacting data quality and research outcomes. Foundational understanding of antibody mechanics informs methodological choice, where Sandwich ELISA excels in sensitivity for cytokines, while Competitive ELISA is indispensable for small molecules. Rigorous troubleshooting and optimization are non-negotiable for robust, reproducible results, and proper validation against defined parameters ensures data integrity. As research demands evolve, traditional ELISA remains a cornerstone, yet researchers must stay informed of emerging multiplex and digital immunoassay platforms. Mastery of these principles empowers scientists to reliably quantify biomolecules, accelerating discovery in drug development, diagnostics, and fundamental biomedical research.