ELISA vs Flow Cytometry: A Comprehensive Guide to Immunochemical Methods for Biomedical Research
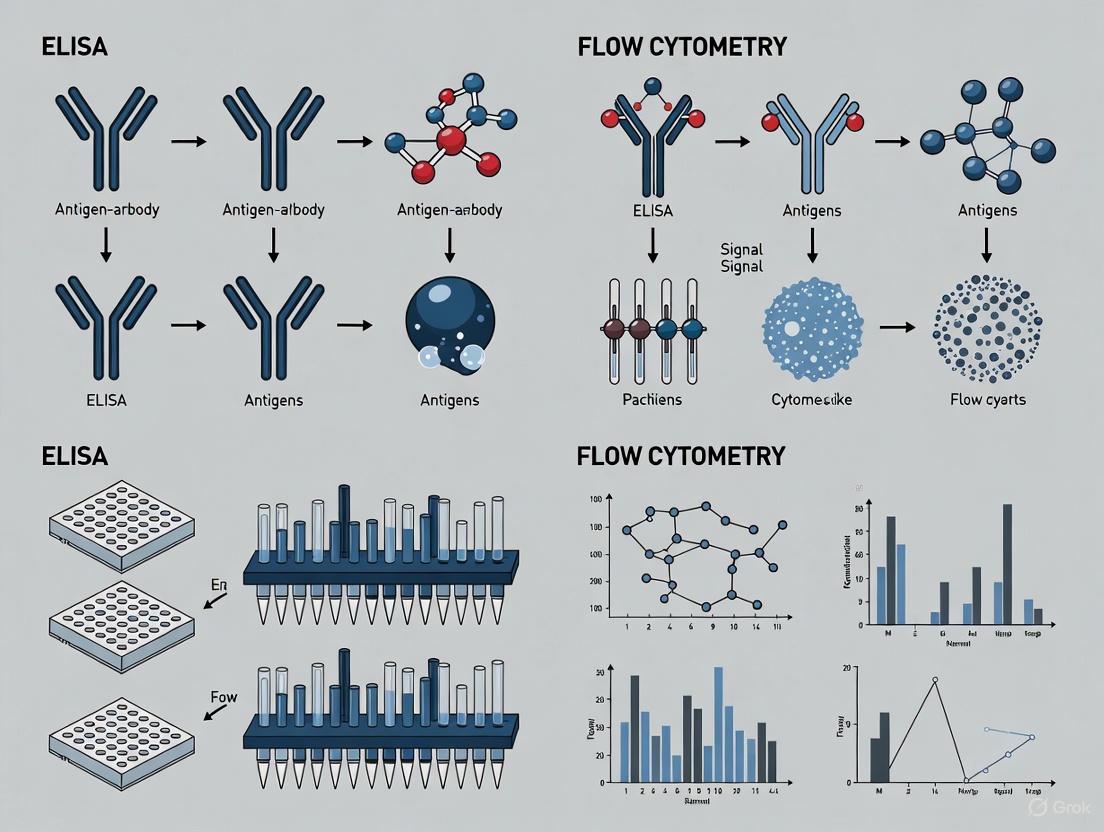
This guide provides researchers, scientists, and drug development professionals with a thorough exploration of two cornerstone immunochemical techniques: Enzyme-Linked Immunosorbent Assay (ELISA) and Flow Cytometry.
ELISA vs Flow Cytometry: A Comprehensive Guide to Immunochemical Methods for Biomedical Research
Abstract
This guide provides researchers, scientists, and drug development professionals with a thorough exploration of two cornerstone immunochemical techniques: Enzyme-Linked Immunosorbent Assay (ELISA) and Flow Cytometry. It covers foundational principles, from the quantitative nature of ELISA for soluble molecules to the multi-parametric, single-cell analysis capabilities of flow cytometry. The article delivers detailed methodological protocols, expert troubleshooting advice, and rigorous validation approaches. By presenting a clear comparative analysis, this resource empowers professionals to select the optimal method based on their specific research questions, sample types, and project requirements, ultimately enhancing experimental design and data reliability in immunology, oncology, and drug development.
Core Principles: Understanding the Fundamentals of ELISA and Flow Cytometry
What is ELISA? Defining the Plate-Based Assay for Quantifying Soluble Targets
The Enzyme-Linked Immunosorbent Assay (ELISA) is a fundamental pillar in immunochemical methods, serving as a powerful plate-based technique designed for detecting and quantifying soluble substances such as peptides, proteins, antibodies, and hormones [1]. First described by Eva Engvall and Peter Perlmann in 1971, ELISA was developed as a safer alternative to radioimmunoassay (RIA), replacing radioactive labels with enzymes to generate a detectable signal [2] [3]. This innovation paved the way for a versatile and widely adopted technology.
The core principle of ELISA hinges on the specificity of antibody-antigen interactions, coupled with an enzymatic reaction for signal amplification [4] [5]. In essence, one of the immunoreactants is immobilized on a solid surface, typically a polystyrene microtiter plate. Subsequent binding events are then revealed through an enzyme-conjugated antibody that, when incubated with its substrate, produces a measurable colorimetric, fluorescent, or chemiluminescent signal [2] [3]. The intensity of this signal is proportional to the concentration of the target analyte in the sample [5].
ELISA's significance extends across diverse fields. In research laboratories, it is an indispensable tool for quantifying protein levels and analyzing pathway activation [4]. In clinical diagnostics, it is used for detecting infections, autoantibodies, tumor markers, and hormones [2]. Furthermore, its applications encompass drug development, environmental monitoring, and food safety testing [5], solidifying its status as a cornerstone technique in the scientist's toolkit.
Core Principles and Key Components
The robustness of ELISA stems from the seamless integration of immunology and biochemistry. The assay's functionality relies on several key components and principles that work in concert.
- Antibody-Antigen Specificity: The foundation of any ELISA is the highly specific lock-and-key interaction between an antibody and its target antigen. This specificity allows for the precise identification and measurement of a single analyte within a complex mixture, such as serum or cell lysate [1].
- Solid-Phase Separation: As a heterogeneous assay, ELISA requires the separation of bound and free reagents. This is achieved by immobilizing the capture molecule (antigen or antibody) onto a solid surface, most commonly a 96-well microplate [2]. This immobilization facilitates a series of simple washing steps to remove unbound material, thereby reducing background noise and enhancing assay specificity [1].
- Enzymatic Signal Amplification: To detect the often minute quantities of a target analyte, ELISA employs an enzyme (e.g., Horseradish Peroxidase - HRP, or Alkaline Phosphatase - AP) conjugated to a detection antibody [4] [2]. When a substrate is added, the enzyme catalyzes its conversion into a measurable product. A single enzyme can generate many thousands of product molecules, providing significant signal amplification and granting ELISA its exceptional sensitivity [3].
The graph above illustrates the core signaling principle of a sandwich ELISA. The target antigen is specifically captured and bound by antibodies. An enzyme-linked detection antibody then binds, and the introduction of a substrate triggers an enzymatic reaction that generates an amplified, measurable signal. This cascade ensures that even low-abundance targets can be detected with high sensitivity.
The Scientist's Toolkit: Essential Research Reagent Solutions
A successful ELISA depends on a set of well-characterized reagents. The table below details the essential materials and their critical functions within the assay.
Table: Key Research Reagent Solutions for ELISA
| Component | Function | Common Examples |
|---|---|---|
| Solid-Phase Microplate | Provides a surface for immobilizing capture molecules; facilitates separation and washing [1]. | 96-well or 384-well polystyrene plates [4]. |
| Capture & Detection Antibodies | Provide specificity by binding to the target analyte. The detection antibody is often enzyme-conjugated [4] [1]. | Monoclonal or polyclonal antibodies; matched antibody pairs for sandwich ELISA [4]. |
| Coating Buffer | Solution used to immobilize the antigen or capture antibody onto the plate surface [1]. | Carbonate-bicarbonate buffer (pH 9.4) or phosphate-buffered saline (PBS) [1]. |
| Blocking Buffer | Covers any remaining protein-binding sites on the plate to prevent non-specific binding of other reagents [2]. | Bovine Serum Albumin (BSA), casein, or other animal proteins [2] [3]. |
| Enzyme Conjugate | Catalyzes the conversion of a substrate into a detectable product, enabling signal amplification [4] [2]. | Horseradish Peroxidase (HRP) or Alkaline Phosphatase (AP) [1]. |
| Detection Substrate | Compound acted upon by the enzyme to generate a measurable signal (color, light, or fluorescence) [4]. | TMB (colorimetric for HRP), pNPP (colorimetric for AP) [2]. |
Types of ELISA and Their Methodologies
ELISA can be configured in several formats, each with unique methodologies, advantages, and applications. The choice of format depends on the nature of the analyte, the antibodies available, and the required sensitivity.
Direct ELISA
The direct ELISA is the simplest format, involving a single enzyme-conjugated antibody that binds directly to the target antigen [2].
- Procedure:
- Coating: The antigen is immobilized directly onto the microplate well through passive adsorption [4] [3].
- Blocking: The plate is treated with a blocking protein (e.g., BSA) to prevent non-specific binding in subsequent steps [2].
- Detection: An enzyme-conjugated primary antibody specific to the antigen is added. After incubation and washing, the substrate is added to produce a signal [4] [2].
- Advantages: The protocol is rapid due to fewer steps, and it eliminates potential cross-reactivity from a secondary antibody [1] [2].
- Disadvantages: It has relatively lower sensitivity because there is no signal amplification step. It also requires a specifically conjugated primary antibody for each target, which can be costly and time-consuming to prepare [1]. This method is best suited for applications like immunosorbent staining of tissues and cells, or for detecting high-abundance antigens [1].
Indirect ELISA
The indirect ELISA introduces a secondary antibody for detection, which enhances the assay's flexibility and sensitivity [4] [2].
- Procedure:
- Coating and Blocking: These initial steps are identical to the direct ELISA [4].
- Primary Antibody Incubation: An unlabeled, antigen-specific primary antibody is added and binds to the antigen.
- Secondary Antibody Incubation: An enzyme-conjugated secondary antibody, which is specific to the species and isotype of the primary antibody, is added. This secondary antibody binds to the primary antibody.
- Signal Detection: After washing, the substrate is added to generate a signal [4] [2].
- Advantages: This format offers significant signal amplification, as multiple secondary antibodies can bind to a single primary antibody [1]. It is highly versatile, as the same labeled secondary antibody can be used with various primary antibodies from the same host species [1]. It also preserves the immunoreactivity of the primary antibody since it is not conjugated [1].
- Disadvantages: The additional incubation step increases the total assay time, and there is a risk of cross-reactivity if the secondary antibody binds non-specifically [1]. Indirect ELISA is widely used for screening antibodies, such as in serological tests for infectious diseases like HIV and Lyme disease [2].
Sandwich ELISA
The sandwich ELISA is the most sensitive and specific format. It requires two antibodies that bind to distinct, non-overlapping epitopes on the target antigen, "sandwiching" it in between [4] [2].
- Procedure:
- Capture Antibody Coating: A capture antibody, specific to the target antigen, is immobilized on the microplate well.
- Blocking: The plate is blocked to prevent non-specific binding.
- Sample Incubation: The test sample containing the antigen is added. The antigen binds to the capture antibody.
- Detection Antibody Incubation: An enzyme-conjugated detection antibody, specific to a different epitope on the antigen, is added to form the sandwich complex.
- Signal Detection: After a final wash, the substrate is added to produce a measurable signal [4] [1] [2].
- Advantages: This format offers high sensitivity and specificity because two antibodies are required for detection, minimizing false positives [1]. It is particularly well-suited for complex samples, as the antigen does not need to be purified before the assay [4].
- Disadvantages: It requires a "matched pair" of antibodies that recognize different epitopes, which can be expensive and require significant optimization [4] [1]. Sandwich ELISA is the format of choice for quantifying biomarkers, cytokines, and hormones in clinical and research settings [4] [2].
Competitive/Inhibition ELISA
The competitive ELISA is typically used for measuring small molecules or analytes with only a single epitope. In this format, the signal generated is inversely proportional to the concentration of the target in the sample [4] [1].
- Procedure:
- Antibody Coating: A specific capture antibody is immobilized on the plate.
- Competitive Incubation: The sample antigen and a known amount of enzyme-conjugated antigen are added simultaneously to the well. The two compete for a limited number of binding sites on the capture antibody.
- Signal Detection: The plate is washed, and substrate is added. A lower signal indicates a higher concentration of the target antigen in the sample, as it has out-competed the conjugated antigen for antibody binding [1].
- Advantages: This method is highly suitable for small antigens that cannot accommodate two antibodies simultaneously [4]. It is also less susceptible to sample matrix effects and can be used with partially purified samples [2].
- Disadvantages: It may have lower specificity compared to sandwich ELISA, and the dynamic range can be narrower [2]. Competitive ELISA is often used to measure hormone levels, therapeutic drugs, and small environmental contaminants [2].
Table: Comparison of Major ELISA Types
| Feature | Direct ELISA | Indirect ELISA | Sandwich ELISA | Competitive ELISA |
|---|---|---|---|---|
| Sensitivity | Low | High | Highest | Variable |
| Specificity | Moderate | Moderate | High | High for small analytes |
| Complexity | Low (fewer steps) | Medium | High | Medium |
| Time Required | Short | Medium | Long | Medium |
| Antibody Requirements | Labeled Primary | Unlabeled Primary + Labeled Secondary | Matched Antibody Pair | Labeled Antigen/Antibody |
| Primary Application | Antigen detection, immunohistochemistry | Antibody screening (e.g., serology) | Quantifying proteins in complex samples | Measuring small molecules (hormones, drugs) |
Experimental Protocol: Running a Sandwich ELISA
The following detailed protocol outlines the standard workflow for a sandwich ELISA, which is the most commonly used format for quantitative protein analysis.
The flowchart above visualizes the sequential steps of a sandwich ELISA protocol, from plate coating to final signal measurement.
Step-by-Step Protocol
Plate Coating:
- Prepare a solution of the capture antibody (typically 2-10 μg/mL) in a coating buffer such as carbonate-bicarbonate buffer (pH 9.4) or phosphate-buffered saline (PBS, pH 7.4) [1].
- Dispense the solution into the wells of a polystyrene microtiter plate (ensure you are using a protein-binding assay plate, not a tissue-culture-treated plate) [1].
- Seal the plate and incubate for several hours at 37°C or overnight at 4°C to allow for passive adsorption of the antibody to the plastic surface [1] [2].
Washing:
- Discard the coating solution by inverting the plate.
- Fill each well with a wash buffer, typically PBS containing a mild non-ionic detergent (e.g., 0.05% Tween 20). The detergent helps to remove weakly adsorbed proteins.
- Repeat the wash process 2-3 times. For automated processing, a microplate washer can be used. Proper and thorough washing is critical for minimizing background signal [2].
Blocking:
- Add a blocking buffer to every well to cover all remaining unsaturated binding sites on the polystyrene surface. Common blocking agents include 1-5% Bovine Serum Albumin (BSA), casein, or non-fat dry milk [2] [3].
- Incubate the plate for at least 1-2 hours at room temperature [2].
- After incubation, wash the plate as described in Step 2 to remove excess blocking agent.
Sample and Standard Incubation:
- Prepare a serial dilution of a known standard of the target protein to generate a standard curve for quantification.
- Add the diluted standards, controls, and test samples to the designated wells. Always run samples and standards in duplicate or triplicate to ensure statistical reliability [6] [7].
- Cover the plate and incubate for 90 minutes at 37°C or as optimized for the specific assay, allowing the antigen to bind to the capture antibody [2].
- Wash the plate thoroughly to remove any unbound antigen and other sample components.
Detection Antibody Incubation:
- Add the enzyme-conjugated detection antibody to each well. This antibody must be specific to a different epitope on the target antigen than the capture antibody.
- Incubate for 1-2 hours at room temperature [2].
- Perform another series of washes to remove any unbound detection antibody.
Signal Development and Measurement:
- Prepare the appropriate substrate solution for the enzyme conjugate (e.g., TMB for HRP, pNPP for AP) [2].
- Add the substrate to each well and incubate in the dark for a defined period (usually 15-30 minutes) to allow color or light development.
- Stop the enzymatic reaction by adding a stop solution (e.g., sulfuric acid for TMB, which changes the color from blue to yellow) [2].
- Immediately measure the signal using a microplate reader. The type of reading depends on the detection method: optical density (OD) for colorimetric substrates, fluorescence intensity for fluorescent substrates, or relative light units (RLU) for chemiluminescent substrates [4] [1].
Data Analysis and Interpretation
Accurate data analysis is crucial for transforming the raw signal from an ELISA into meaningful quantitative results. This process involves generating a standard curve and using it to interpolate the concentrations of unknown samples.
Standard Curve and Curve Fitting
The standard curve is the cornerstone of quantitative ELISA. It is created by plotting the mean absorbance (or other signal type) of the serial dilutions of the known standard against their corresponding concentrations [6].
- Curve Fitting Models: The relationship between concentration and signal is often non-linear. Several curve-fitting models can be applied, and the best one should be selected based on which provides the best fit for the data points [6].
- Linear and Log/Log: Simple but often only fit the central, linear portion of the curve, compressing data at the lower end [6].
- Semi-Log: Plots the log of the concentration against the linear signal, often resulting in a sigmoidal curve that distributes data points more evenly [6].
- Four- or Five-Parameter Logistic (4PL/5PL): These are the most sophisticated and recommended models for immunoassays. They account for the upper and lower asymptotes and the inflection point of the sigmoidal curve. The 5PL model also accounts for asymmetry, providing a superior fit for most ELISA data [6].
Table: Quantitative Data Analysis from a Standard Curve
| Standard Concentration | Mean Absorbance (450 nm) | Interpolated Concentration (Back-Calculated) |
|---|---|---|
| 0 pg/mL | 0.050 | (Blank) |
| 31.25 pg/mL | 0.150 | 30.1 pg/mL |
| 62.5 pg/mL | 0.280 | 63.8 pg/mL |
| 125 pg/mL | 0.550 | 122.1 pg/mL |
| 250 pg/mL | 1.100 | 255.3 pg/mL |
| 500 pg/mL | 1.800 | 488.0 pg/mL |
| 1000 pg/mL | 2.200 | 1050.0 pg/mL |
Note: The above table demonstrates how a standard curve is constructed and validated. The "Interpolated Concentration" is derived by treating the standard's OD value as an unknown and reading its concentration from the curve, a process called "back-fitting." A good fit is indicated when the back-calculated values are within +/- 10% of the expected values [7].
Calculating Sample Concentration and Assay Validation
- Interpolation of Unknowns: To determine the concentration of an unknown sample, first calculate the average absorbance of its replicates. Locate this value on the y-axis of the standard curve, draw a horizontal line to the curve, and then a vertical line down to the x-axis to read the corresponding concentration [6] [7]. If the sample was diluted, multiply the interpolated concentration by the dilution factor.
- Assessing Precision: Coefficient of Variation (CV): The precision of replicate measurements is assessed by calculating the CV. The CV is the ratio of the standard deviation to the mean, expressed as a percentage. A CV of ≤20% for duplicates is generally considered acceptable. A higher CV indicates greater inconsistency, potentially caused by pipetting errors, contamination, or temperature fluctuations across the plate [6] [7].
- Assessing Accuracy: Spike-and-Recovery: To determine if the sample matrix (e.g., serum, cell culture media) is interfering with the assay, a spike-and-recovery experiment is performed. A known amount of the target antigen is spiked into the sample matrix and a reference buffer. The recovery percentage is calculated by comparing the measured concentration in the matrix to the concentration in the buffer. Significant deviation from 100% recovery indicates matrix interference, and may require using a matrix-matched standard curve or further sample dilution [6].
Applications in Research and Diagnostics
ELISA's versatility, specificity, and sensitivity have cemented its role as an indispensable tool in both basic research and clinical diagnostics.
Research Applications
In the research laboratory, ELISA serves as a fundamental tool for biological discovery [4]. Key applications include:
- Protein Quantification and Pathway Analysis: Researchers use ELISA to precisely measure the concentration of specific proteins, such as cytokines, chemokines, and signaling proteins, in complex samples like cell lysates or tissue culture supernatants. This allows for the study of cellular signaling pathways and their activation states [4].
- Detection of Post-Translational Modifications (PTMs): Specialized ELISA kits can detect and quantify specific PTMs, such as phosphorylation, acetylation, or ubiquitination, providing insights into the regulatory mechanisms controlling protein function [4].
- Hybridoma Screening and Antibody Characterization: ELISA is the standard method for screening hybridoma cell lines to identify those producing monoclonal antibodies of the desired specificity. It is also used to characterize antibody affinity and specificity [5].
Clinical and Diagnostic Applications
The ELISA platform is a cornerstone of modern clinical diagnostics, enabling the detection of biomarkers for a wide array of diseases [2].
- Infectious Disease Serology: ELISA is widely used to detect patient antibodies against viral, bacterial, and fungal pathogens, aiding in the diagnosis of infections such as HIV, hepatitis A/B/C, and Lyme disease [4] [2].
- Autoimmune Disease Diagnostics: Detection of autoantibodies, such as antinuclear antibodies (ANA), anti-dsDNA, and others, is critical for diagnosing autoimmune disorders like systemic lupus erythematosus (SLE) [2] [8].
- Cancer and Hormone Biomarker Monitoring: ELISA tests are used to measure tumor markers like Prostate-Specific Antigen (PSA) and Carcinoembryonic Antigen (CEA) for cancer screening and monitoring [2]. They are also used to quantify hormone levels (e.g., hCG for pregnancy tests, luteinizing hormone, testosterone) for assessing endocrine function [2].
- Therapeutic Drug Monitoring and Toxicology: ELISA can measure the concentration of drugs and their metabolites in patient serum to ensure therapeutic levels are maintained. It is also employed in screening for drugs of abuse [2].
Flow cytometry stands as a powerful analytical technology that enables the detailed characterization of individual cells within a heterogeneous population. The core principle of this technique involves analyzing single cells as they pass in a fluid stream through a laser beam, allowing for simultaneous measurement of multiple physical and chemical properties at rates of thousands of cells per second [9]. This capability for high-throughput, multiparametric analysis at the single-cell level has established flow cytometry as an indispensable tool in biomedical research, clinical diagnostics, and drug development [10].
The fundamental workflow involves three interconnected systems: a fluidics system that transports and focuses cells single file in a stream, an optics system that illuminates cells with lasers and collects resulting light signals, and an electronics system that converts these signals into digital data for analysis [11]. Unlike bulk measurement techniques that provide population averages, flow cytometry preserves cellular heterogeneity, enabling identification of rare cell populations and detailed immunophenotyping that has revolutionized our understanding of complex biological systems [12].
Core Principles and Instrumentation
Fundamental Working Mechanism
The operational principle of flow cytometry centers on the hydrodynamic focusing of cells within a rapidly flowing fluid stream. This process forces cells to pass single-file through one or more focused laser beams, where each cell scatters light and may emit fluorescence from associated dyes or antibodies [11]. The fluidics system creates a laminar flow that precisely positions cells through the center of the laser interrogation point, ensuring consistent illumination and signal detection [13].
As each cell intersects the laser beam, it produces two types of light scattering: forward scatter (FSC), which correlates with cell size, and side scatter (SSC), which provides information about cellular granularity and internal complexity [9]. Simultaneously, if the cell is labeled with fluorescent markers, these fluorochromes absorb light at specific wavelengths and emit light at longer wavelengths, providing quantitative information about specific cellular components or markers [13].
Figure 1: Core Workflow of Flow Cytometry Analysis
Key Instrumentation Components
Modern flow cytometers incorporate sophisticated integrated systems that work in concert to generate high-quality data:
Fluidics System: This critical component manages sample introduction and transport. The system utilizes sheath fluid to create hydrodynamic focusing, precisely aligning cells through the laser interrogation point. This ensures that cells pass through the laser beam individually, preventing clogs and maintaining consistent analysis conditions across all cells in a sample [13].
Optics System: The optics consist of excitation sources (typically multiple lasers emitting at different wavelengths) and light collection pathways. Lasers illuminate cells as they pass through the interrogation point, while sophisticated arrays of lenses, filters (including dichroic mirrors and bandpass filters), and detectors collect the resulting light signals. Advanced systems can measure up to 50 parameters simultaneously, providing comprehensive cellular characterization [10].
Electronics System: This component converts detected light signals into digital data. Photomultiplier tubes (PMTs) or avalanche photodiodes (APDs) detect photons and convert them to electrical signals, which are then digitized by analog-to-digital converters. The electronics system also manages signal amplification and compensation to address spectral overlap between fluorochromes, ensuring accurate multicolor analysis [9] [13].
Key Applications in Research and Drug Development
Immunophenotyping and Disease Research
Flow cytometry serves as the gold standard for immunophenotyping—the identification and characterization of immune cells based on specific surface and intracellular markers. By using antibodies conjugated to fluorescent dyes against cluster of differentiation (CD) markers, researchers can precisely quantify different immune cell populations (T cells, B cells, NK cells, monocytes) and their activation states in peripheral blood, tissues, or culture systems [12]. This application has proven essential for:
- Cancer Diagnostics: Detection and classification of hematological malignancies such as leukemia and lymphoma through aberrant marker expression patterns [14].
- Immunodeficiency Diseases: Monitoring CD4+ T-cell counts in HIV patients to track disease progression and treatment efficacy [15].
- Autoimmune Disorders: Characterizing dysregulated immune cell populations in conditions like rheumatoid arthritis and multiple sclerosis [10].
The technology's capacity for multiparametric analysis allows researchers to examine complex immune profiles beyond simple cell counting, providing insights into cellular function, differentiation states, and pathological mechanisms [12].
Drug Discovery and Development
The pharmaceutical industry increasingly relies on flow cytometry throughout the drug development pipeline, from target identification to clinical trials [10]. High-throughput flow cytometry systems capable of processing 384-well plates in automated workflows have dramatically accelerated drug screening [12]. Key applications include:
- Target Validation: Confirming presence of drug targets on specific cell types and quantifying receptor density [16].
- Mechanism of Action Studies: Assessing intracellular signaling pathways, phosphorylation events, and transcriptional changes in response to drug treatment [10].
- Immunotherapy Development: Characterizing CAR-T cells and other engineered cellular therapies by measuring transduction efficiency, proliferation, and functional markers [10].
- Toxicity Assessment: Evaluating drug-induced apoptosis, cell cycle arrest, and mitochondrial membrane potential changes [13].
The technology's single-cell resolution provides crucial information about heterogeneous responses to therapeutic compounds that would be masked in bulk measurements, enabling more informed decisions about candidate selection and dosing [12].
Comparative Analysis with ELISA
While both flow cytometry and ELISA are essential immunochemical methods, they serve distinct purposes and provide complementary information. The table below summarizes their key differences:
Table 1: Comparison Between Flow Cytometry and ELISA
| Parameter | Flow Cytometry | ELISA |
|---|---|---|
| Analysis Level | Single-cell resolution [17] | Population average [17] |
| Sample Type | Cell suspensions [9] | Serum, plasma, supernatants [17] |
| Multiplexing Capacity | High (up to 50 parameters simultaneously) [10] | Limited (typically single analyte) [17] |
| Throughput | Moderate to high (up to thousands of cells/second) [12] | High (96-384 well plates) [17] |
| Data Output | Multidimensional: size, granularity, fluorescence [9] | Unidimensional: concentration [17] |
| Primary Applications | Cell classification, phenotyping, functional assays [14] | Soluble protein quantification [17] |
| Cost Considerations | Higher instrument and reagent costs [15] | Cost-effective for routine screening [17] |
A methodological comparison study examining cytokine measurements (IL-1β, IL-6, and TNF-α) demonstrated that while regression analysis showed general compatibility between flow cytometry and ELISA, Bland-Altman plots revealed significant differences in measurements for IL-1β and TNF-α, highlighting the importance of selecting the appropriate method based on the specific research question [18].
Essential Research Reagent Solutions
Successful flow cytometry experiments require carefully selected reagents optimized for specific applications. The following table outlines essential materials and their functions:
Table 2: Essential Flow Cytometry Reagents and Their Functions
| Reagent Category | Specific Examples | Function & Application |
|---|---|---|
| Specificity Reagents | Fluorochrome-conjugated antibodies [16] | Target specific cellular antigens for immunophenotyping; largest segment of flow cytometry reagents market (38.50% share in 2024) [16] |
| Dyes & Stains | Viability dyes (PI, 7-AAD), DNA binding dyes (DAPI), calcium indicators (Indo-1) [13] | Assess cell viability, apoptosis, cell cycle status, and functional assays; fastest-growing product segment [16] |
| Calibration & Validation Reagents | Compensation beads, calibration beads [16] | Standardize instrument performance, ensure reproducibility and accuracy; essential for quality control [16] |
| Buffers & Media | Staining buffer, fixation buffer, permeabilization buffer [13] | Maintain cell integrity during processing, enable intracellular staining, preserve sample for analysis [13] |
The global flow cytometry reagents market, valued at USD 2,925.75 Million in 2024, reflects the critical importance of these specialized reagents, with projections estimating growth to USD 5,536.69 Million by 2032 at a CAGR of 8.3% [16]. Antibodies constitute the largest product segment, while dyes and stains represent the fastest-growing category, driven by increasing demand for multiplexed panels and high-parameter experiments [16].
Experimental Protocols
Sample Preparation Protocol
Proper sample preparation is critical for obtaining reliable flow cytometry data. The following protocol outlines key steps for preparing peripheral blood mononuclear cells (PBMCs) for immunophenotyping:
Cell Harvesting and Suspension: Obtain single-cell suspension from blood, tissue, or culture. For solid tissues, enzymatic digestion (collagenase, trypsin) or mechanical dissociation may be required. Filter through 35-70μm mesh to remove clumps and ensure single-cell suspension [13].
Cell Staining:
- Surface Marker Staining: Aliquot 1×10^6 cells per tube. Add Fc receptor block to prevent nonspecific antibody binding. Add titrated antibody cocktails and incubate for 30 minutes in the dark at 4°C [13].
- Viability Staining: Include viability dye (e.g., propidium iodide, 7-AAD) to exclude dead cells from analysis [13].
- Intracellular Staining: For intracellular markers (cytokines, signaling proteins), fix cells with 4% paraformaldehyde, then permeabilize with methanol or saponin-based buffers before antibody staining [13].
Washing and Resuspension: Wash cells twice with cold flow cytometry buffer (PBS + 1% BSA + 0.1% sodium azide) to remove unbound antibody. Resuspend in 300-500μl buffer for acquisition [13].
Controls Setup: Include unstained cells, single-color controls for compensation, fluorescence-minus-one (FMO) controls for gating, and isotype controls for assessing nonspecific binding [13].
Instrument Setup and Quality Control
Proper instrument setup ensures optimal data quality and reproducibility:
Daily Startup and QC: Perform instrument quality control using calibration beads (e.g., CS&T beads) to verify laser alignment, fluidics, and optical detection stability. Document performance metrics [9].
Voltage Optimization: Adjust photomultiplier tube (PMT) voltages to place negative populations on-scale while avoiding signal saturation. Use reference samples to establish consistent voltage settings across experiments [13].
Compensation Setup: Acquire single-color stained controls for each fluorochrome in the panel. Calculate compensation matrices to correct for spectral overlap between detection channels. Apply compensation during acquisition or post-acquisition [13].
Gating Strategy: Establish hierarchical gating approach: (1) FSC-A vs SSC-A to identify cell population of interest, (2) FSC-A vs FSC-H to exclude doublets, (3) viability dye to exclude dead cells, (4) sequential marker gates to identify subpopulations [13].
Figure 2: Hierarchical Gating Strategy for Immunophenotyping
Future Directions and Emerging Applications
Flow cytometry technology continues to evolve with several emerging trends shaping its future applications in research and drug development:
Technological Innovations
High-Parameter Cytometry: Advanced spectral flow cytometers now enable simultaneous measurement of 40+ parameters per cell using full spectrum fingerprinting and sophisticated unmixing algorithms [10]. The Cytek Aurora system exemplifies this capability with its five-laser, 64-detector configuration [9].
High-Throughput Automation: Integrated systems like the ZE5 Cell Analyzer can process 96-well plates in less than 15 minutes and 384-well plates in under one hour, enabling large-scale compound screening and integration with robotic workcells [12].
Imaging Flow Cytometry: Instruments like the ImageStream MKII combine flow cytometry with microscopy, capturing high-resolution images of each cell in flow, enabling spatial analysis of protein localization and cell morphology [9].
Data Analysis and Integration
Artificial Intelligence and Machine Learning: AI algorithms are revolutionizing flow cytometry data analysis through automated population identification, rare event detection, and quality control. These tools help manage the complexity of high-dimensional datasets and reduce operator-dependent variability [10] [15].
Multi-Omics Integration: The combination of flow cytometry with genomic and proteomic approaches provides comprehensive cellular characterization. Mass cytometry (CyTOF) uses metal-conjugated antibodies and time-of-flight detection, dramatically expanding parameter capacity without spectral overlap [10].
The global flow cytometry market reflects these technological advancements, with projections estimating growth from USD 5.71 billion in 2024 to USD 12.11 billion by 2034, driven by increasing applications in drug development, biomarker discovery, and clinical diagnostics [15]. This expansion is particularly pronounced in the Asia-Pacific region, which is expected to register the fastest CAGR of 8.35% from 2025 to 2034, fueled by rapid healthcare infrastructure development and growing biotechnology sectors in China and India [15].
In the realm of immunochemical methods, Enzyme-Linked Immunosorbent Assay (ELISA) and Flow Cytometry stand as two foundational techniques that, while sometimes overlapping in application, serve distinct primary purposes. ELISA is predominantly used for the sensitive quantification of soluble molecules, whereas flow cytometry excels at cellular phenotyping and the analysis of cell populations at a single-cell level. Understanding their specific capabilities, optimal applications, and inherent limitations is crucial for researchers and drug development professionals designing robust experimental workflows. This guide provides an in-depth technical comparison of these methodologies, framing them within the context of selecting the right tool for specific research questions in immunology and biomedical science.
Core Principles and Technical Specifications
ELISA: Soluble Molecule Quantification
The Enzyme-Linked Immunosorbent Assay (ELISA) is a plate-based assay technique designed for detecting and quantifying soluble substances such as peptides, proteins, antibodies, and hormones in a solution [1] [2]. The core principle relies on the specific binding of an antibody to its target antigen, with detection achieved via an enzyme-linked conjugate that produces a measurable signal, typically a color change, upon substrate addition [19]. The key differentiator of ELISA is that it provides an average concentration of the analyte within the bulk sample, without preserving cellular context [20].
Common ELISA Formats:
- Direct ELISA: Uses a single enzyme-conjugated antibody for direct detection, offering speed but lower signal amplification [2].
- Indirect ELISA: Employs an unlabeled primary antibody and an enzyme-conjugated secondary antibody, providing greater sensitivity through signal amplification [1] [2].
- Sandwich ELISA: Requires two antibodies binding to different epitopes of the target antigen, resulting in high specificity and sensitivity, making it the preferred format for complex samples [1] [19].
- Competitive ELISA: Used for detecting small molecules; the sample antigen competes with a labeled reference antigen for a limited number of antibody-binding sites [1] [2].
Flow Cytometry: Single-Cell Analysis and Phenotyping
Flow cytometry is a laser-based technology that analyzes the physical and chemical characteristics of cells or particles as they flow in a fluid stream through a beam of light [21] [22]. It is a powerful tool for multiparameter analysis, allowing simultaneous measurement of multiple parameters—such as cell size, granularity, and the presence of specific surface or intracellular proteins—for individual cells within a heterogeneous population [20] [22]. This capability to assess thousands of cells per second provides unparalleled insight into cellular heterogeneity.
Advanced Flow Cytometry Modalities:
- Fluorescence-Activated Cell Sorting (FACS): A specialized form of flow cytometry that physically separates cell populations based on their fluorescent or light-scattering properties for downstream analysis [22].
- Intracellular Staining (ICS): Permits the detection of intracellular cytokines, transcription factors, and phospho-proteins (phospho-flow) following cell fixation and permeabilization [22].
- Multiplex Bead Arrays: Utilizes multiple sets of beads with distinct fluorescence intensities to simultaneously quantify multiple soluble analytes in a single sample, akin to a multiplexed ELISA [21] [23].
Comparative Analysis: Application Scope and Data Output
The decision to employ ELISA or flow cytometry hinges on the research question. The table below summarizes the core applications and strengths of each technique.
Table 1: Core Applications and Data Output of ELISA vs. Flow Cytometry
| Feature | ELISA | Flow Cytometry |
|---|---|---|
| Primary Application | Quantification of soluble analytes (e.g., cytokines, hormones, antibodies) [20] [2] | Cellular phenotyping, cell counting, and analysis of cell surface and intracellular markers [21] [22] |
| Sample Type | Serum, plasma, cell culture supernatant, tissue lysates [1] | Single-cell suspensions (e.g., blood, bone marrow, dissociated tissues) [22] |
| Data Output | Average concentration of the analyte in the sample [20] | Multi-parameter data for every individual cell analyzed |
| Key Strength | High sensitivity for quantifying low-abundance soluble molecules; high-throughput; cost-effective for large sample batches [20] | Analysis of cellular heterogeneity and identification of rare cell populations; functional assays (e.g., signaling, apoptosis) |
| Throughput | High (96 or 384-well plate format) [1] | Medium to High (rapid analysis of 30,000+ cells/second, but sample preparation can be time-consuming) [21] |
| Multiplexing Capability | Low (typically single-analyte per well) | High (simultaneous measurement of 10-50+ parameters per cell) [21] |
Decision Framework: Selecting the Appropriate Assay
When to Prioritize ELISA
- Quantifying Secreted Factors: Use ELISA when your goal is to measure the concentration of a specific protein (e.g., a cytokine like IL-6, a hormone like hCG, or a clinical biomarker like PSA) in a biological fluid [2]. For example, assessing vaccine efficacy by measuring anti-Mtb antibody levels in serum is a classic ELISA application [24].
- Large Sample Batch Analysis: When processing hundreds of samples for a single analyte, ELISA's 96- or 384-well plate format and simpler data analysis make it more efficient and cost-effective [20].
- Limited Cell Numbers or Sample Volume: If the sample is a crude lysate or supernatant with limited cell numbers, ELISA is preferable as it does not require a single-cell suspension.
When to Prioritize Flow Cytometry
- Immunophenotyping: Use flow cytometry to identify and characterize different cell types in a heterogeneous mixture. This is indispensable in immunology for profiling immune cells (e.g., T-cell subsets via CD4/CD8 staining) and in hematology for diagnosing and classifying leukemias and lymphomas [21].
- Analyzing Cellular Heterogeneity: When you need to understand the distribution of a marker within a population (e.g., what percentage of cells are positive, and how intensely do they express the protein?), flow cytometry is the only suitable choice [22].
- Complex Functional Studies: For assays that require correlating multiple parameters at a single-cell level—such as intracellular cytokine staining coupled with cell surface marker analysis, phospho-signaling studies, or apoptosis assays—flow cytometry is essential [22].
Table 2: Technical and Practical Considerations for Assay Selection
| Consideration | ELISA | Flow Cytometry |
|---|---|---|
| Budget & Cost | Lower instrument and per-assay cost; cost-effective for large batches [20] | High instrument acquisition and maintenance costs; expensive fluorescent reagents [20] [15] |
| Required Expertise | Straightforward protocol and data analysis; requires standard laboratory skills [20] | Requires significant technical expertise for panel design, instrument operation, and complex data analysis [20] |
| Dynamic Range & Reproducibility | High sensitivity with a broad dynamic range for concentration measurements [23] | Excellent for detecting relative expression levels across cells; highly reproducible for population frequencies [23] |
| Sample Processing | Simple; often requires no special processing beyond centrifugation | Complex; requires a high-quality single-cell suspension; may need cell staining, fixation, and permeabilization [22] |
Essential Research Reagent Solutions
The success of both ELISA and flow cytometry is critically dependent on the quality of reagents used. The following table outlines the core components required for each technique.
Table 3: Key Research Reagent Solutions for ELISA and Flow Cytometry
| Reagent / Material | Function | Application |
|---|---|---|
| Coated Microplates | 96- or 384-well polystyrene plates that passively bind proteins or antibodies to immobilize the capture reagent [1] [19] | ELISA |
| Matched Antibody Pairs | A set of two antibodies that bind to non-overlapping epitopes on the target antigen, used for capture and detection [1] | Sandwich ELISA |
| Enzyme Conjugates | Reporter enzymes (e.g., Horseradish Peroxidase-HRP, Alkaline Phosphatase-AP) linked to detection antibodies or streptavidin to catalyze signal generation [1] [2] | ELISA |
| Fluorochrome-Conjugated Antibodies | Antibodies tagged with fluorescent dyes (e.g., FITC, PE, APC) to detect specific cell markers. | Flow Cytometry |
| Viability Dyes | Fluorescent dyes (e.g., propidium iodide, LIVE/DEAD fixable stains) that exclude dead cells from analysis to improve data accuracy [22] | Flow Cytometry |
| Cell Stimulation & Fixation/Permeabilization Kits | Chemical agents to activate cellular processes (e.g., PMA/lonomycin) and buffers to fix cells and permeabilize membranes for intracellular staining [22] | Intracellular Flow Cytometry |
| Sheath Fluid | A buffered saline solution that hydrodynamically focuses the sample stream, ensuring single-cell interrogation by the laser [21] [22] | Flow Cytometry |
Experimental Workflow Protocols
Detailed Protocol: Sandwich ELISA
The following diagram outlines the key steps in a standard sandwich ELISA protocol.
Step-by-Step Methodology [19] [2]:
- Coating: Dilute the capture antibody in a carbonate-bicarbonate buffer (pH 9.4) or PBS (pH 7.4) to a concentration of 2–10 μg/mL. Add 100 μL per well to a 96-well microplate. Seal the plate and incubate for 15-18 hours at 4°C or for 1-2 hours at 37°C.
- Washing and Blocking: Discard the coating solution and wash the plate 3 times with a washing buffer (e.g., PBS containing 0.05% Tween 20). Add 200-300 μL of a blocking buffer (e.g., 1-5% BSA or non-fat dry milk in PBS) to each well. Incubate at 37°C for 1-2 hours to cover any remaining protein-binding sites.
- Sample and Standard Incubation: Wash the plate 3 times. Prepare a serial dilution of your standard for a standard curve. Add 100 μL of standards or diluted samples to appropriate wells. Incubate at 37°C for 1-2 hours.
- Detection Antibody Incubation: Wash the plate 3-5 times. Add 100 μL of the biotinylated or enzyme-conjugated detection antibody (diluted in blocking buffer) to each well. Incubate at 37°C for 1 hour.
- Enzyme Conjugate Incubation (if needed): Wash the plate 3-5 times. If using a biotinylated detection antibody, add 100 μL of streptavidin-HRP (diluted per manufacturer's instructions). Incubate at 37°C for 30-60 minutes.
- Signal Development and Detection: Wash the plate 3-5 times. Add 100 μL of substrate solution (e.g., TMB for HRP) to each well. Incubate in the dark at room temperature for 5-30 minutes until color develops. Stop the reaction by adding 50-100 μL of stop solution (e.g., 1M H₂SO₄ for TMB). Immediately measure the absorbance at the appropriate wavelength (e.g., 450 nm for TMB) using a microplate reader.
Detailed Protocol: Immunophenotyping by Flow Cytometry
The workflow for a typical cell surface immunophenotyping experiment is as follows.
Step-by-Step Methodology [21] [22]:
- Sample Preparation: Isolate cells (e.g., Peripheral Blood Mononuclear Cells (PBMCs) from blood using density gradient centrifugation) and resuspend in a FACS buffer (PBS with 1-2% FBS and 0.1% sodium azide). Filter cells through a 70-μm nylon mesh to obtain a single-cell suspension and remove clumps. Count cells and determine viability.
- Cell Staining (Cell Surface):
- Viability Staining (Optional but Recommended): Resuspend cell pellet in a viability dye (e.g., fixable viability dye) diluted in PBS. Incubate for 15-30 minutes at 4°C in the dark. Wash with FACS buffer.
- Fc Receptor Blocking: Incubate cells with an Fc receptor blocking agent (e.g., human or mouse IgG) for 10-15 minutes at 4°C to reduce non-specific antibody binding.
- Antibody Staining: Prepare a master mix of fluorochrome-conjugated antibodies diluted in FACS buffer. Add the antibody mix to the cell pellet, mix gently, and incubate for 20-30 minutes at 4°C in the dark.
- Washing and Fixation: Wash cells twice with FACS buffer to remove unbound antibody. Resuspend the cell pellet in FACS buffer, often with the addition of 1-4% paraformaldehyde for fixation (optional, stabilizes the sample for later analysis).
- Data Acquisition: Resuspend the final cell pellet in an appropriate volume of FACS buffer for acquisition. Pass the cells through the flow cytometer. Ensure proper instrument performance by running calibration beads before sample acquisition. Collect data for a sufficient number of events (e.g., 10,000 events for the population of interest).
- Data Analysis: Use flow cytometry analysis software (e.g., FlowJo, FCS Express). First, gate on cells based on forward scatter (FSC-A, correlates with size) and side scatter (SSC-A, correlates with granularity) to exclude debris. Then, gate on single cells using FSC-H vs FSC-A to exclude doublets. Finally, apply fluorescent markers to identify and quantify specific cell populations (e.g., CD3+CD4+ T-cells).
ELISA and flow cytometry are not competing techniques but rather complementary pillars of modern biomedical research. ELISA remains the gold standard for the sensitive and quantitative measurement of soluble biomarkers, hormones, and cytokines in a high-throughput manner. In contrast, flow cytometry is the unequivocal choice for the dissection of cellular heterogeneity, immunophenotyping, and complex functional single-cell analyses. The choice between them is not a matter of which is superior, but which is the right tool for the specific biological question at hand. A well-designed research plan, particularly in complex fields like immunology and drug development, will often leverage the unique strengths of both methodologies to build a comprehensive and data-rich understanding of biological systems.
Immunochemical methods such as Enzyme-Linked Immunosorbent Assay (ELISA) and flow cytometry form the cornerstone of modern biomedical research and clinical diagnostics. These techniques leverage the specific binding between antigens and antibodies to detect and quantify biological molecules, providing crucial insights into disease mechanisms, immune responses, and therapeutic efficacy. The instrumentation required to perform these analyses ranges from fundamental plate readers to sophisticated cell sorters, each offering distinct capabilities and applications. ELISA operates primarily through plate-based systems where detection occurs via enzymatic reactions, while flow cytometry utilizes laser-based technology to analyze physical and chemical characteristics of cells or particles in suspension [25] [20]. This instrumentation overview examines the core technologies, their operating principles, and their complementary roles in advancing immunology research and drug development.
Understanding the capabilities and limitations of each platform enables researchers to select appropriate methodologies for their specific experimental needs. Plate readers provide high-throughput quantification of soluble analytes, flow cytometers offer multi-parameter analysis at single-cell resolution, and cell sorters add the capability to physically isolate specific populations for downstream applications. Recent technological advancements have further blurred the lines between these platforms, with spectral flow cytometry expanding multiplexing capabilities and integrated systems offering unprecedented analytical power [26] [27]. This guide explores these instruments within the context of ELISA and flow cytometry workflows, providing researchers with a comprehensive framework for method selection, experimental design, and data interpretation.
Core Instrumentation Platforms
Plate Readers and ELISA Systems
Plate readers represent the fundamental instrumentation for ELISA methodologies, providing the platform for detecting and quantifying soluble analytes across multiple samples simultaneously. These systems operate by measuring light absorption, fluorescence, or luminescence in microplate formats, typically processing 96 or 384 samples in a single run. The standard ELISA workflow involves immobilizing antigens or antibodies to plate surfaces, applying samples and detection reagents, and finally measuring the signal generated by enzyme-substrate reactions [20]. This process makes plate readers ideal for high-throughput quantification of proteins, antibodies, hormones, and cytokines in various biological matrices including serum, plasma, and cell culture supernatants.
The analytical strength of plate reader-based ELISA systems lies in their robustness, sensitivity, and cost-effectiveness for processing large sample batches. Modern plate readers can detect minute quantities of target molecules, with sensitivities often reaching picogram per milliliter levels, making them sufficiently sensitive for most clinical and research applications [20]. However, a significant limitation of conventional ELISA is its lack of cellular context, as the technique provides bulk measurement of analyte concentrations without information about the cells producing the molecules or their heterogeneity within samples [20]. This constraint has driven the development of more advanced cellular analysis platforms while maintaining ELISA's position as a workhorse technique for quantitative bioanalysis.
Flow Cytometers
Flow cytometers represent a significant technological advancement beyond plate readers, enabling multi-parameter analysis at the single-cell level. These instruments operate on the principle of hydrodynamic focusing, where a single-cell suspension is injected into a stream of fluid and precisely aligned to pass through multiple laser beams at rates of thousands of cells per second [25]. As cells intersect with these lasers, they scatter light and emit fluorescence from labeled antibodies or intrinsic cellular components, generating rich data profiles for each individual event. Detectors then capture this light, converting it into digital signals that can be analyzed to characterize complex cell populations based on size, granularity, and biomarker expression.
Conventional flow cytometers utilize a compensation approach to account for spectral spillover between fluorophore detectors, but this method historically limited the number of parameters that could be simultaneously measured. The emergence of spectral flow cytometry has revolutionized the field by capturing the full emission spectrum of each fluorophore across multiple detectors, then using sophisticated algorithms to "unmix" these overlapping signals [26] [27]. This technological advancement enables researchers to simultaneously analyze dozens of parameters on a single cell, transforming the study of cellular, functional, and phenotypic diversity in immunology research [26]. The increased dimensionality of data generated by spectral flow cytometers has correspondingly driven the development of advanced computational analysis techniques, including dimensionality reduction and clustering algorithms, to extract meaningful biological insights from these complex datasets [26].
Cell Sorters
Cell sorters represent the most advanced category of flow-based instrumentation, combining analytical capabilities with physical cell separation. These systems detect cells of interest based on their light scattering and fluorescence properties, then use sophisticated mechanisms to deflect these cells into collection tubes or plates for downstream applications. The most common sorting technology, electrostatic droplet sorting, involves charging fluid droplets containing target cells as they break from the stream, then deflecting these charged droplets into collection containers using electrostatic fields [27]. This process enables researchers to obtain highly pure populations of specific cell types from heterogeneous mixtures, supporting applications including functional assays, cell line development, and single-cell analysis.
Modern cell sorters have addressed historical challenges including effects on cell viability, long run times, and purity issues through technological innovations. Instruments like the Bigfoot Spectral Cell Sorter can sort a 96-well plate in less than 8 seconds thanks to multi-way plate sorting deflection capability and integrated monitoring systems [27]. The incorporation of spectral unmixing technology into cell sorters has further enhanced their utility, allowing researchers to design more complex panels that identify rare cell populations with greater precision. These advancements make cell sorting an increasingly powerful tool for immunology research, particularly as the field moves toward more sophisticated analyses requiring isolated cell populations for functional studies or -omics applications [27].
Comparative Analysis of Platforms
Technical Specifications and Applications
The selection between plate readers, flow cytometers, and cell sorters depends fundamentally on research objectives, as each platform offers distinct advantages and limitations. ELISA systems with plate readers excel at quantifying soluble analytes in sample supernatants, while flow cytometers provide detailed cellular phenotype information at single-cell resolution, and cell sorters add the capability to isolate specific populations for further study. The following table summarizes the key characteristics, strengths, and limitations of each platform:
Table 1: Comparative Analysis of Immunochemical Instrumentation Platforms
| Platform | Key Applications | Key Strengths | Major Limitations |
|---|---|---|---|
| Plate Readers (ELISA) | Quantifying soluble proteins, antibodies, hormones; high-throughput screening | Simplicity, robustness, cost-effectiveness for large sample batches, high sensitivity for analyte detection | Lack of cellular context, fixed parameters per assay, limited multiplexing in conventional formats |
| Flow Cytometers | Immunophenotyping, intracellular signaling analysis, cell cycle studies, apoptosis detection | Multi-parameter single-cell analysis, high-throughput cellular profiling, dynamic fluorescence range | Instrument cost and complexity, technical expertise required, data analysis challenges for high-parameter panels |
| Cell Sorters | Isolation of specific cell populations, single-cell cloning, progenitor cell isolation, rare cell population sorting | Combines analysis with physical separation, high purity cell populations, supports downstream functional studies | Higher instrument cost, potential impacts on cell viability and function, longer setup and optimization times |
Methodological Comparison: ELISA vs. Flow Cytometry
The methodological differences between ELISA and flow cytometry extend beyond their instrumentation to encompass their fundamental approaches to biomarker detection. Several studies have directly compared these techniques for specific applications, particularly in cytokine measurement. While regression analysis often shows good correlation between the methods, more sophisticated statistical approaches like Bland-Altman plots reveal more nuanced differences in their agreement [28]. One study comparing IL-1β, IL-6, and TNF-α measurements found that while both methods showed compatibility for IL-6, they demonstrated dissimilarity for IL-1β and TNF-α measurements when analyzed with Bland-Altman methodology [28].
The emergence of bead-based flow cytometry assays has further expanded the applications of flow cytometry to include soluble analyte detection, traditionally the domain of ELISA. These multiplex assays use fluorescently-coded microspheres as solid supports for capture antibodies, enabling simultaneous quantification of multiple analytes in small sample volumes [29]. Recent innovations have simplified these assays through lyophilization of reagents and one-step detection protocols, reducing operational time from over 3 hours to approximately 1.5 hours while maintaining performance comparable to conventional approaches [30]. This advancement demonstrates how technological improvements continue to enhance the efficiency and accessibility of flow cytometry-based methodologies.
Experimental Protocols and Workflows
ELISA Protocol and Validation
The standard ELISA protocol involves multiple critical steps that must be carefully optimized and validated to ensure reliable results. A comprehensive validation process assesses key parameters including precision, accuracy, sensitivity, specificity, and robustness [31]. The following workflow outlines the core steps in a sandwich ELISA procedure, which is commonly used for quantitative protein detection:
Table 2: Key Steps in ELISA Validation and Optimization
| Validation Parameter | Assessment Method | Acceptance Criteria |
|---|---|---|
| Precision | Intra-assay: multiple replicates on same plate; Inter-assay: replicates across different days | Coefficient of variation (CV) typically <10-15% |
| Accuracy | Spike-and-recovery experiments with known analyte concentrations | Recovery rates of 80-120% generally acceptable |
| Sensitivity | Analysis of standard deviation of blank samples and standard curve slope | Lower limit of detection (LLOD) and quantification (LLOQ) established |
| Specificity | Testing cross-reactivity with related molecules | Minimal interference from structurally similar compounds |
| Linearity | Serial dilutions of samples across assay range | Consistent measured concentrations after accounting for dilution |
Figure 1: ELISA Experimental Workflow. Critical wash steps (red circles) remove unbound reagents between major procedure stages.
Flow Cytometry Staining Protocol
Flow cytometry sample preparation requires meticulous attention to cell viability, antibody titration, and controls to ensure accurate data interpretation. The following protocol outlines the key steps for intracellular staining, which enables detection of cytokines and other internal proteins [25]:
Figure 2: Flow Cytometry Intracellular Staining Workflow. The protocol diverges based on whether researchers are targeting extracellular markers only or both surface and intracellular proteins.
For intracellular targets, fixation is typically performed using 1-4% paraformaldehyde (15-20 minutes on ice) or 90% methanol (10 minutes at -20°C), while permeabilization uses detergents like Triton X-100 (0.1-1%) for nuclear antigens or saponin (0.2-0.5%) for cytoplasmic targets [25]. Centrifugation steps typically occur at 200-300 × g for 5 minutes at 4°C to preserve cell integrity [25]. Recent innovations have simplified these protocols through lyophilized reagent spheres that combine capture beads and detection antibodies, enabling one-step incubation that reduces total assay time from over 3 hours to approximately 1.5 hours while maintaining performance [30].
Advanced Applications and Integration
High-Parameter Analysis and Computational Approaches
The evolution of flow cytometry toward high-parameter analysis has fundamentally transformed data analysis strategies. While traditional flow cytometry data has been analyzed using a hierarchy of two-dimensional plots with manual gating, spectral flow cytometry datasets with dozens of parameters require computational techniques for meaningful interpretation [26]. These approaches include dimensionality reduction methods like t-Stochastic Neighbor Embedding (t-SNE) and Uniform Manifold Approximation and Projection (UMAP), which visualize high-dimensional data in two-dimensional maps while preserving the main data structure [26]. Clustering algorithms such as FlowSOM and PhenoGraph automatically identify cell populations based on marker expression patterns, reducing subjectivity and uncovering populations that might be overlooked through manual analysis [26].
The integration of machine learning with flow cytometry data continues to advance the field's analytical capabilities. Supervised learning approaches including logistic regression, random forest, and support vector machines can predict clinical outcomes or disease severity based on complex cytokine profiles or immunophenotyping data [30]. For example, researchers have used these models to predict HBV viral load or COVID-19 severity using cytokine panels, demonstrating the clinical utility of these computational integrations [30]. The application of unsupervised learning techniques further enables biomarker discovery and patient stratification without prior hypotheses, accelerating the identification of novel biological insights from high-dimensional datasets.
Emerging Technologies and Future Directions
The ongoing innovation in immunochemical instrumentation focuses on increasing multiplexing capacity, improving accessibility, and enhancing integration between platforms. Spectral flow cytometry represents one major advancement, with systems now capable of detecting up to 60 parameters simultaneously by analyzing full emission spectra rather than relying on traditional compensation approaches [27]. The development of simplified, lyophilized reagent formats addresses cold chain requirements and enhances assay robustness, potentially expanding access to flow cytometry-based testing in resource-limited settings [30]. Integrated systems that combine cell sorting with downstream molecular analysis, such as single-cell sequencing, further bridge the gap between protein-level and gene-level analyses.
The convergence of ELISA and flow cytometry technologies continues through advanced bead-based platforms that offer the multiplexing advantages of flow cytometry with the operational simplicity approaching traditional ELISA. These systems use fluorescently barcoded beads of varying sizes and fluorescence intensities to simultaneously detect multiple analytes in single samples, significantly increasing throughput while conserving precious clinical specimens [29]. One recently developed assay enables simultaneous measurement of IgM, IgG, and IgA antibodies against SARS-CoV-2 across 624 samples within 2 hours, demonstrating the powerful throughput capabilities of these integrated approaches [29]. As these technologies continue to evolve, they promise to further blur the traditional boundaries between plate-based and flow-based immunochemical methods.
Essential Research Reagent Solutions
Successful implementation of ELISA and flow cytometry methodologies depends on carefully selected reagents and materials optimized for each platform. The following table details key reagent solutions and their specific functions in experimental workflows:
Table 3: Essential Research Reagents for Immunochemical Methods
| Reagent Category | Specific Examples | Functions and Applications |
|---|---|---|
| Capture & Detection Antibodies | Primary antibodies, secondary antibody conjugates | Specific antigen recognition; signal amplification through enzyme or fluorophore conjugation |
| Cell Staining Reagents | Viability dyes (7-AAD, DAPI), fixation buffers (1-4% PFA), permeabilization detergents (Triton X-100, saponin) | Live/dead cell discrimination; cellular structure preservation; intracellular antigen access |
| Signal Detection Systems | Enzyme substrates (TMB, ABTS), fluorophore-conjugated antibodies (PE, APC, FITC) | Signal generation through colorimetric, fluorescent, or chemiluminescent detection |
| Assay Buffers and Solutions | Coating buffers, blocking buffers (BSA, serum), wash buffers (PBS with Tween-20) | Optimal antibody binding; reduction of non-specific binding; removal of unbound reagents |
| Bead-Based Multiplexing Systems | Fluorescently-coded microspheres, carboxylated beads for protein coupling | Multiplex analyte detection; high-throughput screening; minimal sample volume requirements |
The instrumentation landscape for immunochemical methods encompasses complementary technologies that address distinct research needs. Plate readers serving ELISA methodologies provide robust, cost-effective solutions for soluble analyte quantification, while flow cytometers enable deep cellular profiling at single-cell resolution. Cell sorters extend these analytical capabilities to include physical separation of target populations for downstream functional studies. The ongoing technological innovations in spectral analysis, computational methods, and reagent engineering continue to expand the applications and accessibility of these platforms. Researchers can leverage this instrumentation overview to make informed decisions about method selection, experimental design, and data interpretation within the broader context of their immunology research objectives and resource constraints. As these technologies continue to converge and evolve, they promise to further enhance our understanding of immune function and accelerate the development of novel therapeutic interventions.
Understanding Light Scatter and Fluorescence in Flow Cytometric Analysis
Flow cytometry is a laser-based technology that provides rapid multi-parametric analysis of single cells in solution as they flow past single or multiple lasers [32]. This technique enables researchers to simultaneously measure both physical and chemical characteristics of a population of cells or particles, making it indispensable in modern immunology, molecular biology, and drug development research [33]. The core principle involves illuminating individual cells with laser light and detecting the resulting light scatter patterns and fluorescence emissions that provide rich information about cellular properties.
When integrated into a broader research strategy involving immunochemical methods like ELISA, flow cytometry offers complementary single-cell resolution that bulk measurement techniques cannot provide. While ELISA excels at quantifying soluble proteins in sample supernatants, flow cytometry reveals cellular heterogeneity and identifies rare cell populations within complex mixtures [20] [17]. This technical guide explores the fundamental principles of light scatter and fluorescence detection in flow cytometry, providing researchers with the knowledge needed to design, execute, and interpret robust flow cytometric assays.
Fundamental Principles of Light Scatter
Light Scatter Measurements
As cells pass through the laser beam in a flow cytometer, they interact with the laser light, causing the light to scatter in various directions. This phenomenon of light scattering provides two primary types of structural information about each cell without requiring any fluorescent labels [32] [34].
Forward Scatter (FSC): FSC measures light that is scattered along the same axis as the laser beam, approximately 0.5-10 degrees from the laser's path. This parameter primarily correlates with cell size and volume, as larger cells cause more light to be scattered in the forward direction. The measurement is typically detected by a photodiode positioned in front of the laser intercept [32] [33].
Side Scatter (SSC): SSC measures light that is scattered at approximately 90 degrees to the laser beam. This parameter indicates cellular granularity and internal complexity, as light is refracted and reflected by internal structures such as granules, nucleus, and organelles. Cells with more complex internal structures will produce higher SSC signals. SSC is collected by lenses positioned perpendicular to the laser path and is detected by photomultiplier tubes (PMTs) for enhanced sensitivity [32] [34].
The combination of FSC and SSC measurements allows researchers to distinguish between major cell populations in a heterogeneous sample, such as blood, where lymphocytes, monocytes, and granulocytes each exhibit distinctive light scattering signatures [35].
Figure 1: Light Scatter Detection in Flow Cytometry
Data Visualization of Light Scatter
Light scatter data is typically visualized using density plots or dot plots that display FSC versus SSC, with each dot representing an individual cell event [35]. These plots enable researchers to identify distinct cell populations based on their physical characteristics and establish electronic "gates" around populations of interest for further fluorescence analysis.
Principles of Fluorescence Detection
Fluorescence in Flow Cytometry
While light scatter provides structural information, fluorescence detection enables the measurement of specific molecular markers on or within cells. Fluorescence analysis requires cells to be labeled with fluorochrome-conjugated reagents that emit light at specific wavelengths when excited by the laser [32].
The fluorescence process involves three key stages:
Excitation: When a fluorochrome-conjugated antibody or dye attached to a cellular component (e.g., surface protein, DNA) passes through the laser beam, it absorbs light energy at a specific wavelength, elevating electrons to an excited state [34].
Emission: As the excited electrons return to their ground state, they release energy in the form of photons of longer wavelength (lower energy) than the excitation light. This emitted light constitutes the fluorescence signal [32] [33].
Detection: The emitted fluorescence is collected by lenses and directed through a series of optical filters to specific detectors (typically PMTs or avalanche photodiodes). Dichroic filters steer fluorescent light to specific detectors, while bandpass filters determine the precise wavelengths of light that reach each detector, allowing measurement of specific fluorochromes [32].
Fluorescence-Activated Cell Sorting (FACS)
A specialized application of flow cytometry is Fluorescence-Activated Cell Sorting (FACS), which physically separates cells based on their light scattering and fluorescence characteristics [33]. In FACS, the stream containing cells is broken into droplets, and droplets containing cells with desired characteristics are electrically charged and deflected into collection tubes using electrostatic deflection plates [32] [33].
Instrumentation and Detection Systems
Flow Cytometer Components
Traditional flow cytometers consist of three integrated systems that work together to analyze cells [32] [34] [33]:
Fluidics System: This system consists of sheath fluid (typically buffered saline) that is pressurized to hydrodynamically focus the sample core, ensuring that cells pass through the laser intercept in single file. Precise fluidic control is essential for consistent illumination and measurement.
Optical System: The optical system includes excitation sources (lasers of various wavelengths) and collection optics (lenses, filters, and detectors). Modern flow cytometers commonly feature multiple lasers (e.g., 405nm violet, 488nm blue, 640nm red) to excite different fluorochromes simultaneously. The collection optics include dichroic mirrors that reflect or transmit specific wavelengths and bandpass filters that isolate narrow wavelength ranges for specific detectors.
Electronics System: This system converts the analog light signals detected by the PMTs into digital signals that can be processed by computer software. The electronic components also control the sorting mechanisms in cell sorters and manage the timing correlations between different measurements on the same cell.
Advanced Cytometry Platforms
Recent technological advances have led to specialized cytometry platforms [32]:
Spectral Analyzers: These instruments measure the entire emission spectrum of each fluorochrome to create a "spectral fingerprint," then computationally "unmix" these signals during analysis. This approach reduces the need for compensation and enables more parameters to be measured simultaneously.
Mass Cytometers (CyTOF): These systems replace fluorescent tags with heavy metal ion-tagged antibodies and detect cells using time-of-flight mass spectrometry. This eliminates spectral overlap issues but does not allow for cell sorting.
Imaging Cytometers: These instruments combine flow cytometry with fluorescence microscopy, capturing images of individual cells as they flow through the system, allowing for subcellular localization studies.
Table 1: Common Lasers and Their Applications in Flow Cytometry
| Laser Wavelength | Common Name | Typical Applications |
|---|---|---|
| 355 nm | Ultraviolet (UV) | DNA content analysis, calcium flux studies |
| 405 nm | Violet | Vital dyes, fluorescent proteins (CFP, mCerulean) |
| 488 nm | Blue | FITC, PE, GFP, cell viability, side scatter |
| 532 nm | Green | PE dye analogs, some fluorescent proteins |
| 561 nm | Green-Yellow | PE, PI, mOrange, mCherry |
| 640 nm | Red | APC, Cy5, Alexa Fluor 647 |
Research Reagent Solutions
Successful flow cytometry experiments depend on appropriate fluorochrome-conjugated reagents and controls [32] [17]. The key reagents include:
Table 2: Essential Research Reagents for Flow Cytometry
| Reagent Category | Specific Examples | Primary Functions |
|---|---|---|
| Fluorochrome-Conjugated Antibodies | CD3-FITC, CD4-APC, CD8-PE | Detection of specific cell surface or intracellular markers |
| Viability Dyes | Propidium Iodide, 7-AAD | Exclusion of dead cells from analysis |
| DNA Binding Dyes | DAPI, Hoechst 33342 | Cell cycle analysis, DNA content measurement |
| Ion Indicator Dyes | Indo-1, Fluo-3 | Measurement of calcium flux and ion concentrations |
| Fluorescent Proteins | GFP, mCherry, mOrange | Reporter gene expression, transfection efficiency |
When designing multi-color flow cytometry panels, careful consideration must be given to fluorochrome brightness, antigen density, and spectral overlap to ensure optimal resolution of all parameters [33]. Antibody titration experiments are essential to determine the optimal concentration for staining while minimizing background signal [34].
Experimental Protocol for Cell Surface Staining
The following protocol provides a standardized methodology for the detection of cell surface antigens using fluorochrome-conjugated antibodies, a fundamental application in immunophenotyping studies [32] [35]:
Sample Preparation
- Begin with a single-cell suspension at a concentration of 1-10×10^6 cells/mL in staining buffer (e.g., PBS containing 1-2% fetal bovine serum and 0.1% sodium azide).
- Include viability staining using dyes such as propidium iodide or 7-AAD to exclude dead cells from analysis.
- Centrifuge cells at 300-500 × g for 5 minutes and carefully aspirate supernatant.
Antibody Staining
- Resuspend cell pellet in 100 μL of staining buffer containing fluorochrome-conjugated antibodies at predetermined optimal concentrations.
- Incubate for 20-30 minutes at 4°C in the dark to prevent fluorochrome degradation and internalization of surface markers.
- Add 2 mL of staining buffer to wash cells, centrifuge at 300-500 × g for 5 minutes, and carefully aspirate supernatant.
- Repeat wash step to ensure removal of unbound antibodies.
Fixation and Acquisition
- Resuspend cells in 200-500 μL of staining buffer or 1-2% paraformaldehyde for fixation if analysis will not be performed immediately.
- Transfer cells through a 35-40 μm strainer to remove aggregates that could clog the instrument.
- Acquire data on flow cytometer within 24 hours if fixed, or immediately if live cells are used.
Figure 2: Cell Surface Staining Workflow
Data Analysis and Interpretation
Gating Strategy
Flow cytometry data analysis requires a systematic gating strategy to identify populations of interest [35]. The standard approach involves sequential steps:
Doublet Discrimination: Plot FSC-Area versus FSC-Height or FSC-Width to exclude cell aggregates and ensure analysis of single cells.
Live Cell Selection: Gate on viability dye-negative population to exclude dead cells.
Morphological Gating: Create an FSC versus SSC dot plot to identify populations based on size and granularity (e.g., lymphocytes, monocytes, granulocytes in peripheral blood).
Fluorescence Analysis: Create successive two-dimensional dot plots or histograms to analyze fluorescence parameters of interest.
Data Visualization
Flow cytometry data is typically presented in two main formats [35]:
Histograms: Single-parameter displays that show the distribution of fluorescence intensity or light scatter for a single parameter. These are useful for comparing expression levels of a single marker between samples.
Scatter Plots (Dot Plots): Two-parameter displays where each dot represents an individual cell, plotted according to two measured characteristics. Quadrant gates are often applied to distinguish positive and negative populations for two different markers.
Table 3: Comparison of Flow Cytometry with ELISA in Immunochemical Research
| Parameter | Flow Cytometry | ELISA |
|---|---|---|
| Analysis Level | Single-cell resolution | Population average |
| Multiplexing Capacity | High (up to 30+ parameters simultaneously) | Limited (typically 1 analyte per well) |
| Sample Type | Cell suspensions in solution | Serum, plasma, supernatants |
| Throughput | Moderate (thousands of cells/second) | High (96-384 well plates) |
| Information Obtained | Cell size, granularity, multiple markers per cell | Total analyte concentration |
| Instrument Cost | High | Relatively low |
| Primary Applications | Immunophenotyping, intracellular signaling, cell sorting | Quantification of soluble proteins, clinical serology |
Advanced Applications and Techniques
Multicolor Flow Cytometry
The development of new fluorochromes and instruments with multiple lasers has enabled multicolor flow cytometry, where 12 or more parameters can be measured simultaneously on single cells [32] [33]. This advanced application requires careful panel design to match bright fluorochromes with low-abundance antigens and dim fluorochromes with highly expressed markers, while minimizing spectral overlap between channels.
Intracellular Staining
For detection of intracellular cytokines, transcription factors, or phospho-proteins, cells must be fixed and permeabilized before antibody staining to allow access to intracellular epitopes [17]. This technique often requires specific stimulation protocols and protein transport inhibitors to capture transient signaling events.
Advanced Data Analysis
Traditional manual gating is increasingly supplemented with high-dimensional data analysis algorithms [32] [36]. Tools such as t-distributed Stochastic Neighbor Embedding (t-SNE), Uniform Manifold Approximation and Projection (UMAP), and clustering algorithms help identify novel cell populations in complex datasets that might be missed with conventional analysis approaches [36].
Quality Control and Standardization
Reproducible flow cytometry requires rigorous quality control measures and standardization [34]:
Instrument Calibration: Regular performance tracking using fluorescent beads to ensure consistent laser alignment, fluidics, and detector sensitivity.
Experimental Controls: Appropriate controls including unstained cells, fluorescence-minus-one (FMO) controls, and isotype controls to establish background signals and gating boundaries.
Reagent Validation: Careful antibody titration and validation for each application to ensure specificity and optimal signal-to-noise ratio.
Adherence to these quality control practices is particularly critical when developing flow cytometry assays for regulated environments such as clinical diagnostics or drug development [34] [17].
The principles of light scatter and fluorescence detection form the foundation of flow cytometric analysis, enabling researchers to characterize complex cell populations with unprecedented resolution. When applied within a comprehensive research strategy that may include complementary techniques like ELISA, flow cytometry provides powerful insights into cellular heterogeneity and function at the single-cell level.
Mastery of these core principles—from understanding how FSC and SSC relate to cellular physical properties to optimizing fluorescent reagent panels and implementing appropriate gating strategies—empowers researchers to design more robust experiments and extract meaningful biological insights from their data. As flow cytometry continues to evolve with spectral analysis, mass cytometry, and improved computational approaches, these fundamental principles will remain essential for leveraging the full potential of this versatile technology in immunochemical research and drug development.
Protocols in Practice: Step-by-Step Methods and Advanced Applications
The enzyme-linked immunosorbent assay (ELISA) is a foundational immunochemical technique designed for the sensitive and specific detection and quantification of soluble substances such as peptides, proteins, antibodies, and hormones [1]. As a plate-based assay, its versatility allows it to be applied to diverse sample types, including serum, plasma, cell culture supernatants, and bodily fluids, making it indispensable in both basic research and drug development [37] [38]. The core principle of ELISA relies on the specific binding of an antibody to its target antigen, followed by an enzymatic reaction that generates a measurable signal [1]. The entire workflow, from initial plate coating to final signal detection, can be broken down into three critical stages: capture, blocking, and detection/quantification, with numerous wash steps in between to ensure the removal of unbound reagents [37]. Mastering this workflow is essential for researchers and drug development professionals aiming to generate robust, reproducible, and quantitative data.
The Coating and Blocking Phase
Plate Coating and Capture
The first stage of any ELISA involves the immobilization, or coating, of a biomolecule onto the solid phase of a microplate. This crucial step establishes the foundation for the entire assay.
- Microplate Selection: Microplates are typically flat-bottomed and made of polystyrene [37]. The choice of plate color is dictated by the detection method: clear plates for colorimetric detection, black plates for fluorescent detection, and black or white plates for chemiluminescent detection [37] [1]. It is critical to use plates with a high protein-binding capacity and low well-to-well variation (CV <5%) to ensure assay reproducibility [1].
- Coating Process: Immobilization is achieved through passive adsorption, where the protein (either the target antigen or a capture antibody) is diluted in a suitable, protein-free coating buffer and incubated in the microplate wells [37]. The most common coating buffer is 0.2M carbonate/bicarbonate at an alkaline pH (8.4-9.6), which facilitates binding via hydrophobic interactions [37] [39]. Phosphate-buffered saline (PBS) is also frequently used [1]. Coating concentrations typically range from 1-10 µg/mL, and plates can be incubated for several hours at 37°C or overnight at 4°C to allow for optimal binding [1] [39].
- Alternative Coating Strategies: For oriented binding that preserves antibody functionality, plates pre-coated with Protein A, Protein G, streptavidin, or biotin can be used [37]. However, Protein A or G plates should be avoided in sandwich ELISA formats, as detection antibodies may also bind to them [37].
Blocking
After coating, all remaining unsaturated binding sites on the polystyrene surface must be blocked to prevent non-specific binding of reagents in subsequent steps, which is a major contributor to high background signal [37] [39].
- Blocking Agents: Bovine Serum Albumin (BSA) is widely used as a blocking agent, often at a concentration of 1% in PBS [39]. However, care must be taken to use BSA certified as IgG- and protease-free to avoid background from contaminating immunoglobulins or protein degradation [37]. Normal serums (e.g., 5% v/v) derived from non-immunized animals are a highly effective alternative, particularly when the serum is from the same species as the labeled detection antibody, as this helps prevent antibody binding to conserved sequences and Fc-receptors [37].
- Blocking Protocol: Blocking is performed by adding the blocking buffer to each well after removing the coating solution. The plate is then incubated for 1-2 hours at room temperature or overnight at 4°C [39]. After incubation, the blocking buffer is removed, and the plate is washed 3-5 times with a wash buffer, such as PBS or Tris-buffered saline containing a mild detergent like 0.05% Tween-20, to remove any unbound blocking agent [39].
Detection Strategies and Substrate Development
Antibody Considerations for Detection
The specificity and sensitivity of an ELISA are determined by the antibodies used. For a sandwich ELISA, which provides high specificity, a matched antibody pair is required: a capture antibody and a detection antibody that recognize different, non-overlapping epitopes on the target antigen [37] [1].
- Antibody Validation and Clonality: Antibodies must be specifically validated for the ELISA application to ensure high-affinity and specific binding [37]. Researchers can choose between monoclonal and polyclonal antibodies. Monoclonal antibodies offer superior consistency and long-term supply, while polyclonal antibodies can provide signal amplification by recognizing multiple epitopes and may be more tolerant of minor changes in the antigen [37]. A common strategy is to use a monoclonal antibody for capture and a polyclonal for detection [37].
- Detection Methods: The detection step can be direct or indirect. Direct detection uses a primary antibody conjugated directly to an enzyme, making the protocol quicker but often less sensitive [1]. Indirect detection, the more popular format, uses an unlabeled primary antibody followed by an enzyme-conjugated secondary antibody that recognizes the host species of the primary antibody [1]. This method offers significant signal amplification and greater flexibility [1]. For both methods, it is critical that the secondary antibody is cross-adsorbed to minimize cross-reactivity with other species present in the assay, such as the capture antibody [37] [1].
Substrate Development and Signal Quantification
The final stage involves converting the antibody-antigen interaction into a measurable signal through an enzyme-substrate reaction.
- Enzyme Conjugates and Substrates: The most common enzyme conjugates are Horseradish Peroxidase (HRP) and Alkaline Phosphatase (AP) [37] [1]. The choice of substrate depends on the enzyme and the desired detection method (colorimetric, fluorometric, or chemiluminescent) [37]. A summary of common colorimetric substrates is provided in Table 1.
- Detection and Quantification: After adding the substrate, the enzymatic reaction produces a measurable product. The reaction is stopped at a specific time (e.g., with sulfuric acid for TMB), and the signal is measured using a microplate reader [37] [39]. The intensity of the signal is proportional to the amount of target analyte in the sample. The concentration of unknown samples is determined by interpolating their signal values against a standard curve generated from known concentrations of the target analyte run on the same plate [7].
Table 1: Common Colorimetric ELISA Substrates and Stop Solutions
| Enzyme | Colorimetric Substrate | Stop Solution | Final Color / Read Wavelength |
|---|---|---|---|
| Horseradish peroxidase (HRP) | 3,3′,5,5′-Tetramethylbenzidine (TMB) | 0.16M sulfuric acid | Yellow / 450 nm [37] |
| Horseradish peroxidase (HRP) | o-Phenylenediamine dihydrochloride (OPD) | 3M hydrochloric acid or 3M sulfuric acid | Orange / 492 nm [37] |
| Alkaline phosphatase (AP) | p-Nitrophenyl Phosphate (pNPP) | 1M sodium hydroxide | Yellow / 410 nm [37] |
Table 2: Comparison of ELISA Detection Modalities
| Detection Method | Typical Enzyme Conjugate | Key Advantages | Key Disadvantages |
|---|---|---|---|
| Colorimetric | HRP, AP | Inexpensive, widely available, standard spectrophotometer [37] | Limited dynamic range, single-plex only, potential for operator bias [37] |
| Fluorometric | Various fluorophores (e.g., R-PE, Alexa Fluor) | Greater dynamic range, enables multiplexing [37] | Requires specialized reader, some conjugated antibodies are expensive, signal can be photobleached [37] |
| Chemiluminescent | HRP | Exceptional sensitivity, very broad dynamic range [37] | Requires specialized reagents and reader, signal can be transient [37] ``` |
Data Analysis, Troubleshooting, and the Scientist's Toolkit
Data Analysis and Quantification
Quantifying ELISA data requires careful construction and analysis of a standard curve. All samples, standards, and controls should be run in duplicate or triplicate to ensure statistical validity, with a coefficient of variation (CV) between replicates of ≤ 20% [7].
- Standard Curve: A standard curve is created by plotting the mean absorbance (y-axis) against the known concentration of the standard (x-axis) [7]. The data is typically reduced using software that can apply various curve fits (e.g., linear, semi-log, log/log, 4- or 5-parameter logistic). The best-fitting model is identified by a high correlation value and a successful back-fit, where interpolated standard values are within +/- 10% of their expected values [7].
- Calculating Concentration: The concentration of an unknown sample is determined by locating its average absorbance on the y-axis, drawing a horizontal line to the standard curve, and then a vertical line down to the x-axis to read the corresponding concentration [7]. If the sample was diluted, this calculated concentration must be multiplied by the dilution factor.
Troubleshooting Common ELISA Issues
Even well-established protocols can encounter problems. Key troubleshooting advice for common issues is summarized below.
- High Background: This is most frequently caused by insufficient blocking or inadequate washing [39] [40]. The solution is to increase the concentration of the blocking agent, extend the blocking time, or increase the number and duration of washes, including a 30-second soak step [40].
- Low or No Signal: Potential causes include improper reagent preparation, loss of reagent activity, insufficient antibody concentration, or using a tissue culture plate instead of a high-binding ELISA plate [40]. Ensure all reagents are fresh, properly diluted, and that the protocol is followed exactly.
- Poor Reproducibility (Well-to-Well or Assay-to-Assay): This can result from uneven coating, inconsistent pipetting, variations in incubation times or temperatures, or contaminated buffers [39] [40]. Standardize all procedures, use calibrated pipettes, ensure consistent incubation conditions, and prepare fresh buffers.
The Scientist's Toolkit: Essential Reagents and Materials
Table 3: Key Research Reagent Solutions for a Direct Sandwich ELISA
| Item | Function and Key Characteristics |
|---|---|
| Microplate | A 96-well polystyrene plate with high protein-binding capacity. Clear for colorimetry, black/white for fluorescence/chemiluminescence [37] [1]. |
| Capture Antibody | The specific antibody that immobilizes the target antigen. Can be monoclonal, polyclonal, or recombinant [39]. |
| Coating Buffer | A protein-free buffer (e.g., 0.2M carbonate/bicarbonate, pH 9.6) to dilute the capture antibody for passive adsorption to the plate [37] [39]. |
| Blocking Buffer | A solution of irrelevant protein (e.g., 1% BSA, 5% normal serum) to saturate unused binding sites and minimize non-specific background [37] [39]. |
| Detection Antibody | A specific antibody that binds a different epitope on the captured antigen. It is conjugated to an enzyme (e.g., HRP) for direct detection [39]. |
| Wash Buffer | PBS or TBS with a detergent (e.g., 0.05% Tween-20) to remove unbound reagents between steps, critical for reducing background [39] [40]. |
| Enzyme Substrate | A chromogenic, fluorogenic, or chemiluminescent compound that the reporter enzyme converts into a measurable signal (e.g., TMB for HRP) [37] [39]. |
| Stop Solution | A strong acid or base (e.g., 0.16M sulfuric acid for TMB) that halts the enzyme-substrate reaction at a defined time point [37] [39]. |
Within the broader framework of immunochemical methods, which includes established techniques like ELISA, flow cytometry stands out for its ability to provide multiparameter analysis at the single-cell level. The reliability of any flow cytometry experiment, whether for basic research or drug development, is fundamentally contingent upon the initial quality of the sample. Superior cell preparation is not merely a preliminary step but a crucial determinant that directly impacts data integrity, population resolution, and the accuracy of subsequent conclusions [41]. A high-quality sample is characterized by a homogenous single-cell suspension, free from clumps and excessive dead cell debris, with cells maintained at a density of 10^6-10^7 cells per milliliter in a suitable staining buffer [42]. The exclusion of dead cells is particularly vital, as they can compromise data by non-specifically binding antibodies, leading to misinterpretation of results [43]. This guide provides detailed protocols for generating optimal single-cell suspensions from diverse sources and outlines best practices for viability staining to ensure the highest quality data from your flow cytometry experiments.
The initial steps for creating a single-cell suspension vary significantly depending on the biological source material. The following protocols are designed to minimize cell death and aggregation while maximizing cell yield and viability.
Cell Culture (Adherent and Suspension)
- Suspension Cultures: Cells decanted from culture vessels are centrifuged at 300-400 x g for 5-10 minutes. The pellet is washed with phosphate-buffered saline (PBS) and finally resuspended in cold staining buffer [42].
- Adherent Cultures: Culture medium is discarded, and the cell monolayer is rinsed with sterile PBS. Warmmed 0.25% trypsin is added to cover the monolayer and incubated at 37°C for 5-10 minutes to dissociate cells. The reaction is neutralized with culture medium containing serum, and the detached cells are processed as suspension cultures [42].
Primary Tissues (e.g., Lung, Bone Marrow, Solid Tumors)
Processing primary tissues requires mechanical disruption and often enzymatic digestion to liberate individual cells.
- Murine Bone Marrow: Tibia and femurs are dissected, and muscles and connective tissue are removed. An 18-gauge needle is used to flush the bone contents with cold culture medium. The cell masses are broken up, pelleted, and resuspended in Red Blood Cell (RBC) Lysis Buffer (e.g., at 10^6 cells/mL) for 5 minutes at room temperature. Cells are then washed and resuspended in staining buffer [42].
- Human Lung Tissue: This protocol is adaptable to various solid tissues. The lung sample is transferred to a tube containing digestion buffer (RPMI 1640 with 10% FBS, 0.2 mg/mL Collagenase IV, and 0.05 mg/mL DNAse I) and minced with sterile scissors into 1-2 mm pieces. The mixture is incubated for 1 hour at 37°C. The digested tissue is pipetted up and down to achieve a single-cell suspension, filtered through a 70 µm strainer, and subjected to density gradient centrifugation (e.g., with Ficoll-Paque) to isolate mononuclear cells [44].
Biological Fluids (Whole Blood and Buffy Coats)
- Peripheral Blood Mononuclear Cells (PBMCs): Whole blood or buffy coat is diluted with an equal volume of PBS and carefully layered over an equal volume of gradient medium (e.g., Ficoll or Histopaque). This is centrifuged at 400-500 x g for 30-40 minutes with the brakes turned off. The PBMC layer at the plasma-gradient interface is aspirated, washed with PBS, and resuspended in staining buffer [42].
Cryopreserved Cells
Frozen cells are rapidly thawed in a 37°C water bath and transferred to a chilled tube. Ice-cold culture medium with 10% FBS is added dropwise to dilute the cells 10-fold. Cells are centrifuged at 300-400 x g for 5 minutes at 4°C, washed with cold staining buffer, and finally resuspended for analysis [42].
Table 1: Key Parameters for Cell Preparation from Different Sources
| Cell Source | Key Reagents | Critical Step | Centrifugation Force & Time |
|---|---|---|---|
| Suspension Culture | PBS, Staining Buffer | Washing to remove culture media | 300-400 x g, 5-10 min [42] |
| Adherent Culture | PBS, Trypsin, Staining Buffer | Trypsinization and neutralization | 300-400 x g, 5-10 min [42] |
| Bone Marrow | PBS, RBC Lysis Buffer | Flushing bones & RBC lysis | 300-400 x g, 5 min [42] |
| Solid Tissue (Lung) | Collagenase IV, DNAse I, Ficoll | Enzymatic digestion & density gradient | 1800 x g, 25 min (gradient) [44] |
| Whole Blood/Buffy Coat | Ficoll/Histopaque, PBS | Density gradient separation | 400-500 x g, 30-40 min [42] |
| Cryopreserved Cells | Culture Medium with 10% FBS | Drop-wise dilution post-thaw | 300-400 x g, 5 min at 4°C [42] |
Viability Staining for Dead Cell Exclusion
Incorporating a viability dye is strongly recommended for any flow cytometry experiment to distinguish and exclude dead cells, thereby reducing autofluorescence and non-specific antibody binding [43] [41]. The choice of dye depends on the experimental design, particularly whether intracellular staining is required.
DNA-Binding Dyes (e.g., Propidium Iodide, 7-AAD)
These dyes are membrane-impermeant and enter only cells with compromised membranes, staining dead cells. They are suitable for live-cell surface staining protocols but not compatible with intracellular staining, as fixation permeabilizes all cells, allowing dye entry into both live and dead populations [43].
- Protocol: After staining cells for surface antigens, wash cells 1-2 times with Flow Cytometry Staining Buffer. Resuspend cells in buffer and add 5 µL of Propidium Iodide (PI) or 7-AAD Staining Solution per 100 µL of cells. Incubate for 5–15 minutes on ice or at room temperature. Do not wash cells after staining, as the dye must remain in the buffer during acquisition. Analyze samples by flow cytometry within 4 hours [43].
Fixable Viability Dyes (FVDs)
FVDs are amine-reactive dyes that brightly stain cells with compromised membranes. They covalently cross-link to cellular proteins upon fixation, irreversibly labeling dead cells. This allows samples to undergo cryopreservation, fixation, and permeabilization procedures without loss of staining intensity, making them ideal for intracellular staining protocols [43].
- Standard Staining Protocol: Wash cells 2 times in azide-free and protein-free PBS for consistent staining. Resuspend cells at 1–10 x 10^6 /mL in the same buffer. Add 1 µL of FVD per 1 mL of cells and vortex immediately. Incubate for 30 minutes at 2–8°C, protected from light. Wash cells 1–2 times with Flow Cytometry Staining Buffer before proceeding with surface or intracellular staining [43].
Table 2: Comparison of Common Viability Dyes for Flow Cytometry
| Viability Dye | Compatible with Intracellular Staining? | Staining Location | Key Advantage | Key Consideration |
|---|---|---|---|---|
| Propidium Iodide (PI) | No [43] | Intercalates into dsDNA/dsRNA [43] | Cost-effective, simple protocol | Must be present in buffer during acquisition; short time window for analysis [43] |
| 7-AAD | No [43] | Intercalates into dsDNA [43] | Good for DNA content analysis in live/dead discrimination | Must be present in buffer during acquisition [43] |
| Fixable Viability Dyes (FVDs) | Yes [43] | Covalently binds to cellular amines [43] | Compatible with fixation/permeabilization; multiple laser colors available | Requires precise titration; sensitive to light and moisture [43] |
| Calcein AM | No [43] | Live-cell cytoplasm (enzymatically converted) [43] | Positively stains live cells | Not retained in dead cells; not compatible with intracellular staining [43] |
The Scientist's Toolkit: Essential Reagents and Materials
Successful sample preparation relies on a core set of reagents and equipment. The following table details essential items and their functions.
Table 3: Research Reagent Solutions for Flow Cytometry Sample Prep
| Reagent / Equipment | Function / Purpose | Key Notes |
|---|---|---|
| Flow Cytometry Staining Buffer | Resuspension and washing medium | Typically PBS with 0.1-1% BSA or dialyzed FBS to reduce cell adhesion and autofluorescence [43] [41] |
| PBS (without Ca++/Mg++) | Base washing buffer | Prevents cell aggregation [41] |
| EDTA (2-5mM) | Chelating agent | Added to staining buffer to further prevent cell adhesion [41] |
| DNAse I | Enzyme | Digests free DNA released by dead cells to reduce clumping [41] [44] |
| Collagenase IV | Enzymatic Dissociation | Breaks down collagen in solid tissues to liberate cells [44] |
| Ficoll-Paque | Density Gradient Medium | Isolates mononuclear cells from whole blood or tissue digests [42] [44] |
| RBC Lysis Buffer | Lyses red blood cells | Removes contaminating RBCs from samples like bone marrow or spleen [42] |
| Cell Strainer (70µm or 30µm) | Filtration | Removes cell clumps and debris to generate a true single-cell suspension; 30µm is recommended immediately before sorting [41] [44] |
| Dead Cell Exclusion Dye | Viability Marker | Critical for identifying and excluding dead cells to improve data quality [43] [41] |
| HEPES (10-25mM) | Buffer | Added to maintain pH stability during long sorts or when buffer capacity is compromised [41] |
Workflow and Data Quality Visualization
The entire process, from raw sample to analyzable single-cell suspension, involves a series of critical steps that can be visualized in the following workflow. Special attention to contrast and background is crucial for creating clear and accessible scientific diagrams, ensuring that all elements are distinguishable by a wide audience [45].
Meticulous preparation of a single-cell suspension and rigorous exclusion of dead cells are non-negotiable prerequisites for generating high-quality, reproducible flow cytometry data. The protocols outlined herein—covering everything from dissociating complex solid tissues to selecting the appropriate viability stain—provide a robust foundation for researchers. By adhering to these standardized methods and integrating the recommended quality control measures, scientists can ensure that their data accurately reflects biological reality, thereby strengthening conclusions in immunology, translational pharmacology, and drug development research.
Immunochemical staining methods are foundational techniques in biomedical research and drug development, enabling the specific detection and localization of target molecules within and on the surface of cells. These methods leverage the specific binding of antibodies to antigens, allowing researchers to visualize and quantify proteins, nucleic acids, and other biomolecules critical to understanding cellular function in health and disease. The strategic choice between targeting extracellular surface markers and intracellular targets is dictated by the research question, as each approach provides distinct biological insights and presents unique technical challenges. Extracellular staining provides critical information about a cell's identity, functional state, and surface-mediated communication, which is vital for immunophenotyping in flow cytometry and for understanding intercellular signaling. In contrast, intracellular staining reveals the inner workings of the cell, including cytokine production, transcription factor expression, and signaling pathway activation, offering a snapshot of the cell's functional and metabolic state.
The complexity of these techniques is underscored by their application in advanced research domains. For instance, in the study of extracellular vesicles (EVs)—nanosized, membrane-bound particles released by cells—surface marker profiling via immunoaffinity capture is essential for isolating tissue-specific EV populations from complex biofluids like blood [46]. Similarly, intracellular cytokine staining (ICS) is a cornerstone method for evaluating antigen-specific T-cell responses in immunology and vaccine research [47]. This guide provides a detailed technical comparison of these two fundamental staining strategies, framing them within the context of ELISA and flow cytometry, and provides standardized protocols to ensure robust, reproducible results.
Comparative Analysis: Extracellular vs. Intracellular Staining
The decision to target extracellular surface markers or intracellular antigens dictates nearly every aspect of experimental design, from sample preparation and antibody selection to choice of detection platform. The table below summarizes the core technical differences and considerations.
Table 1: Key Technical Characteristics of Extracellular and Intracellular Staining
| Parameter | Extracellular Staining | Intracellular Staining |
|---|---|---|
| Primary Application | Cell identification, phenotyping, and sorting [48]; Isolation of specific cell-derived vesicles [46] [49] | Quantification of functional proteins (e.g., cytokines), transcription factors, and phospho-proteins [47] |
| Sample Preparation | Can be performed on live, non-fixed cells. | Requires cell fixation and permeabilization to allow antibody access. |
| Technical Complexity | Relatively simple and fast protocol. | More complex, multi-step protocol with additional washing and incubation steps. |
| Key Challenges | Marker abundance and accessibility; non-specific binding. | Maintaining cell viability and antigen integrity after permeabilization; higher background noise. |
| Compatible Detection | Flow cytometry, imaging flow cytometry, immunofluorescence, ELISA. | Flow cytometry (ICS), imaging flow cytometry, immunofluorescence, ELISA (on lysates). |
| Quantitative Potential | High; suitable for absolute quantification of receptor density (e.g., Antibody Binding Capacity - ABC) [50]. | Can be semi-quantitative; relative quantification is standard. |
Beyond the technical workflow, the biological context and required readout are paramount in selecting the appropriate strategy. Extracellular staining is indispensable for live-cell applications, such as tracking cellular interactions or isolating specific cell populations for functional assays. Recent advances in ultra-high-scale cytometry, for example, rely on extracellular staining to physically map millions of transient cellular interactions within the immune system [48]. Intracellular staining, however, is the method of choice for dissecting functional immune responses, such as comparing T-cell immunity via ICS in paucisymptomatic versus severe COVID-19 patients [47]. For a comprehensive analysis, many experimental designs strategically combine both approaches in multi-parameter panels.
Staining Techniques and Experimental Protocols
Direct vs. Indirect Staining
A fundamental choice in assay design is between direct and indirect staining methods. In direct staining, the primary antibody is conjugated directly to a fluorophore or enzyme. This approach is faster, minimizes non-specific background, and is ideal for multi-color panels where multiple antigens are detected simultaneously. In indirect staining, an unlabeled primary antibody binds the target, and is subsequently detected by a labeled secondary antibody that recognizes the primary antibody's Fc region. This method offers signal amplification, which is beneficial for targets of low abundance, and provides greater flexibility as the same labeled secondary antibody can be used with various primary antibodies from the same host species.
Protocol for Extracellular Surface Marker Staining for Flow Cytometry
This protocol is designed for the immunophenotyping of human peripheral blood mononuclear cells (PBMCs) or cultured cell lines.
Key Research Reagent Solutions:
- Staining Buffer: Phosphate-buffered saline (PBS) supplemented with 2-5% fetal bovine serum (FBS) or bovine serum albumin (BSA) to block non-specific binding.
- Viability Dye: A fluorescent dye (e.g., based on amine reactivity) to exclude dead cells from the analysis.
- Fc Receptor Blocking Solution: Human or species-specific IgG or commercial blocking solution to prevent antibody binding via Fc receptors.
- Fluorophore-conjugated Antibodies: Antibodies specific to the surface markers of interest (e.g., CD3, CD4, CD8, CD19).
- Fixation Solution: Typically 1-4% paraformaldehyde (PFA) in PBS.
Methodology:
- Cell Preparation: Harvest and wash cells in staining buffer. Count and adjust cell concentration to 5-10 x 10^6 cells/mL.
- Viability Staining: Resuspend cell pellet in viability dye solution and incubate for 10-20 minutes at 4°C in the dark. Wash cells with excess staining buffer.
- Fc Block: Resuspend cell pellet in Fc receptor blocking solution and incubate for 10-15 minutes at 4°C.
- Surface Antigen Staining: Add a pre-titrated antibody cocktail directly to the cell pellet. Vortex gently and incubate for 20-30 minutes at 4°C in the dark.
- Washing: Add 2 mL of staining buffer, centrifuge, and carefully decant the supernatant. Repeat this wash step twice.
- Fixation: Resuspend cells in 1% PFA solution for 15-20 minutes at 4°C in the dark to stabilize the stained cells.
- Data Acquisition: Wash cells once more and resuspend in staining buffer for immediate acquisition on a flow cytometer. Fixed samples can be stored at 4°C in the dark for up to 24-48 hours.
Protocol for Intracellular Cytokine Staining (ICS)
This protocol details the steps for detecting cytokines (e.g., IFN-γ) in T cells following stimulation, as used in studies of viral immunity [47].
Key Research Reagent Solutions:
- Cell Stimulation Cocktail: A mixture of phorbol ester (PMA) and ionomycin, or specific peptide pools (e.g., SARS-CoV-2 spike protein peptides) to activate T cells [47].
- Protein Transport Inhibitor: Brefeldin A or monensin, added to culture to inhibit Golgi-mediated protein transport, thereby causing cytokines to accumulate intracellularly.
- Fixation/Permeabilization Kit: A commercial kit containing a formaldehyde-based fixative and a saponin-based permeabilization buffer.
- Permeabilization Wash Buffer: A buffer containing a permeabilizing agent (e.g., saponin) to maintain cell permeability during antibody staining and washing.
- Fluorophore-conjugated Antibodies: Antibodies specific to surface markers (CD3, CD4, CD8) and intracellular cytokines (IFN-γ, IL-2, TNF-α).
Methodology:
- Cell Stimulation: Resuspend PBMCs in complete culture medium. Add the stimulation cocktail and protein transport inhibitor (e.g., Brefeldin A at 10 µg/mL). Incubate for 4-18 hours at 37°C in a 5% CO2 incubator [47].
- Extracellular Staining: Harvest cells and stain for surface markers (e.g., CD3, CD4, CD8) following the protocol in Section 3.2, steps 1-5, but omit the final fixation step.
- Fixation and Permeabilization: After the final wash from surface staining, thoroughly resuspend the cell pellet in the provided fixation/permeabilization solution. Incubate for 20-30 minutes at 4°C in the dark.
- Intracellular Staining: Wash cells twice with permeabilization wash buffer. Resuspend the cell pellet in an antibody cocktail against the intracellular target(s) diluted in permeabilization wash buffer. Incubate for 30 minutes at 4°C in the dark.
- Final Wash and Acquisition: Wash cells twice with permeabilization wash buffer and once with standard staining buffer. Resuspend in fixation buffer (e.g., 1% PFA) for flow cytometer acquisition.
Diagram 1: ICS Experimental Workflow
Detection Platforms: Flow Cytometry and ELISA
The choice of detection platform is determined by the required readout, whether it is single-cell, multi-parameter data or a bulk, quantitative measurement.
Flow Cytometry
Flow cytometry is the premier platform for analyzing both extracellular and intracellular targets at a single-cell level across vast numbers of cells. It enables complex immunophenotyping and functional analysis by simultaneously measuring light scattering and multiple fluorescence parameters. Quantitative flow cytometry can be taken a step further to determine the absolute number of antigens per cell, known as the Antibody Binding Capacity (ABC), which is crucial for accurately evaluating target expression in drug development [50]. Achieving robust and reproducible quantitative data requires careful standardization, including the use of appropriate reference materials and controls to account for instrument and reagent variability [50].
Enzyme-Linked Immunosorbent Assay (ELISA)
ELISA is a workhorse technique for quantifying the concentration of a soluble analyte, such as a secreted cytokine or a specific antibody, within a sample. While traditionally used with supernatants or serum, ELISA principles can also be adapted to detect specific proteins captured from EV lysates, providing information about their molecular cargo [46]. A related and highly sensitive technique for enumerating rare, antigen-responsive cells is the Enzyme-Linked Immunospot (ELISpot) assay. A comparative study of SARS-CoV-2 T-cell responses found that the IFN-γ ELISpot assay often exhibited better sensitivity for detecting low-frequency responses in paucisymptomatic patients compared to ICS, highlighting the importance of assay selection based on the biological context [47].
Table 2: Comparison of Key Detection Platforms for Immunochemical Staining
| Platform | Principle | Readout | Key Advantages | Ideal for Staining Type |
|---|---|---|---|---|
| Flow Cytometry | Cells in suspension pass a laser; scattered and emitted light is detected. | Single-cell, multi-parametric data. | High-throughput, single-cell resolution, can analyze complex populations. | Both Extracellular and Intracellular. |
| ELISA | Antigen is captured on a plate and detected with an enzyme-linked antibody. | Bulk, concentration of analyte. | Highly quantitative, high-throughput, relatively simple. | Extracellular (secreted factors/vesicle content) [46]. |
| ELISpot | Captures and visualizes analyte secreted by individual cells on a membrane. | Frequency of analyte-secreting cells. | Extremely sensitive for detecting rare, functional cells [47]. | Functional output of intracellular processes. |
Applications in Research and Drug Development
Immunochemical staining strategies are deeply embedded in both basic research and the entire drug development pipeline, from target discovery and validation to clinical trials.
In basic research, extracellular staining is fundamental for dissecting cellular heterogeneity. For example, advanced cytometry-based frameworks now use surface marker staining to map ultra-high-scale cellular interaction landscapes, revealing how immune cells physically engage during an immune response [48]. Similarly, the isolation of tissue-specific extracellular vesicles from blood for liquid biopsy applications relies heavily on immunoaffinity capture strategies targeting specific surface markers [46] [49]. This allows for minimally invasive monitoring of organ function and disease.
In translational research and drug development, intracellular staining is critical for assessing the pharmacodynamics and mechanism of action of therapeutic candidates. ICS is routinely used to measure T-cell activation and cytokine production in response to vaccine candidates or immunotherapies [47]. Furthermore, quantitative flow cytometry for measuring changes in surface receptor density (ABC) before and after treatment with a targeted therapeutic (e.g., anti-CD19 or anti-CD20 antibodies) provides vital data on target engagement and potential resistance mechanisms [50]. The diagram below illustrates how these staining strategies integrate into the broader drug development workflow.
Diagram 2: Staining in Drug Development
Fixation and Permeabilization Techniques for Intracellular Cytokine Staining
Intracellular cytokine staining (ICS) is a powerful flow cytometry technique that enables the detection of cytokine production at the single-cell level. Unlike bulk measurement techniques such as ELISA, ICS allows researchers to simultaneously identify cytokine-producing cells, characterize their immunophenotype, and assess multiple cytokines within individual cells [17] [51]. This capability is particularly valuable in vaccine development, HIV research, autoimmune disease studies, and cancer immunotherapy, where understanding the functional capacity of specific T-cell subsets is crucial [52] [51]. The technique's unique strength lies in its ability to provide both quantitative and polyfunctional data on antigen-specific T-cell responses while maintaining cellular resolution that ELISA cannot achieve [52] [14].
The fundamental principle of ICS involves briefly stimulating cells, inhibiting cytokine secretion with protein transport inhibitors, then fixing and permeabilizing the cells to allow fluorescently-labeled antibodies to access and bind intracellular cytokines [53] [51] [54]. Despite its powerful capabilities, ICS presents technical challenges due to its multi-step process, requiring careful optimization of each stage to generate reproducible, high-quality data [53]. The fixation and permeabilization steps are particularly critical, as they must achieve a delicate balance between preserving cellular structure and epitope integrity while allowing sufficient antibody penetration to detect intracellular targets [55].
Core Principles of Fixation and Permeabilization
The Science of Cell Fixation
Fixation stabilizes cellular structures by crosslinking proteins, thereby preserving the cell's morphological integrity and preventing the loss of intracellular contents during subsequent processing steps. Formaldehyde-based fixatives, typically paraformaldehyde (PFA) at concentrations between 1-4%, are most commonly used for ICS [55] [54]. These fixatives create covalent bonds between proteins, forming a rigid scaffold that maintains the spatial relationship of intracellular components while trapping cytokines within the cell. The degree of crosslinking varies with formaldehyde concentration, with higher concentrations (4% PFA) providing superior structural preservation but potentially masking epitopes and reducing antibody binding for some targets [55]. Lower concentrations (1-2% PFA) may preserve more epitopes but provide less structural stabilization, creating a fundamental trade-off that researchers must optimize for their specific applications [55].
Mechanisms of Membrane Permeabilization
Permeabilization creates pores in cellular membranes, allowing antibodies to access intracellular compartments. The choice of permeabilization agent depends on the target's subcellular localization and the required pore size. Detergent-based permeabilization with saponin is commonly used for cytoplasmic targets like cytokines [53] [54]. Saponin creates reversible pores by complexing with membrane cholesterol, allowing antibody access while maintaining sufficient cellular integrity for analysis. For nuclear targets such as transcription factors, stronger permeabilization agents like Triton X-100 or commercial transcription factor buffer sets are often necessary to facilitate nuclear membrane penetration [54]. The recently described "Dish Soap Protocol" utilizing commercial dishwashing detergent (Fairy) represents an innovative approach that effectively balances nuclear access with cytoplasmic preservation at significantly reduced cost [55].
Critical Balance in Technique Optimization
The fundamental challenge in ICS lies in balancing sufficient permeabilization to allow antibody access with adequate fixation to preserve cellular contents and structure. Excessive crosslinking from strong fixation can block antibody binding, particularly for nuclear antigens, while insufficient fixation may result in cytokine leakage and loss of signal [55]. Similarly, overly aggressive permeabilization can damage cellular structures and increase non-specific background staining, while weak permeabilization may not allow adequate antibody penetration [53]. This optimization must also consider the preservation of endogenous fluorescent proteins in transgenic models, as some fixation conditions can destroy or diminish their fluorescence [55].
Comparative Analysis of Fixation and Permeabilization Methods
Table 1: Comparison of Fixation and Permeabilization Methods for Intracellular Cytokine Staining
| Method Type | Common Reagents | Optimal Targets | Advantages | Limitations |
|---|---|---|---|---|
| Two-Step Fixation/Permeabilization | 4% PFA followed by saponin-based buffer [54] | Cytoplasmic cytokines (IFN-γ, IL-2, TNF-α) [54] | Excellent for cytoplasmic proteins; reversible permeabilization | May not adequately access nuclear targets; requires continuous permeabilization buffer |
| One-Step Nuclear Staining | Commercial Foxp3/Transcription Factor Buffer Sets [54] | Nuclear proteins, transcription factors (Foxp3, T-bet) [55] [54] | Effective for challenging nuclear targets; combined fixation/permeabilization | May destroy some cytoplasmic epitopes; can diminish fluorescent protein signals |
| Methanol-Based Methods | Formaldehyde fixation followed by methanol permeabilization [54] | Phosphorylated signaling proteins (STAT, MAPK) [54] | Effective for phospho-epitopes; good for intracellular staining | Can alter light scatter properties; may destroy some epitopes |
| Dish Soap Protocol | 2% formaldehyde with 0.05% Fairy detergent [55] | Simultaneous detection of cytokines, transcription factors, and fluorescent proteins [55] | Cost-effective; enables multi-target detection; compatible with various applications | Not optimal for phospho-flow; requires optimization of detergent concentrations |
Table 2: Impact of Fixation and Permeabilization on Different Target Types
| Target Category | Recommended Fixation | Recommended Permeabilization | Special Considerations |
|---|---|---|---|
| Secreted Cytokines (IFN-γ, IL-2, IL-4) | 1-4% PFA for 20-60 minutes [54] | Saponin-based buffers (0.5%) [51] [54] | Requires protein transport inhibition during stimulation [53] [54] |
| Transcription Factors (Foxp3, T-bet, Helios) | 2% formaldehyde or commercial fixatives [55] | Strong detergents (Triton X-100) or commercial nuclear buffers [55] [54] | Excessive crosslinking blocks access; may require specialized buffers [55] |
| Endogenous Fluorescent Proteins (GFP, RFP) | Mild formaldehyde (1-2%) [55] | Moderate detergents (low saponin or dish soap) [55] | Strong fixation ablates fluorescence; requires balance between preservation and access [55] |
| Phospho-Signaling Proteins (pSTAT, pMAPK) | Formaldehyde followed by methanol [54] | Methanol or specialized phospho-flow buffers [54] | Requires rapid fixation to preserve phosphorylation state; not compatible with saponin |
Detailed Experimental Protocols
Standard Two-Step Protocol for Cytoplasmic Cytokines
This protocol is optimized for detecting secreted cytokines such as IFN-γ, TNF-α, and IL-2 in stimulated T cells [54]:
Cell Stimulation and Transport Inhibition: Resuspend cells in appropriate medium and stimulate with peptide pools (e.g., CMV pp65, HIV Gag), PMA/ionomycin, or anti-CD3/CD28 antibodies for 4-6 hours at 37°C. Add protein transport inhibitors (brefeldin A at 10μg/ml or monensin) for the final 4-6 hours of stimulation to block cytokine secretion [52] [53] [54].
Cell Surface Staining: Harvest cells and stain with fluorochrome-conjugated antibodies against surface markers (CD3, CD4, CD8) in FACS buffer for 30 minutes at 4°C. Include a viability dye to exclude dead cells that can cause non-specific binding [52] [53].
Fixation: After surface staining, centrifuge cells at 400-600 × g for 5 minutes and discard supernatant. Resuspend cell pellet in 100-200μL of IC Fixation Buffer (commercial formulation or 2-4% PFA) and incubate for 20-60 minutes at room temperature protected from light [54].
Permeabilization: Add 2mL of 1X permeabilization buffer (saponin-based) and centrifuge at 400-600 × g for 5 minutes. Discard supernatant and resuspend cells in 100μL of permeabilization buffer [54].
Intracellular Staining: Add fluorochrome-conjugated antibodies against intracellular cytokines (IFN-γ, IL-2, TNF-α, IL-4) and incubate for 20-60 minutes at room temperature protected from light [54].
Washing and Acquisition: Wash cells twice with 2mL permeabilization buffer, then resuspend in FACS buffer for acquisition on a flow cytometer. Include appropriate controls (unstimulated, FMO, single stains) for proper gating and compensation [53].
Dish Soap Protocol for Multi-Target Detection
The "Dish Soap Protocol" utilizes Burton's Better Buffer to enable simultaneous detection of transcription factors, cytokines, and endogenous fluorescent proteins, addressing a key limitation in conventional ICS methods [55]:
Diagram 1: Dish Soap Protocol Workflow
Surface Staining: Perform surface marker staining as usual, then centrifuge cells for 5 minutes at 400-600 × g and discard supernatant [55].
Fixation: Resuspend cell pellet in 200μL fixative (2% formaldehyde with 0.05% Fairy and 0.5% Tween-20) and incubate 30 minutes at room temperature in a fume hood. Centrifuge 5 minutes at 600 × g and remove supernatant [55].
Permeabilization: Resuspend cells in 100μL perm buffer (PBS with 0.05% Fairy). Incubate 15-30 minutes at room temperature. Optional Fc receptor blocking can be done at this stage by adding the block to the perm buffer [55].
Intracellular Staining: Wash twice in FACS buffer, then stain overnight in FACS buffer at 4°C. The protocol notes that additional permeabilization is neither necessary nor recommended [55].
Acquisition: Wash twice in FACS buffer and acquire samples on flow cytometer [55].
Critical Reagent Formulations
Burton's Better Buffer Fixative [55]:
- 5mL of 4% formaldehyde
- 4mL PBS
- 1mL of 5% Tween-20
- 100μL of 5% Fairy dishwashing detergent
- Optional: 200μL of 5% Triton X-100 (0.1% final)
FACS Buffer [55]:
- 1L of 1× phosphate-buffered saline (PBS)
- 25mL fetal bovine serum (FBS) or 5g BSA (0.5% final)
- 4mL of 0.5M UltraPure EDTA, pH 8.0
- Optional: 10mL of 10% sodium azide for long-term storage
Essential Controls and Optimization Strategies
Required Experimental Controls
Proper controls are essential for generating reliable ICS data and accurately interpreting results [53]:
- Unstimulated Control: Cells processed identically but without stimulation reagents; establishes baseline cytokine levels and sets the true negative population for gating [53].
- Stimulation Positive Control: Cells stimulated with strong, non-specific activators like SEB or PMA/ionomycin; verifies overall assay functionality and cell responsiveness [52].
- Fluorescence Minus One (FMO) Controls: Contain all fluorochromes except one; critical for establishing accurate gates for dim cytokine signals, especially in complex multi-parameter panels [53].
- Single-Stain Controls: Cells stained with individual fluorochromes; essential for proper compensation between channels and minimizing spectral overlap [53].
- Biological Controls: Samples from donors with known response patterns; help troubleshoot variability across experiments and establish expected response magnitudes [53].
Optimization Approaches
Successful ICS requires systematic optimization of key parameters:
- Antibody Titration: Determine optimal antibody concentrations by testing serial dilutions under experimental conditions; balance sensitivity against background staining [53].
- Temporal Optimization: Establish ideal stimulation duration (typically 4-6 hours for most T-cell cytokines) and determine optimal intracellular staining time (30 minutes to overnight) [53] [51].
- Fixation and Permeabilization Timing: Test fixation duration (20-60 minutes) and permeabilization time (15-90 minutes) to maximize target detection while preserving cell integrity [55] [54].
- Epitope Compatibility: Verify that fixation conditions preserve the specific epitopes recognized by your antibodies; some clones perform poorly after certain fixation methods [55] [54].
Research Reagent Solutions
Table 3: Essential Reagents for Intracellular Cytokine Staining
| Reagent Category | Specific Examples | Function and Application |
|---|---|---|
| Protein Transport Inhibitors | Brefeldin A, Monensin [52] [53] [54] | Disrupt Golgi apparatus function to block cytokine secretion and enable intracellular accumulation |
| Fixation Reagents | Paraformaldehyde (1-4%), Commercial IC Fixation Buffers [55] [54] | Stabilize cellular structures through protein crosslinking and preserve intracellular contents |
| Permeabilization Agents | Saponin, Triton X-100, Tween-20, Commercial dish soap (Fairy/Dawn) [55] [54] | Create pores in cellular membranes to allow antibody access to intracellular compartments |
| Commercial Buffer Systems | Intracellular Fixation & Permeabilization Buffer Set, Foxp3/Transcription Factor Staining Buffer Set [54] | Optimized formulations for specific applications (cytokines vs. nuclear targets) |
| Viability Dyes | Fixable Viability Dyes (eFluor series, LIVE/DEAD) [52] [54] | Identify and exclude dead cells that non-specifically bind antibodies and increase background |
| Stimulation Reagents | PMA/Ionomycin, Peptide pools (CMV pp65, HIV Gag), SEB [52] [54] | Activate cellular signaling pathways to induce cytokine production in responsive cells |
| Blocking Reagents | Fc Receptor Block, Normal Mouse/Rat Serum [55] [54] | Reduce non-specific antibody binding through Fc receptors |
Troubleshooting Common Challenges
Diagram 2: ICS Troubleshooting Guide
Addressing Technical Issues
Excessive Background Staining: Results from non-specific antibody binding, often due to dead cells, over-staining, or inadequate blocking. Solutions include titrating antibodies, including viability dyes, using Fc receptor blocking, optimizing permeabilization concentration, and ensuring proper washing [53] [54].
Weak or Absent Cytokine Signal: Caused by suboptimal stimulation, inadequate transport inhibition, or excessive fixation. Address by verifying stimulation conditions, confirming transport inhibitor activity, reducing fixation time or concentration, and testing antibody performance in ICS [53].
Poor Nuclear Staining with Good Cytoplasmic Staining: Indicates insufficient nuclear membrane permeabilization. Improve by switching to stronger permeabilization agents (Triton X-100), using commercial nuclear staining buffers, or implementing the dish soap protocol with optimized detergent concentrations [55] [54].
Loss of Fluorescent Protein Signal: Caused by excessive crosslinking or harsh permeabilization. Preserve fluorescence by reducing formaldehyde concentration (1-2%), using milder permeabilization conditions, or implementing the dish soap protocol which better preserves fluorescent proteins [55].
Methodological Limitations and Alternatives
While ICS provides valuable single-cell data, researchers should recognize its limitations. The requirement for cell fixation prevents recovery of live cells for further analysis [51]. Additionally, ELISpot may offer greater sensitivity for detecting very low-frequency T-cell responses [51]. The chemical fixation process increases hydrophobicity of cellular proteins, potentially increasing nonspecific binding and requiring careful control experiments [51]. For these reasons, ICS is often used in combination with other techniques such as ELISA or multiplex immunoassays to provide complementary data across different sensitivity ranges and applications [17] [14].
Mastering fixation and permeabilization techniques is fundamental to obtaining reliable, reproducible intracellular cytokine staining data. The choice between standard protocols and innovative approaches like the dish soap protocol depends on the specific research question, target proteins, and required multi-parameter capabilities. As flow cytometry continues to advance with increased parameter capabilities, the optimization of these fundamental techniques becomes increasingly important for extracting maximum biological insight from single-cell analyses. By systematically applying the principles, protocols, and troubleshooting strategies outlined in this guide, researchers can overcome the technical challenges of ICS and generate high-quality data that advances our understanding of immune function in health and disease.
In biomedical research and drug development, the ability to simultaneously measure multiple analytes from a single small-volume sample has become indispensable for comprehensive biological understanding. Traditional enzyme-linked immunosorbent assays (ELISAs), while a gold standard for quantitative protein analysis, are fundamentally limited to measuring a single analyte per test well. This constraint presents significant challenges for studying complex biological networks, such as cytokine signaling in immune responses, where the relationships between multiple proteins are more informative than the presence or absence of individual markers [56].
Multiplex bead-based arrays integrated with 96-well plate formats have emerged as a powerful solution to these limitations, enabling researchers to quantify dozens to hundreds of analytes simultaneously from a single small sample volume [57] [56]. These platforms combine the specificity of immunoassays with the multiplexing capabilities of flow cytometry or other detection systems, dramatically increasing throughput while conserving precious samples. The resulting comprehensive data profiles provide insights into complex biological systems that would be difficult to obtain through traditional single-plex methods [58].
This technical guide examines the core principles, methodologies, and applications of bead-based array technologies, with particular focus on their implementation in high-throughput screening environments. We will explore the technical foundations of these platforms, provide detailed experimental protocols, and discuss their advantages relative to traditional methods within the broader context of immunochemical research methodologies.
Core Technologies and Principles
Bead-Based Array Platforms
Multiplex bead array technology operates on the principle of spatially distinguishing immunoassays on color-coded microparticles. The fundamental architecture involves coupling specific capture antibodies to distinct populations of beads, each identifiable by its unique spectral signature [57] [56]. In a typical assay, these different bead sets are combined and incubated with a sample, allowing target analytes to bind to their respective capture antibodies. After washing, detection antibodies labeled with a reporter molecule complete the sandwich immunoassays, and the beads are analyzed using a flow cytometry-based instrument [57].
The Luminex xMAP (multi-analyte profiling) platform represents one of the most established implementations of this technology, using beads dyed with varying concentrations of fluorophores to create hundreds of uniquely identifiable bead sets [56]. Detection occurs through a flow-based system utilizing lasers to identify each bead based on its spectral code while simultaneously quantifying the bound analyte through the reporter fluorescence signal. This approach typically allows for the simultaneous measurement of up to 80 protein targets, though nucleic acid applications can achieve higher plex levels due to reduced biological interference [56].
Advanced Multiplexing Platforms
Recent technological advances have pushed the boundaries of multiplexing capabilities while addressing fundamental limitations of conventional approaches. The novel nELISA platform exemplifies this innovation, combining DNA-mediated sandwich immunoassays with advanced multicolor bead barcoding to achieve significantly higher plex levels while minimizing reagent-driven cross-reactivity (rCR) [59].
The nELISA platform incorporates several groundbreaking features. Its CLAMP (colocalized-by-linkage assays on microparticles) technology preassembles antibody pairs on target-specific barcoded beads, ensuring spatial separation between noncognate assays [59]. Detection antibodies are tethered via flexible single-stranded DNA, enabling efficient ternary sandwich formation, while detection is achieved through toehold-mediated strand displacement where fluorescently labeled DNA oligos simultaneously untether and label detection antibodies [59]. This approach delivers sub-picogram-per-milliliter sensitivity across seven orders of magnitude and has been demonstrated in a 191-plex inflammation panel analyzing 7,392 peripheral blood mononuclear cell samples to generate approximately 1.4 million protein measurements [59].
Table 1: Comparison of Multiplex Immunoassay Platforms
| Platform | Multiplexing Capacity | Detection Method | Sensitivity | Sample Volume | Key Features |
|---|---|---|---|---|---|
| Traditional ELISA | Single-plex | Colorimetric (TMB) / Chemiluminescent | ~10 μg/L [60] | 100-200 μL [61] | Gold standard, widely available |
| Luminex xMAP | Up to 80 proteins [56] | Bead-based flow cytometry | Similar to ELISA [61] | 25-50 μL [56] | Well-established, validated |
| Flow Cytometry Multiplex Bead Array (FCMBA) | Varies (typically 10-100) | Bead-based flow cytometry | High | Few microliters [57] | Versatile for various analytes |
| nELISA | Up to 191-plex demonstrated [59] | Bead-based with DNA barcoding | Sub-pg/mL [59] | Minimal | rCR-free, extremely high plex |
| Multiplex Microarray ELISA | 3-plex demonstrated [60] | Microarray with colorimetric detection | 0.01 μg/L [60] | Not specified | Highly sensitive, reproducible |
| Flow-Through Membrane Immunoassay (FMIA) | Multiplex capability | Membrane-based with gold nanoparticles | Comparable to ELISA [62] | ~25 μL [62] | Rapid (30 min), dry storage stable |
Technical Workflows and Methodologies
nELISA Workflow and Mechanism
The nELISA platform represents a significant advancement in multiplex immunoassay technology, employing a sophisticated workflow that integrates DNA-based detection with bead-based multiplexing:
Bead Preparation and Antibody Pre-assembly: Target-specific barcoded beads are prepared using the emFRET fluorescent barcoding method, which employs four standard fluorophores (AlexaFluor 488, Cy3, Cy5, Cy5.5) in varying ratios to generate hundreds of unique spectral signatures [59]. Antibody pairs are preassembled on their respective beads with detection antibodies tethered via flexible single-stranded DNA oligos [59].
Sample Incubation and Antigen Capture: The pooled bead mixture is incubated with samples, allowing target proteins to bridge the capture and detection antibodies, forming ternary sandwich complexes while maintaining spatial separation to prevent noncognate interactions [59].
Detection by Strand Displacement: A novel detection-by-displacement mechanism employs toehold-mediated strand displacement, where fluorescently labeled displacer-oligos simultaneously release the detection antibody from the bead surface and label it with >98% efficiency [59].
Signal Measurement and Analysis: Fluorescent signals are measured using flow cytometry, with conditional signal generation occurring only when target-bound sandwich complexes are present. In the absence of target, the fluorescent probe is washed away, ensuring low background signal [59].
Table 2: Key Research Reagent Solutions for Bead-Based Arrays
| Reagent / Material | Function | Example Specifications |
|---|---|---|
| Color-coded Microspheres | Solid phase for assay immobilization; enable multiplexing through spectral barcoding | Luminex beads, nELISA emFRET beads with 4 fluorophores [59] [56] |
| Capture Antibodies | Bind specific target analytes from sample | Coated on beads; preassembled with detection antibodies in nELISA [59] |
| Detection Antibodies | Generate measurable signal for quantitation | Biotinylated or DNA-tethered; recognized by streptavidin-PE or via displacement [59] [56] |
| Streptavidin-Phycoerythrin (S-PE) | Fluorescent reporter molecule | Binds biotinylated detection antibodies; excited by laser for detection [56] |
| DNA Oligo Tethers | Link detection antibodies to beads in nELISA | Enable releasable detection antibodies and strand displacement mechanism [59] |
| Calibration Standards | Quantitation reference | Recombinant proteins for standard curves; essential for accurate quantification |
| Assay Buffer Systems | Maintain optimal binding conditions | Protein stabilizers, blocking agents, detergents to minimize nonspecific binding |
Diagram 1: nELISA vs Conventional Bead Array Workflows
Conventional Bead Array Protocol
Traditional flow cytometry multiplex bead array assays follow a standardized procedure suitable for high-throughput implementation in 96-well plate formats:
Bead Preparation: Distinct bead populations are impregnated with specific fluorescent dyes at varying intensities, allowing discrimination by flow cytometry. Each bead group is coupled with a specific capture molecule (antigen for antibody detection, or antibody for protein detection) [57].
Sample Incubation: The coupled bead groups are pooled and added to serum or other samples in a 96-well plate, typically requiring 25-50 μL of sample per well. Incubation permits antibodies or analytes in the sample to bind to their corresponding capture molecules on the beads [57] [56].
Detection: After washing, a mixture of fluorescently labeled detection antibodies targeting different isotypes (e.g., IgG, IgM, IgA) is added. For protein detection, a biotinylated detection antibody followed by streptavidin-conjugated R-phycoerythrin is commonly used [57] [56].
Analysis: The sample is acquired using a flow cytometry platform with multiple laser and detector configurations to identify bead populations based on their spectral signatures while simultaneously quantifying the bound analyte through the reporter fluorescence [57].
This protocol typically requires 2.5-4 hours to complete up to 80 samples for multiple analytes, significantly faster than performing equivalent single-plex ELISAs [61] [56].
Performance Comparison and Validation
Analytical Performance Metrics
When evaluating bead-based arrays against traditional methods, several key performance parameters must be considered. Studies directly comparing these platforms have yielded important insights:
In a comprehensive comparison of flow cytometry QBeads PlexScreen assays with other immunoassays including MSD, Luminex, ELISA, HTRF, and AlphaLISA, researchers found good correlation between platforms for cytokines including IL-2, IL-4, IL-6, IL-13, IL-17A, IFNγ, KC/GRO, RANTES, and TNFα [58]. However, the absolute cytokine values differed for some analytes when measuring the same sample sets, highlighting the importance of platform-specific validation and establishing appropriate reference ranges [58].
A study comparing multiplex microarray ELISA with classical ELISA for environmental pollutant detection demonstrated that while classical ELISAs provided good sensitivity (limit of detection down to 10 μg/L), the multiplex immunoassay proved more sensitive (limit of detection down to 0.01 μg/L), more reproducible, and more advantageous in terms of cost and time requirements [60].
Table 3: Performance Comparison Between Traditional and Multiplex ELISA
| Performance Characteristic | Traditional ELISA | Multiplex Bead Array | Notes |
|---|---|---|---|
| Throughput | 96 data points in ~4 hours [61] | Up to 1,920 data points in ~3 hours [61] | Multiplex significantly increases data generation rate |
| Cost per Data Point | ~$5 [61] | ~$1.50 [61] | Multiplex reduces cost per analyte |
| Sample Consumption | 100-200 μL per analyte [61] | 25-50 μL for multiple analytes [56] | Critical for volume-limited samples |
| Sensitivity | Similar between platforms [61] | Similar or potentially better [60] | Platform and analyte dependent |
| Dynamic Range | Typically 3-4 logs | Broad dynamic range [56] | Multiplex avoids repeat testing |
| Reproducibility | Generally good | Intra-assay precision <15% CV, inter-assay precision <15% CV [56] | Well-validated multiplex assays show high reproducibility |
| Multiplexing Capacity | Single analyte | Typically up to 80 proteins [56] | Higher for nucleic acid applications |
Advantages and Limitations
Bead-based arrays offer several compelling advantages that explain their growing adoption in research and clinical applications:
The most significant benefit is the ability to measure multiple analytes simultaneously from a single small-volume sample, providing a comprehensive profile that enables researchers to understand relationships between biomarkers rather than just their individual concentrations [56]. This is particularly valuable for studying complex biological networks such as cytokine signaling in immune responses [57].
From a practical perspective, multiplex arrays dramatically increase throughput while reducing hands-on time, reagent consumption, and overall cost per data point [61] [56]. The efficient use of precious samples, especially in pediatric research, small animal studies, or when biobank samples are limited, represents another major advantage [56].
These platforms do have limitations that must be considered. As the number of analytes increases, so does the potential for cross-reactivity between antibodies, potentially limiting practical multiplexing levels [57]. Additionally, multiplex assays typically require more complex instrumentation, particularly flow cytometers or specialized plate readers, and data analysis can be more complicated than for traditional ELISA [57] [56]. Finally, while standardization and validation of multiplex assays have improved significantly, they may not yet match the extensive validation history of established ELISA kits for certain applications [57].
Applications in Research and Drug Development
Immunological Applications
Bead-based arrays have proven particularly valuable in immunology research, where they enable comprehensive profiling of complex immune responses:
In COVID-19 research, flow cytometry multiplex bead array technology was extensively used to assess humoral immune responses following both natural infection and vaccination. One study evaluated serological profiles reacting to 11 antigens from human coronaviruses by measuring total IgG, IgA, and IgM, as well as IgA and IgG subtypes, revealing increasing antibody levels after vaccination and cross-reactivity with SARS-spike protein [57]. The technology has also been employed to identify variations in cytokine expression following vaccination, with distinct cytokine and chemokine patterns defining six unique vaccine-induced immune dynamics [57].
Beyond infectious disease, these platforms have been applied to autoimmune disease screening, allergy testing, and characterizing inflammatory differences between neurological conditions such as antibody-associated demyelinating diseases and multiple sclerosis [57]. The ability to simultaneously measure multiple cytokines, chemokines, and growth factors has also facilitated research into tuberculosis, with distinct cytokine profiles distinguishing active tuberculosis, latent tuberculosis, and healthy patients [57].
High-Throughput Screening and Drug Development
The compatibility of bead-based arrays with 96-well and 384-well plate formats makes them ideally suited for high-throughput screening applications in pharmaceutical development:
Flow cytometry multiplexing has emerged as a powerful high-throughput screening tool for analyzing metabolic activity and assessing pharmaceutical compound toxicity. In one study screening a compound library against Jurkat (T lymphocyte) and Ramos (B lymphocyte) cells, researchers compared flow cytometry with plate reader platforms using different mechanistic readouts (membrane integrity vs. metabolic activity) [63]. This approach revealed that compound "hits" and potency differed depending on cell type, readout mechanism, and oxygen levels, highlighting the value of multiparametric analysis in drug screening [63].
The nELISA platform has been successfully integrated with Cell Painting to perform phenotypic screening of reference compound sets, demonstrating seamless compatibility with existing high-throughput screening workflows while generating rich proteomic data alongside morphological information [59]. This integration enables not only the recapitulation of hundreds of expected immune phenotypes in a single run but also the discovery of novel biological insights with direct implications for drug discovery [59].
Diagram 2: Research and Clinical Applications of Bead-Based Arrays
Bead-based arrays in 96-well plate formats represent a powerful technological advancement that has transformed multiplex protein analysis for research and drug development. By enabling simultaneous measurement of dozens to hundreds of analytes from minimal sample volumes, these platforms provide comprehensive biological insights that would be impractical with traditional single-plex methods. While each platform—from established Luminex technology to innovative approaches like nELISA—offers distinct advantages and limitations, they collectively address the growing need for high-throughput, information-rich profiling in biomedical science.
As these technologies continue to evolve, we can anticipate further improvements in multiplexing capacity, sensitivity, and standardization, solidifying their role as essential tools in the immunochemical methods toolkit. Their demonstrated utility across diverse applications—from basic research to clinical diagnostics and pharmaceutical development—underscores their fundamental importance in advancing our understanding of complex biological systems and accelerating the development of novel therapeutics.
Fluorescence-Activated Cell Sorting (FACS) is a specialized form of flow cytometry that provides a high-throughput method for isolating specific cell populations from a complex mixture based on their fluorescent or light-scattering properties. This technology is fundamental to immunochemical methods research and drug development, enabling scientists to obtain highly pure cell populations for downstream analytical applications. As a gold standard in cell isolation, FACS yields populations with greater than 95% purity, making it indispensable for research requiring precise cellular characterization [64].
The technique's power lies in its ability to perform multiparametric analysis, simultaneously measuring multiple physical and chemical characteristics of thousands of cells per second. This single-cell resolution allows researchers to distinguish even rare cell populations within heterogeneous samples, a capability crucial for advanced research in immunology, oncology, and stem cell biology [17]. The integration of FACS with other immunochemical methods like ELISA and Western blotting creates a comprehensive analytical workflow that bridges cellular and molecular analysis.
Core Principles of FACS Technology
Instrumentation and Signal Detection
The FACS instrument operates by hydrodynamically focusing a cell suspension into a thin stream so that cells pass single-file through a laser beam. As each cell intersects the laser, two fundamental types of light are generated: forward scatter (FSC) and side scatter (SSC). FSC correlates with cell size, while SSC provides information about cellular granularity and internal complexity [35] [65]. When cells are labeled with fluorescent antibodies or dyes, the laser light excites these fluorophores, causing them to emit light at longer wavelengths.
The emitted light signals are collected by photomultiplier tubes (PMTs) or avalanche photodiode (APD) detectors, which convert the photons into electrical pulses. Modern flow cytometers can detect 20-30 different fluorescent colors simultaneously, with spectral flow cytometry representing a significant advancement by collecting the entire emission spectrum of each fluorophore [66]. The pulse area calculated from these signals directly correlates with fluorescence intensity, providing a quantitative measure of marker expression on each cell [65].
The Sorting Mechanism
The actual sorting mechanism employs a sophisticated fluidic system that vibrates the stream to break it into precisely spaced droplets. Just before droplet formation, the instrument measures each cell's characteristics. If a cell meets the predefined sorting criteria, an electrical charge is applied to the containing droplet as it breaks from the stream. These charged droplets are then deflected into collection tubes by passing through an electrostatic field. Modern sorters can typically sort up to four populations simultaneously at very high speeds while maintaining cell viability [64].
Experimental Protocol: A Standard FACS Workflow
Sample Preparation
Proper sample preparation is critical for successful FACS isolation. The protocol varies depending on the sample origin but must result in a single-cell suspension with maximal viability:
- Blood Samples: Isolate Peripheral Blood Mononuclear Cells (PBMCs) using density gradient centrifugation (e.g., Ficoll-Paque). Wash cells twice with PBS containing 1-2% FBS or BSA to block non-specific binding [64].
- Tissue Samples: Mechanically dissociate tissues using enzymatic digestion (e.g., collagenase, trypsin) followed by filtering through 40-70μm cell strainers to obtain single-cell suspensions [64].
- Cultured Cells: Harvest adherent cells using gentle enzymatic or non-enzymatic dissociation methods. Wash all samples in appropriate buffer and filter through 30-40μm filters immediately before sorting to remove clumps that could clog the instrument.
Table 1: Sample Types and Preparation Requirements for FACS
| Sample Type | Preparation Method | Key Considerations |
|---|---|---|
| Whole Blood/ PBMCs | Density gradient centrifugation | Anticoagulant treatment; rapid processing to maintain viability |
| Solid Tissues | Mechanical disruption + enzymatic digestion | Optimization of enzymes to preserve surface epitopes |
| Bone Marrow Aspirates | RBC lysis + density centrifugation | Handle gently to preserve rare progenitor cells |
| Cell Cultures | Enzymatic or mechanical harvest | Confirm >95% viability before sorting |
Staining and Panel Design
Fluorescent labeling requires careful optimization to ensure specific detection of target cells:
- Antibody Titration: Determine the optimal antibody concentration through preliminary titration experiments using known positive and negative control cells. Aim for the lowest concentration that provides clear separation from background.
- Viability Staining: Include a viability dye (e.g., propidium iodide, DAPI, or amine-reactive dyes) to exclude dead cells from analysis and sorting. Dead cells exhibit autofluorescence and nonspecific antibody binding [65].
- Intracellular Staining: For intracellular targets, first stain surface markers, then fix and permeabilize cells using commercial kits before adding intracellular antibodies.
- Multicolor Panel Design: When designing multicolor panels, select fluorophores with minimal spectral overlap. Use the brightest fluorophores for weakly expressed markers and consider the instrument's laser and detector configuration. Include fluorescence-minus-one (FMO) controls to properly set gates for multicolor experiments [35].
Instrument Setup and Sorting Parameters
Proper instrument configuration ensures accurate population identification and sorting:
- Calibration: Perform daily calibration using standardized beads to align lasers and ensure consistent fluorescence detection across channels.
- Sorting Mode Selection: Choose sorting mode based on application needs: purity mode (highest purity, lower speed), yield mode (maximizes cell recovery), or single-cell mode (for cloning applications).
- Collection Medium: Use collection tubes containing appropriate medium (often with high serum content or other protective agents) to maintain cell viability during the extended sorting process. For subsequent cell culture, maintain sorted cells in complete medium at appropriate temperatures until processing.
Data Analysis and Gating Strategies
Basic Gating Hierarchy
A systematic gating strategy is essential for accurately identifying target populations:
- Remove Debris: Begin by plotting FSC-A vs. SSC-A to gate on the cell population while excluding small debris and fragments [65].
- Exclude Doublets: Plot FSC-H vs. FSC-W or SSC-H vs. SSC-W to identify and exclude cell doublets or aggregates, ensuring analysis of single cells only [65].
- Exclude Dead Cells: Gate out dead cells identified by viability dye positivity.
- Identify Target Population: Apply fluorescent marker parameters to identify the population of interest using sequential gating strategies.
The following diagram illustrates this sequential gating strategy essential for accurate cell population identification in FACS analysis:
Data Visualization and Interpretation
Flow cytometry data can be visualized in several formats, each with specific applications:
- Histograms: Display single-parameter data, showing the distribution of fluorescence intensity for a single marker. Useful for assessing the expression level of one marker across a population [35] [65].
- Dot Plots: Represent two parameters simultaneously, with each dot representing an individual cell. Ideal for identifying subpopulations based on two markers and for setting rectangular or polygonal gates [35].
- Contour and Density Plots: Provide enhanced visualization of population density, highlighting areas with high event concentrations that might be overlooked in standard dot plots [35].
For quantification, the percentage of cells within each gated population is calculated. When gating sequentially (e.g., identifying neutrophils first, then IL-17a+ cells within that population), the percentage of the total population must be calculated by multiplying the percentages of each sequential gate [65].
Enhancing FACS Workflows with Innovative Technologies
Pre-enrichment Strategies
For rare cell populations or complex samples, pre-enrichment techniques can significantly improve FACS efficiency. Technologies like Akadeum's Buoyancy-Activated Cell Sorting (BACS) use microbubbles to gently remove unwanted cells before FACS, reducing cell sorting times by up to 15-fold and improving post-sort viability [67]. This approach is particularly valuable when working with sensitive primary cells or when rapid processing is essential to minimize cell stress.
Advanced Flow Cytometry Platforms
Recent technological innovations have expanded FACS capabilities:
- Spectral Flow Cytometry: Unlike conventional flow cytometry, spectral systems measure the entire emission spectrum of each fluorophore, enabling better separation of signals and more parameters to be measured simultaneously. The 2024 introduction of instruments like the Agilent NovoCyte Opteon Spectral Flow Cytometer supports configurations with up to 73 high-quality detectors [66].
- Mass Cytometry (CyTOF): This technology replaces fluorescent tags with heavy metal isotopes and detection by time-of-flight mass spectrometry, virtually eliminating spectral overlap and dramatically increasing parameter capacity [66].
- Advanced Detector Technology: Newer instruments like Beckman Coulter's DxFLEX Clinical Flow Cytometer utilize avalanche photodiode (APD) detectors instead of traditional photomultiplier tubes (PMTs), providing higher sensitivity for detecting dim markers and simplifying compensation procedures [66].
Downstream Applications and Quality Control
Post-Sort Validation and Applications
Quality control measures are essential after sorting to ensure population purity and viability:
- Purity Check: Reanalyze a small aliquot of sorted cells on the flow cytometer to confirm the purity of the isolated population. Most facilities guarantee >95% purity when this quality step is included [64].
- Viability Assessment: Perform post-sort viability assessment using trypan blue exclusion or fluorescent viability dyes to ensure cells are suitable for downstream applications.
- Applications: Sorted cells enable various downstream analyses including:
Comparison with Other Cell Isolation Methods
Table 2: Comparison of Major Cell Isolation Techniques
| Parameter | FACS | Magnetic Activated Cell Sorting (MACS) | Buoyancy-Activated Cell Sorting (BACS) |
|---|---|---|---|
| Purity | >95% [64] | Moderate to High | Moderate to High [67] |
| Cell Viability | High (with gentle settings) | High | High (gentle process) [67] |
| Multiparameter Capability | High (up to 30 parameters) [66] | Low (typically 1-2 parameters) | Low to Moderate |
| Throughput | Moderate (10,000+ cells/sec) [17] | High | High [67] |
| Equipment Cost | High | Moderate | Low [67] |
| Rare Population Isolation | Excellent | Good | Good |
| Downstream Applications | Versatile | Limited by antibody binding | Versatile [67] |
Essential Research Reagent Solutions
Successful FACS experiments require high-quality reagents and careful selection of appropriate tools. The following table outlines key solutions needed for effective cell sorting workflows:
Table 3: Essential Research Reagent Solutions for FACS
| Reagent Type | Key Function | Application Notes |
|---|---|---|
| Fluorophore-Conjugated Antibodies | Specific detection of surface and intracellular markers | Select clones validated for flow cytometry; consider brightness and spectral overlap [35] |
| Viability Dyes | Exclusion of dead cells from analysis and sorting | Critical for accurate results; choose dye compatible with fixation and laser lines [65] |
| Cell Staining Buffers | Provide optimal antibody binding conditions | Should contain Fc receptor blocking agents to reduce non-specific binding |
| Fixation and Permeabilization Reagents | Enable intracellular antigen detection | Maintain light scatter properties while preserving epitope integrity |
| Calibration Beads | Instrument performance verification and standardization | Essential for daily quality control and experimental reproducibility |
| Collection Media | Maintain viability of sorted cells | Often contain high serum concentrations or cellular protective agents |
Future Directions in FACS Technology
The flow cytometry market continues to evolve rapidly, projected to grow at a CAGR of 7.17% between 2024 and 2031 to reach $6.99 billion [66]. Key future developments include further integration of spectral flow cytometry, increased standardization across platforms and applications, and the combination of flow cytometry with spatial biology techniques like imaging mass cytometry [66]. These advancements will further solidify FACS as an indispensable tool for both basic research and clinical applications in immunochemical method development.
The continued innovation in FACS technology ensures its position as a cornerstone technique in biomedical research, particularly for drug discovery and the development of cell-based therapies, where isolation of pure, functional cell populations is paramount to success.
Optimizing Performance: Troubleshooting Common Pitfalls and Enhancing Assay Quality
As a cornerstone of immunochemical methods, the Enzyme-Linked Immunosorbent Assay (ELISA) provides a powerful platform for detecting and quantifying proteins, peptides, antibodies, and other biomolecules in diverse biological fluids [68]. Despite its widespread use in research and diagnostic laboratories, technicians frequently encounter technical challenges that compromise data quality and reliability. This guide addresses three pervasive issues—high background, poor duplicates, and low signal—by providing evidence-based troubleshooting strategies, detailed protocols, and reagent optimization techniques. By integrating these methodologies into your workflow, you can enhance assay performance, ensure reproducible results, and maintain the integrity of your immunochemical research.
Understanding ELISA: Principles and Formats
ELISA operates on the principle of detecting antigen-antibody interactions through enzyme-mediated signal amplification. The assay employs a solid-phase support, typically a 96-well microplate, where either antigen or antibody is immobilized [68]. Subsequent binding events are detected using enzyme-conjugated antibodies (e.g., horseradish peroxidase or alkaline phosphatase) that catalyze a substrate conversion, generating a measurable colorimetric, chemiluminescent, or fluorescent signal [69]. The intensity of this signal is proportional to the target analyte concentration in the sample.
Several ELISA formats exist, each with distinct advantages and applications:
- Direct ELISA: Antigen is coated directly onto the plate and detected using a single enzyme-conjugated antibody. This format is simple but may lack sensitivity [69].
- Indirect ELISA: A primary antibody binds the immobilized antigen, followed by an enzyme-conjugated secondary antibody that recognizes the primary. This provides signal amplification but increases the risk of non-specific binding [69].
- Sandwich ELISA: Employing two antibodies that recognize different epitopes on the target antigen, this format offers high specificity and is ideal for complex samples [70].
- Competitive/Inhibition ELISA: Used for small molecules, this format quantifies analyte based on its ability to compete with a reference for antibody binding sites [69].
Figure 1: General ELISA Workflow. This diagram illustrates the sequential steps in a typical sandwich or indirect ELISA procedure, with wash steps between each major stage to remove unbound material.
Troubleshooting High Background
High background signal is one of the most frequent challenges in ELISA, reducing the signal-to-noise ratio and impairing accurate quantification. The underlying causes typically involve non-specific binding, suboptimal reagent conditions, or procedural errors.
Primary Causes and Solutions
Table 1: Troubleshooting High Background in ELISA
| Cause | Specific Issue | Recommended Solution |
|---|---|---|
| Non-Specific Binding | Inadequate blocking [71] | Increase blocking incubation time; use 5-10% normal serum from the same species as the detection antibody [71]; consider alternative blockers like StabilGuard [70]. |
| Secondary antibody cross-reactivity [71] | Use secondary antibodies pre-adsorbed against the immunoglobulin of your sample species; run control without primary antibody [71]. | |
| Interfering substances (HAMA, heterophilic antibodies) [70] | Use specialized diluents like MatrixGuard to block matrix interferences [70]. | |
| Reagent-Related Issues | Excessive antibody concentration [71] [72] | Titrate antibodies to determine optimal concentration; further dilute if too high [71]. |
| Overly concentrated enzyme conjugate or substrate [71] [72] | Dilute substrate; reduce substrate incubation time [71]; check conjugate dilution [72]. | |
| Substrate with innate color or contamination [70] | Use high-quality substrates; ensure solutions are prepared fresh and protected from light [70] [72]. | |
| Procedural Errors | Inadequate washing [71] [40] | Increase wash cycles and duration; incorporate 30-second soak steps between washes [40]; ensure complete buffer removal [71]. |
| Delay in reading after stop solution [71] [70] | Read plate immediately after adding stop solution [71]; measure at consistent time points [71]. | |
| Incorrect incubation temperature or evaporation [72] | Maintain consistent temperature; cover plate during incubations to prevent evaporation [72]. |
Experimental Protocol: Optimizing Blocking and Washing
To systematically address high background, implement this optimization protocol:
Evaluate Blocking Efficiency:
- Test different blocking buffers (e.g., BSA, non-fat dry milk, commercial synthetic blockers).
- Incubate with blocking buffer for 30, 60, and 90 minutes at room temperature.
- Include control wells without primary antibody to assess non-specific secondary antibody binding.
Optimize Washing Stringency:
- Perform comparative washing with 3, 5, and 7 cycles of PBS-Tween (0.05%).
- Incorporate a 30-second soak step with wash buffer before aspiration.
- For automated washers, verify all ports are unobstructed and fluid delivery is uniform across all wells.
Validate Reagent Concentrations:
- Perform checkerboard titration for all antibodies to identify optimal dilutions.
- Test substrate incubation times from 5-30 minutes, stopping the reaction when the highest standard develops adequately but background remains low.
Addressing Poor Duplicates
Poor well-to-well reproducibility, evidenced by high coefficient of variation (%CV) between duplicates, undermines data reliability and introduces statistical uncertainty.
Primary Causes and Solutions
Table 2: Troubleshooting Poor Duplicates in ELISA
| Cause | Specific Issue | Recommended Solution |
|---|---|---|
| Pipetting Inconsistencies | Uncalibrated pipettes [72] | Calibrate pipettes regularly; use calibrated pipettes for accurate volume dispensing [72]. |
| Improper pipetting technique [72] | Use reverse pipetting for viscous reagents; pre-wet tips; ensure tight tip seals [72]. | |
| Inconsistent mixing of reagents [72] | Thoroughly mix all reagents before use; avoid bubble formation [72]. | |
| Coating & Binding Variability | Uneven plate coating [40] | Ensure uniform coating by pipetting along the side of wells; use high-binding plates; confirm coating buffer pH (typically 9.6) [40]. |
| Improper plate type [40] | Use validated ELISA plates (not tissue culture plates) for optimal protein binding [40]. | |
| Edge effects (temperature gradients) [40] | Use plate sealers; avoid stacking plates during incubation; maintain consistent room temperature [40]. | |
| Washing Irregularities | Inconsistent washing across wells [40] [72] | Manual washing: maintain consistent timing and technique; automated washing: check nozzle function [40]. |
| Residual buffer or incomplete removal [72] | After washing, tap plate firmly on absorbent paper to remove residual liquid [72]. |
Experimental Protocol: Standardizing Technique
Implement this protocol to improve duplicate consistency:
Pipette Calibration and Technique Validation:
- Verify pipette accuracy using analytical balance and water at room temperature.
- Practice consistent pipetting rhythm and depth (avoid touching well bottoms with tips).
- Use the same pipette and operator for critical steps when possible.
Plate Coating Uniformity Assessment:
- Coat plate using standardized technique, adding reagents to wells in the same order.
- Include control wells coated with known antigen concentration to assess inter-well variability.
- During blocking, ensure complete well coverage without bubbles.
Washing Consistency Evaluation:
- For manual washing, use a multichannel pipette with calibrated tips.
- For automated systems, run a dye test to visualize washing uniformity across the plate.
- Document and standardize the angle and force used when tapping plates dry.
Resolving Low Signal
Inadequate signal intensity compromises assay sensitivity and may lead to false negatives, particularly when analyzing low-abundance targets.
Primary Causes and Solutions
Table 3: Troubleshooting Low Signal in ELISA
| Cause | Specific Issue | Recommended Solution |
|---|---|---|
| Reagent Problems | Inactive or expired enzyme conjugate [73] | Prepare fresh conjugates; test on known positive control; avoid repeated freeze-thaw cycles [73]. |
| Degraded or contaminated substrate [73] [72] | Use fresh substrate; protect from light; ensure proper storage conditions [73]. | |
| Insufficient antibody affinity/ concentration [40] [73] | Titrate antibodies to determine optimal concentration; check datasheet for recommended ranges [40]. | |
| Assay Condition Issues | Insufficient antigen coating [73] | Optimize coating concentration (typically 1-10 µg/mL); extend coating time to overnight at 4°C [73]. |
| Inadequate incubation times or temperatures [72] | Follow recommended incubation conditions; ensure all reagents are at room temperature before use [72]. | |
| Signal amplification too low [71] | For biotin-streptavidin systems, optimize conjugate concentrations; extend substrate development time [71]. | |
| Sample & Detection Problems | Target protein degradation or low expression [72] | Include positive control; use protease inhibitors during sample preparation; concentrate samples if needed [72]. |
| Matrix interference [73] | Dilute samples in appropriate matrix; perform spike-and-recovery experiments [73]. | |
| Incorrect reader settings [73] | Verify correct wavelength (e.g., 450 nm for TMB); blank instrument properly [73]. |
Experimental Protocol: Signal Optimization
To systematically address low signal issues:
Reagent Integrity Verification:
- Test new aliquots of critical reagents (conjugates, substrates).
- Run a positive control with known reactivity to verify assay performance.
- For in-house assays, perform checkerboard titration to re-optimize antibody pairs.
Incubation Condition Optimization:
- Test extended incubation times for antibody binding (30, 60, 90 minutes).
- Compare room temperature versus 37°C incubation for critical steps.
- Ensure consistent timing across all wells for substrate development.
Sample Quality Assessment:
- Perform serial dilutions of samples to identify hook effects or matrix interference.
- Include spike-and-recovery controls to assess sample-specific effects.
- Verify sample storage conditions and avoid repeated freeze-thaw cycles.
The Scientist's Toolkit: Essential Reagents and Materials
Table 4: Research Reagent Solutions for ELISA Optimization
| Reagent Category | Specific Examples | Function & Application |
|---|---|---|
| Blocking Agents | StabilGuard, StabilBlock, WellChampion, BSA, non-fat dry milk [70] [74] | Reduce non-specific binding by occupying unused protein-binding sites on the solid phase [70]. |
| Specialized Diluents | MatrixGuard, Surmodics Assay Diluent (Protein-Free) [70] | Minimize matrix interference and false positives while maintaining assay signal in complex samples [70]. |
| Wash Buffers | PBS-Tween (0.05%), Tris-buffered saline with Tween [74] | Remove unbound reagents while maintaining assay integrity; Tween detergent reduces non-specific binding [74]. |
| Detection Substrates | TMB (3,3',5,5'-Tetramethylbenzidine), PNPP (p-Nitrophenyl Phosphate) [68] [70] | Chromogenic enzymes for HRP (TMB) or AP (PNPP) that generate measurable color change upon enzymatic reaction [68]. |
| Coating Buffers | Carbonate-bicarbonate buffer (pH 9.6) [74] | Optimal pH for passive adsorption of proteins to polystyrene microplates [74]. |
| Stop Solutions | Sulfuric acid (0.3-1M), NaOH [68] [74] | Halt enzyme-substrate reaction at desired endpoint; acid stop solutions also enhance color intensity for certain substrates [68]. |
Figure 2: ELISA Troubleshooting Decision Pathway. This flowchart outlines a systematic approach to diagnosing common ELISA performance issues, guiding users to potential causes based on observed symptoms.
Effective ELISA troubleshooting requires a systematic approach that addresses reagent quality, procedural execution, and assay design. By understanding the interconnected nature of high background, poor duplicates, and low signal, researchers can implement targeted solutions that dramatically improve data quality. The protocols and reference tables provided here serve as a comprehensive framework for diagnosing and resolving these common challenges. As ELISA methodologies continue to evolve—with innovations such as kinetic ELISA (k-ELISA) offering reduced labor and improved accuracy [75]—the fundamental principles of optimization and validation remain essential for generating reliable, reproducible results in both research and diagnostic applications.
Flow cytometry stands as a cornerstone technique in modern biomedical research and drug development, enabling multi-parameter analysis of individual cells within heterogeneous populations. This powerful immunochemical method provides critical insights into cellular characteristics, functions, and signaling pathways that are essential for understanding disease mechanisms and therapeutic responses. However, even experienced researchers frequently encounter technical challenges that can compromise data quality and experimental outcomes. Among the most pervasive issues are instrument clogging, poor cell viability, and weak fluorescent staining—problems that can introduce variability, reduce resolution, and potentially lead to erroneous conclusions. This technical guide provides a comprehensive troubleshooting framework for these specific challenges, situating flow cytometry within the broader context of immunochemical analytical techniques to empower researchers with practical solutions for obtaining reliable, publication-quality data.
Section 1: Understanding Flow Cytometry in the Immunochemical Method Landscape
Flow cytometry occupies a distinct position within the spectrum of immunochemical methods, bridging cellular analysis with molecular detection. Unlike plate-based techniques such as Enzyme-Linked Immunosorbent Assay (ELISA) that provide bulk measurement of soluble analytes, flow cytometry enables multi-parameter analysis at the single-cell level, preserving cellular context while quantifying surface and intracellular markers [20].
Comparative Methodological Analysis: When evaluating flow cytometry against ELISA, each technique demonstrates distinct advantages and limitations. ELISA excels at quantifying soluble proteins (e.g., cytokines, chemokines) in biological fluids with high sensitivity and cost-effectiveness for processing large sample batches [20]. However, it lacks cellular resolution and cannot identify the specific cellular sources of secreted factors. Flow cytometry addresses this limitation by enabling intracellular cytokine staining and cell surface marker co-detection, allowing researchers to link specific functions to distinct cell populations [76]. Studies comparing these methodologies have shown generally good correlation for cytokines including IL-1β, IL-6, and TNF-α, though Bland-Altman analysis reveals method-specific differences in agreement, particularly for TNF-α measurements [76].
The following table summarizes the key technical considerations when selecting between these methodologies:
Table 1: Comparative Analysis of Immunochemical Methods
| Parameter | Flow Cytometry | ELISA |
|---|---|---|
| Analytical Focus | Single-cell analysis | Bulk solution measurement |
| Multiplexing Capacity | High (10+ parameters simultaneously) | Limited (typically single analyte per well) |
| Cellular Context | Preserved | Lost |
| Sample Throughput | Moderate | High |
| Sample Volume Requirements | Low to moderate | Moderate to high |
| Instrument Cost | High | Low to moderate |
| Information Output | Cellular frequency, phenotype, function, signaling | Total analyte concentration |
Section 2: Systematic Troubleshooting of Common Flow Cytometry Issues
Resolving Flow Cell Clogging
Flow cell clogging represents one of the most frequent instrumental failures in flow cytometry, typically resulting from particulate matter in samples. This issue manifests as irregular fluid flow, abrupt pressure changes, fluctuating event rates, and abnormal scatter profiles.
Table 2: Troubleshooting Guide for Flow Cell Clogging
| Cause | Preventive Measures | Corrective Actions |
|---|---|---|
| Cell Clumping | Gently pipette to create single-cell suspension; filter through 35-70μm mesh before acquisition | Dilute sample and restart acquisition; perform additional filtration |
| High Cell Concentration | Adjust concentration to 0.5-1×10⁶ cells/mL [25] | Dilute sample with appropriate buffer |
| Debris Contamination | Centrifuge samples appropriately (200-300 ×g for 5 min); avoid excessive speeds that damage cells [77] | Increase centrifugation time or speed slightly; filter sample |
| Precipitated Reagents | Use fresh, filtered buffers; avoid phosphate crystallization in PBS | Flush system with appropriate cleaning solutions |
| Instrument Maintenance | Perform regular cleaning according to manufacturer schedules | Run 10% bleach for 5-10 min, followed by dH₂O for 5-10 min to unclog [78] [77] |
The following workflow outlines a systematic approach to diagnosing and resolving clogging issues:
Addressing Poor Cell Viability
Poor cell viability presents a multifaceted challenge, contributing to high background autofluorescence, non-specific antibody binding, and aberrant scatter properties that compromise data interpretation. Several factors influence viability, including sample preparation techniques, handling conditions, and storage parameters.
Table 3: Troubleshooting Guide for Poor Cell Viability
| Cause | Impact on Data Quality | Solutions |
|---|---|---|
| Mechanical Damage During Processing | Cell fragmentation; abnormal scatter profiles | Avoid vigorous vortexing; use gentle pipetting; centrifuge at 200-300 ×g for 5 min [25] |
| Inadequate Handling Conditions | Reduced viability; increased apoptosis | Process samples promptly; maintain cells at 4°C during staining; use ice-cold buffers [77] |
| Delayed Analysis | Increased necrosis and debris | Acquire data immediately after staining (within 1-2 hours); if necessary, fix samples with 1-4% PFA [77] |
| Freeze-Thaw Cycles (PBMCs) | Reduced recovery and functionality | Use fresh cells whenever possible; if freezing necessary, optimize cryopreservation protocols [78] |
| Toxic Reagents | Cellular stress and death | Use fresh formaldehyde without methanol; avoid alcohol-based fixatives for live-cell analysis [78] |
Viability Staining Protocol: Incorporating viability dyes into flow cytometry panels is essential for distinguishing live from dead cells during analysis. The following protocol outlines the recommended approach:
- Prepare single-cell suspension with viability ≥90% as a starting point [25]
- Select appropriate viability dye based on experimental configuration:
- Incubate with viability dye according to manufacturer recommendations, typically in the dark at 4°C for 15-30 minutes [25]
- Wash cells twice with suspension buffer (PBS with 5-10% FCS) before proceeding to antibody staining [25]
Optimizing Weak Fluorescent Staining
Weak or absent fluorescence signals represent one of the most complex troubleshooting scenarios in flow cytometry, with potential causes spanning biological, reagent-related, and instrumental factors.
Table 4: Comprehensive Troubleshooting for Weak Staining
| Category | Specific Issue | Solution |
|---|---|---|
| Biological Factors | Low antigen expression | Optimize stimulation conditions; use positive controls; check literature for expression patterns [78] |
| Antigen internalization | Perform all staining steps at 4°C; use ice-cold reagents [77] | |
| Reagent Considerations | Suboptimal antibody concentration | Titrate all antibodies before use; follow manufacturer recommendations for 10⁵-10⁶ cells [78] |
| Fluorochrome brightness | Pair low-density antigens with bright fluorochromes (PE, APC); high-density antigens with dim fluorochromes (FITC) [78] | |
| Antibody degradation | Store antibodies properly; protect from light; avoid freeze-thaw cycles [77] | |
| Technical Issues | Inadequate fixation/permeabilization | For intracellular targets: use appropriate fixative (1-4% PFA) followed by permeabilization (0.1-1% Triton X-100, saponin) [78] [25] |
| Laser/PMT misconfiguration | Verify laser wavelengths match fluorochrome requirements; adjust PMT voltages appropriately [78] | |
| Over-compensation | Use MFI alignment for compensation instead of visual comparison [77] |
Signal Amplification Strategies: For challenging low-abundance targets, consider these advanced approaches:
- Biotin-Streptavidin Systems: Employ biotinylated primary antibodies followed by fluorescent streptavidin conjugates to amplify signals [78]
- Tyramide Signal Amplification: Utilize enzyme-mediated deposition of multiple fluorophore molecules for enhanced detection sensitivity
- Brightest Fluorochrome Pairing: Reserve high-intensity fluorophores (PE, APC) for the most dimly expressed targets in multi-color panels [78]
Section 3: The Scientist's Toolkit: Essential Research Reagents
Successful flow cytometry requires careful selection and quality control of critical reagents. The following table outlines essential materials and their functions in optimizing experimental outcomes:
Table 5: Essential Research Reagent Solutions for Flow Cytometry
| Reagent Category | Specific Examples | Function & Application Notes |
|---|---|---|
| Viability Dyes | 7-AAD, DAPI, TOPRO-3, fixable viability dyes (eFluor) | Distinguish live/dead cells; critical for excluding compromised cells from analysis [78] [25] |
| Fixation Reagents | 1-4% paraformaldehyde, 90% methanol, 100% acetone | Preserve cellular architecture and epitope integrity; choice depends on target antigen [25] |
| Permeabilization Detergents | Triton X-100, NP-40, saponin, Tween-20 | Enable antibody access to intracellular targets; harsh detergents for nuclear antigens, mild for cytoplasmic [25] |
| Blocking Agents | BSA, FCS, normal serum, FcR blocking reagents (anti-CD16/CD32) | Reduce non-specific antibody binding; critical for improving signal-to-noise ratio [78] [77] |
| Wash & Suspension Buffers | PBS with 5-10% FCS, 0.09% sodium azide | Maintain cell viability and prevent bacterial growth; azide prevents receptor internalization [25] [77] |
| Reference Controls | Unstained cells, isotype controls, FMO controls, positive/negative controls | Essential for instrument setup, gating, and data interpretation [78] |
Section 4: Integrated Experimental Workflow for Reliable Flow Cytometry
The following comprehensive workflow integrates troubleshooting principles into a standardized protocol for robust flow cytometry data generation:
Critical Protocol Notes:
- Sample Quality Control: Begin with high-viability cell suspensions (≥90%) and verify single-cell morphology under microscope before staining [25]
- Simultaneous Surface/Intracellular Staining: For experiments requiring both surface and intracellular markers, complete surface staining before fixation and permeabilization [25]
- Methanol Permeabilization Specifics: When using 90% methanol for permeabilization, chill cells on ice prior to drop-wise addition while gently vortexing to prevent hypotonic shock [78]
- Fixation Considerations: Note that fixation can compromise detection of certain surface epitopes; test compatibility with your specific targets before combined staining approaches [78]
Effective troubleshooting in flow cytometry requires a systematic approach that addresses the interconnected nature of sample preparation, reagent selection, and instrument operation. By understanding the fundamental principles underlying common issues such as clogging, poor viability, and weak staining, researchers can implement proactive strategies to prevent problems before they compromise experimental outcomes. The integration of appropriate controls, methodical reagent validation, and adherence to standardized protocols provides a foundation for generating robust, reproducible data that advances our understanding of cellular function in health and disease. As flow cytometry technologies continue to evolve with increased parameter capabilities and analytical sophistication, these core troubleshooting principles will remain essential for extracting meaningful biological insights from complex cellular systems.
Optimizing Antibody Titrations and Incubation Conditions Using Checkerboard Assays
Checkerboard titration is a fundamental experimental design used for the simultaneous optimization of two key variables in immunoassays, most commonly the concentrations of capture and detection antibodies in an Enzyme-Linked Immunosorbent Assay (ELISA) [79] [80]. This method is indispensable in immunochemical method development because it systematically evaluates multiple reagent combinations in a single experiment, thereby rapidly identifying conditions that yield the optimal signal-to-noise ratio [79] [81]. Without this systematic approach, researchers risk using antibody concentrations that are either too concentrated, leading to assay saturation and wasted reagents, or too dilute, producing a weak signal that is difficult to detect and quantify [79].
The power of the checkerboard assay lies in its efficiency and practicality. By testing a matrix of conditions across a 96-well microplate, researchers can swiftly pinpoint not just the optimal concentration of each individual reagent, but the ideal ratio between them [79]. This approach is a critical step in developing robust and reliable immunoassays, forming the foundation for accurate data in both ELISA and providing a principles-based framework for other immunochemical techniques like flow cytometry [17]. The subsequent diagram illustrates the core logical process behind employing a checkerboard assay for optimization.
Checkerboard Assay Experimental Protocol
Core Principles and Setup
A checkerboard assay is designed to test two variables simultaneously across the rows and columns of a microtiter plate [79]. In a standard setup for optimizing a sandwich ELISA, one variable (e.g., the capture antibody) is titrated across the columns of the plate, while the second variable (e.g., the detection antibody or the sample/antigen) is titrated down the rows [79] [80]. A typical configuration might involve setting up doubling dilutions of the reagents, which efficiently covers a broad concentration range [79]. For instance, a starting concentration of 20 µg/mL for an antigen, when serially diluted, can reach a non-saturating 0.6 µg/mL within six wells, while a detection antibody might be started at 500 ng/mL in the first row and reach 8 ng/mL by the seventh row [79]. It is critical to include control wells, such as those receiving no detection antibody, to accurately measure background signal [79].
Step-by-Step Methodology
The following workflow provides a detailed, visual representation of the key steps involved in performing a checkerboard titration for ELISA optimization.
Step 1: Plate Coating. Prepare a series of dilutions of the capture antibody in a coating buffer (e.g., 15-35 mM carbonate/bicarbonate buffer, pH 9.6) [82] [81]. As shown in Table 2, recommended starting concentrations for affinity-purified antibodies typically range from 1–12 µg/mL [81]. Dispense these dilutions across the columns of the plate, with each column receiving a different concentration. Incubate as required (e.g., 2 hours at room temperature or overnight at 4°C).
Step 2: Blocking. After washing the plate, add a blocking solution to all wells to cover any remaining protein-binding sites. Common blockers include 0.5% Hammersten casein or solutions containing BSA [82] [80]. Incubate for at least 1 hour at room temperature [82].
Step 3: Antigen Addition. In a sandwich ELISA format, add the antigen or sample to the plate. In the checkerboard design, this can be titrated down the rows of the plate. A recommended starting concentration for a recombinant antigen is in the range of 1-20 µg/mL [79]. Incubate for a set period (e.g., 2 hours at room temperature) [82].
Step 4: Detection Antibody Incubation. Add the detection antibody, which is titrated down the rows of the plate, perpendicular to the capture antibody dilution. For affinity-purified antibodies, a concentration range of 0.5–5 µg/mL is a good starting point [81]. The detection antibody is often biotinylated [82].
Step 5: Conjugate Incubation. Add an enzyme-conjugated secondary reagent, such as Streptavidin-Horseradish Peroxidase (HRP) if using a biotinylated detection antibody. The conjugate should be diluted in a blocking buffer to an appropriate concentration (e.g., 1:1,000 dilution for HRP in a chemiluminescent system) [82] [81]. Incubate for 1 hour at room temperature.
Step 6: Signal Development. After final washes, add a suitable substrate. For HRP, this could be a chemiluminescent substrate like LumiGLO for highly sensitive detection, or a colorimetric substrate like TMB for simpler visual or spectrophotometric reading [82] [81]. The signal is captured, for example, on autoradiography film for chemiluminescence or by measuring absorbance with a plate reader for colorimetry [82].
Step 7: Data Analysis. Quantify the signals from the plate. The optimal condition is identified as the combination of capture and detection antibody concentrations that produces the strongest specific signal with the lowest background, thus maximizing the signal-to-noise ratio [79] [80].
Optimization Parameters and Data Analysis
Key Variables for Optimization
While the checkerboard assay is most famously used for antibody titration, its application extends to a wide range of other critical parameters in immunoassay development [80]. A comprehensive optimization of an ELISA will also consider and potentially use checkerboard designs to test the following variables, ideally one or two at a time while holding others constant:
- Coating Buffer: The pH and composition of the buffer used for immobilizing the capture antibody can affect binding efficiency [80].
- Blocking Solution: The choice (e.g., BSA, casein, non-fat dry milk) and concentration of blocking agent is crucial for minimizing non-specific binding and reducing background noise [80] [81].
- Incubation Times and Temperatures: The duration and temperature for each step, including coating, blocking, and antibody incubations, can significantly impact assay kinetics and performance [80].
- Wash Buffers and Procedures: The stringency and frequency of washing steps can influence the removal of unbound reagents and reduce background [80].
Reagent Concentration Guidelines and Research Toolkit
Successful optimization relies on using high-quality reagents within appropriate concentration ranges. The following table synthesizes recommended working concentrations for key reagents used in ELISA development and optimization, serving as an essential toolkit for researchers.
Table 1: Research Reagent Solutions for ELISA Optimization
| Reagent | Recommended Starting Concentration Range | Function and Notes |
|---|---|---|
| Coating Antibody [81] | 1–12 µg/mL (Affinity-purified monoclonal or polyclonal) | Binds and immobilizes the target antigen onto the solid phase. Using unpurified antibodies may increase background. |
| Detection Antibody [81] | 0.5–5 µg/mL (Affinity-purified monoclonal or polyclonal) | Binds to the captured antigen; often biotinylated for subsequent signal amplification. |
| HRP-Conjugate [81] | 10–100 ng/mL (Chemiluminescent system) | Enzyme-streptavidin conjugate that binds to biotin; catalyzes the substrate reaction for detection. |
| Antigen (for Standard Curve) [79] | 1–20 µg/mL | Used to generate the standard curve for quantifying unknown samples. |
| Blocking Agent (e.g., Casein) [82] | 0.5% - 1% in buffer | Covers unsaturated binding sites on the plate to prevent non-specific antibody binding, reducing background. |
Data Interpretation and Selection of Optimal Conditions
After running the checkerboard assay and quantifying the results, the data must be analyzed to select the optimal conditions. The primary goal is to find the combination that provides the strongest quantifiable signal with the lowest background [79] [80]. This is often expressed as the highest signal-to-noise ratio. The "noise" is typically determined from the negative control wells (e.g., wells with no detection antibody or no antigen) [79] [80].
Researchers should look for a well or a set of adjacent wells where the signal intensity is high and has reached a plateau, indicating antibody excess, but before the point where further increasing the antibody concentration provides no significant signal increase. Choosing a condition from the center of this plateau region ensures the assay is robust and can tolerate minor pipetting errors. The quantitative data from the standards can also be used to ensure the dynamic range of the assay is suitable for the intended sample concentrations [80].
Assay Validation and Quality Control
Once optimal conditions are identified through checkerboard titration, the next critical phase is assay validation to ensure the ELISA produces accurate, reproducible, and reliable data. Several key experiments are essential for this process:
- Spike and Recovery: This experiment assesses the impact of the sample matrix on the assay readout. A known amount of the purified analyte is spiked into the sample matrix and into a standard diluent. The recovery of the analyte from the sample matrix is calculated and compared to the recovery from the diluent. Ideally, the recovery should be close to 100%, indicating that matrix components are not interfering with the antibody-antigen interaction [80].
- Dilutional Linearity: This test evaluates whether the assay can accurately measure the analyte across different concentrations. A sample with a high concentration of the analyte is serially diluted and analyzed. The observed concentration for each dilution should be proportional to the dilution factor, demonstrating that the assay maintains linearity and accuracy throughout its working range [80].
- Parallelism: This validation step determines if the antibody binding affinity is consistent between the native analyte in the sample and the purified analyte used for the standard curve. Serial dilutions of a sample with a high endogenous level of the analyte are run. The calculated concentrations for these dilutions should be consistent, with a low coefficient of variation (%CV). A high %CV suggests a matrix effect that is interfering with antibody binding [80].
In addition to these experiments, the consistent use of appropriate controls is non-negotiable for quality control. This includes positive controls (known amount of analyte), negative controls (no analyte), and blanks (no detection components) run on every plate to monitor assay performance and permit background subtraction [80].
Applications in Broader Immunochemical Research
The principles of checkerboard optimization, while central to ELISA, also find utility and parallels in other immunochemical methods, creating a cohesive framework for assay development in biomedical research.
- Flow Cytometry: Although flow cytometry is a solution-based technique focused on single-cell analysis, the core concept of titrating antibodies to find the optimal signal-to-noise ratio is directly applicable [17]. Just as in ELISA, using too much antibody in flow cytometry can lead to high background and non-specific binding, while too little can result in weak fluorescence signals. Therefore, antibody titration is a critical step in panel design for flow cytometry to ensure clear resolution of cell populations [17].
- Checkerboard Immunoblotting (CBIB): This technique directly adapts the checkerboard format to membrane-based blotting. As demonstrated in research on periodontal disease biomarkers, CBIB allows for the high-throughput quantification of multiple inflammatory mediators (e.g., IL-1β, MMP-8, IL-8) from dozens of samples simultaneously on a single membrane [82]. This powerful application enables the site-specific correlation of host response mediators with clinical outcomes.
- Competitive ELISA (cELISA) Development: The checkerboard method is also instrumental in developing competitive ELISA formats, which are used for detecting antibodies or small molecules. Recent studies on developing cELISA for diseases like Peste-des-petits-ruminants (PPR) and Helicobacter pylori infection detail the use of checkerboard titration to optimize key parameters such as the dilution of capture and detection antibodies, antigen coating concentration, and incubation times [83] [84]. For instance, one study determined optimal conditions to be a 1:1000 antibody dilution and a 1 µg/well antigen coating concentration [84].
Checkerboard titration remains an indispensable, efficient, and rational strategy for optimizing immunoassays. Its systematic approach to evaluating two variables in parallel is fundamental for developing robust ELISA protocols, ensuring that reagent concentrations are balanced to maximize sensitivity and specificity while minimizing background and cost. The principles learned from checkerboard ELISA optimization provide a strong foundation for other immunochemical techniques, including flow cytometry and immunoblotting, forming a core competency in the field of immunochemical methods. By rigorously applying this method and following it with comprehensive assay validation, researchers and drug development professionals can generate highly reliable, quantitative data that is critical for both basic research and clinical diagnostics.
In both flow cytometry and Enzyme-Linked Immunosorbent Assay (ELISA), robust experimental controls are fundamental to generating reliable, reproducible, and interpretable data. These techniques, cornerstones of immunochemical analysis, rely on specific antibody-antigen interactions. Without proper controls, results can be compromised by non-specific binding, variable reagent performance, or cellular artifacts. This guide focuses on three critical control categories—Fluorescence Minus One (FMO), Isotype, and Viability controls—detailing their implementation and importance within a rigorous scientific framework. While their application differs between the solution-based, multi-parametric environment of flow cytometry and the plate-based, bulk measurement format of ELISA, the underlying principles of validation and verification remain consistent.
Understanding the Core Controls
Fluorescence Minus One (FMO) Controls
Purpose and Principle: FMO controls are essential for accurately defining positive and negative populations in multicolor flow cytometry experiments. They account for spectral spillover, where the fluorescence from one fluorophore is detected in the channel of another, which can obscure true negative populations [85]. An FMO control contains all the antibodies in a panel except one; this omitted antibody defines the channel being controlled [85]. For example, a PE FMO control would include all antibodies except the one conjugated to PE.
Application in Flow Cytometry: FMO controls provide a background signal for gating that includes the spillover contributions from all other fluorophores in the panel. This is crucial for setting accurate gates, especially for low-abundance antigens or markers with continuous expression patterns [85]. Using an unstained control alone is insufficient, as it does not account for this spread of signal caused by fluorescence spillover [85].
Application in ELISA: The concept of an FMO control is not directly applicable to standard ELISA formats. ELISA is typically a single-parameter assay, and spectral overlap between detection channels is not a concern. The function of verifying signal specificity in ELISA is fulfilled by other controls, such as negative controls, blank controls, and antigen-coated wells with no primary antibody.
Isotype Controls
Purpose and Principle: Isotype controls are antibodies that match the host species, isotype (class and subclass), and conjugation of the primary antibody but are raised against a non-relevant target antigen not present in the sample [85]. They are designed to measure the level of non-specific antibody binding caused by Fc receptor interactions or other non-specific protein binding [85].
Application in Flow Cytometry: Isotype controls help determine the level of background fluorescence from non-specific antibody binding [85]. However, it is critical to note that they should not be used to set the boundary between positive and negative cells or to define positive gating regions [85]. They are a qualitative check for non-specific binding. An ideal isotype control must be meticulously matched to the primary antibody in every aspect, including the fluorophore-to-protein ratio [85].
Application in ELISA: Isotype controls can be used to verify the specificity of the detection system. For instance, in a sandwich ELISA, an isotype control can be coated on the plate instead of the capture antibody to confirm that the target analyte is specifically binding to the capture antibody and not adhering non-specifically to the plate or the isotype antibody itself.
Viability Controls
Purpose and Principle: Viability controls are used to distinguish live cells from dead cells. This is critical because dead cells are a major source of artifacts; they exhibit increased autofluorescence and non-specific antibody binding, which can lead to inaccurate results [85] [86].
Application in Flow Cytometry: Using viability dyes is a standard practice to identify and gate out dead cells during analysis [86]. Common viability dyes include cell-impermeable DNA-binding dyes like 7-AAD, DAPI, and propidium iodide, which are excluded from live cells with intact membranes and thus only stain dead cells [85] [86]. An alternative approach uses cell-permeable dyes like calcein AM, which is metabolized by esterases in live cells to produce a fluorescent signal [85].
Application in ELISA: In cell-based ELISA systems where the assay is performed on intact cells, viability controls are important. The presence of a high percentage of dead cells can skew results by releasing intracellular contents that may be detected non-specifically or by altering the expected signal from a surface antigen. While not always run in parallel with every ELISA, assessing cell viability prior to setting up the assay is a critical step.
Comparative Analysis: Controls in Flow Cytometry vs. ELISA
The table below summarizes the primary applications and considerations for each control across both techniques.
Table 1: Comparison of Control Applications in Flow Cytometry and ELISA
| Control Type | Primary Role in Flow Cytometry | Primary Role in ELISA | Key Considerations |
|---|---|---|---|
| FMO Control | Correctly gate populations by accounting for fluorescence spillover in multicolor panels [85]. | Not applicable. | Essential for complex panels (>3 colors); critical for dim markers and rare populations. |
| Isotype Control | Assess non-specific antibody binding (Fc receptor, etc.) [85]. | Verify antibody specificity and check for non-specific binding to the plate or sample components. | Must be perfectly matched to the primary antibody. Not for setting positivity gates [85]. |
| Viability Control | Identify and exclude dead cells to avoid autofluorescence and non-specific binding [85] [86]. | Ensure measured signal comes from live cells in cell-based assays; pre-assay viability assessment. | Choice of dye (membrane integrity vs. metabolic activity) depends on fixation and staining protocol. |
Table 2: Common Viability Dyes for Flow Cytometry
| Viability Dye | Principle of Action | Compatibility with Fixation | Excitation Laser |
|---|---|---|---|
| 7-AAD | Binds DNA in dead cells with compromised membranes. | Not suitable for fixed cells. | 488 nm, 635 nm |
| Propidium Iodide (PI) | Binds DNA in dead cells with compromised membranes. | Not suitable for fixed cells. | 488 nm, 532 nm |
| DAPI | Binds DNA in dead cells with compromised membranes. | Compatible with fixation. | 355 nm, 405 nm |
| Calcein AM | Converted to fluorescent calcein by esterases in live cells. | Cells can be fixed after staining. | 488 nm |
Experimental Protocols
Protocol: Implementing FMO Controls in Flow Cytometry
- Panel Design: For an N-color antibody panel, prepare one FMO control for each fluorescence channel where accurate gating is critical. This is especially important for dimly expressed markers and channels with significant spillover from bright fluorophores.
- Sample Preparation: Aliquot an equal volume of your single-cell suspension into a separate tube for each FMO control.
- Staining: To the FMO control tube, add all antibodies from your panel except for the one targeted by the control. For example, for a FITC FMO control, add all antibodies except the FITC-conjugated one.
- Data Acquisition: Run the FMO control samples on the flow cytometer using the same instrument settings as your fully stained experimental samples.
- Gating Strategy: When analyzing data, use the FMO control to set the negative-positive boundary for the omitted fluorophore. This gate should then be applied to the fully stained sample to accurately identify the positive population [85].
Protocol: Implementing Isotype Controls
For Flow Cytometry:
- Selection: Choose an isotype control that is matched to your primary antibody (same species, immunoglobulin class, subclass, and fluorophore conjugation).
- Staining: Stain a sample of your cells with the isotype control antibody, using the same concentration and incubation conditions as your primary antibody.
- Analysis: Analyze the isotype-stained sample to establish the level of background fluorescence. The signal from your specific antibody staining should be significantly brighter (a distinct shift in fluorescence intensity) than the signal from the isotype control.
For ELISA (Sandwich Format):
- Plate Coating: Coat one well with your specific capture antibody and another well with the matched isotype control antibody at the same concentration.
- Assay Procedure: Proceed with the rest of the ELISA protocol (blocking, sample addition, detection antibody, substrate) as usual.
- Interpretation: The signal in the isotype control well should be close to the background level (e.g., blank or negative control). A high signal in the isotype control well indicates significant non-specific binding.
Protocol: Implementing Viability Staining in Flow Cytometry
- Dye Selection: Choose a viability dye compatible with your assay. For example, 7-AAD or PI are common for unfixed cells, while DAPI can be used for fixed cells.
- Staining (for 7-AAD): After surface antibody staining, add 7-AAD to the cell suspension (e.g., 5-20 µL per test) and incubate for 5-20 minutes on ice, protected from light.
- Acquisition: Run the sample on the flow cytometer within a short time frame (e.g., 1 hour) to prevent loss of dye exclusion in live cells.
- Gating: Create a plot of the viability dye channel vs. a cellular marker (e.g., FSC). Gate out the viability dye-positive population (dead cells) to focus the analysis on the live cell population.
Workflow and Logical Relationships
The following diagram illustrates the logical decision-making process for incorporating these critical controls into experimental designs for flow cytometry and ELISA.
The Scientist's Toolkit: Essential Research Reagent Solutions
Table 3: Essential Reagents for Control Implementation
| Reagent Category | Specific Examples | Function in Controls |
|---|---|---|
| Viability Dyes | 7-AAD, Propidium Iodide, DAPI, Calcein AM | Distinguish live cells from dead cells based on membrane integrity or enzymatic activity [85] [86]. |
| Isotype Controls | Mouse IgG1, IgG2a, IgG2b; Rabbit IgG (various conjugates) | Matched negative control antibodies to measure non-specific Fc-mediated binding [85]. |
| Compensation Beads | Anti-Mouse/Rat Ig Compensation Beads | Used with single-stained samples to calculate compensation matrices for flow cytometry, a prerequisite for accurate FMO use [85]. |
| Fc Receptor Blocking Reagent | Purified anti-CD16/32, Human Fc Block | Reduces non-specific binding of antibodies to Fc receptors on immune cells, improving the specificity of both isotype and primary antibody staining [85]. |
| ELISA Control Proteins | Recombinant target protein, Isotype control protein | Serve as reliable positive and negative controls for assay validation and sample result interpretation [87]. |
Gating Strategies and Data Analysis Best Practices in Flow Cytometry
Flow cytometry serves as a cornerstone technique for dissecting heterogeneous cell populations based on physical and biochemical properties, playing an indispensable role in immunochemical research alongside methods like ELISA. Central to its analytical power is gating—a systematic process to isolate target cell populations while excluding noise from debris, dead cells, or technical artifacts. Robust gating strategies are fundamental to data accuracy, ensuring researchers can draw reliable biological conclusions from complex datasets. This guide provides comprehensive methodologies and best practices for flow cytometry gating, framed within the context of immunochemical method validation.
Core Principles of Flow Cytometry Gating
Gating operates on the principle of signal-based selection and is performed in a logical, hierarchical manner. This sequential approach progressively refines the cell population to focus on cells of interest, with each step eliminating specific confounding factors.
- Signal Foundations: As cells pass through the flow cytometer, they scatter light and emit fluorescence. Forward scatter (FSC) correlates with cell size, while side scatter (SSC) indicates granularity or internal complexity. Fluorescence signals are generated when cell-bound fluorescent markers are excited by lasers [88].
- Hierarchical Refinement: Gating begins with excluding debris and dead cells, which can be identified by their low FSC/SSC values or high fluorescence when stained with viability dyes like propidium iodide (PI) or 7-AAD [88]. Subsequent steps remove doublets or cell aggregates that can distort data analysis [88].
- Phenotype Definition: The final gating steps utilize fluorescence markers to define target phenotypes, setting thresholds based on positive and negative controls to accurately segregate subpopulations such as specific T-cell subsets (e.g., CD3+CD4+ cells) [88].
Step-by-Step Gating Workflow
Step 1: Exclude Debris and Dead Cells
The initial critical step eliminates debris and dead cells from analysis by plotting Forward Scatter Area (FSC-A) against Side Scatter Area (SSC-A). Draw a gate (typically labeled Gate P1) around the main cell population, deliberately excluding events with low FSC and SSC signals representing debris [88]. For viability staining, fluorescent dyes like propidium iodide (PI) or 7-AAD mark dead cells, which exhibit high fluorescence and can be gated out [88]. Software tools like FlowJo's "Gate Inspector" can validate gate placement, and adjusting axes to include all cells with proper margins helps minimize edge artifacts [88].
Step 2: Select Single Cells (Exclude Doublets)
After initial exclusion, the next step focuses on single cells by removing doublets or aggregates that can skew data. This is achieved by plotting FSC-A against FSC-W (width). Single cells display a linear relationship between total signal (FSC-A) and signal width (FSC-W), while doublets or clumped cells appear as outliers due to increased width [88]. Draw Gate P2 around the linear cluster representing single cells. For DNA analysis like cell cycle studies, a plot of PI-W versus PI-A provides more refined exclusion of aggregates [88].
Step 3: Define Target Phenotype
The final analytical step delineates target cell populations using specific fluorescence markers. For T-cell subset analysis, use a fluorescence scatter plot of FITC versus PE to differentiate between markers like CD3 and CD4 [88]. Set thresholds using unstained (negative control) and single-stained (positive control) samples to establish accurate boundaries. Quadrant or contour gating provides clear separation; for dense samples, contour plots often help align quadrant lines with natural gaps between cell populations [88]. Employ Fluorescence Minus One (FMO) controls in multicolor experiments to resolve ambiguous populations, ensuring defined target phenotypes are accurate and reproducible [88] [89].
Advanced Gating Techniques for Data Accuracy
Boolean and Backgating
- Boolean Logic: Combine multiple gates using logical operators (e.g., "CD3+ AND CD4+ AND NOT PI+") to isolate highly specific subsets while excluding dead or unwanted cells [88].
- Backgating: Validate gating accuracy by overlaying gated populations (e.g., CD4+ T cells) onto FSC vs. SSC plots to confirm alignment with expected size and granularity [88]. This technique, applied at the end of analysis, helps identify if cells are being missed by previous gating strategies [90].
Time Gating for Flow Stability
Plot events against time to identify and exclude periods of unstable flow caused by clogs, back-pressure, or instrument startup. This ensures analysis focuses only on data collected during stable operation [91]. Automated tools like the R package "flowClean" can perform this process in an unbiased manner [90].
Viability and Dump Channels
Incorporate viability dyes to eliminate dead cells that non-specifically bind antibodies. Use a "dump channel" containing antibodies against lineages not of interest (e.g., for T-cell analysis, include B-cell, macrophage, and monocyte markers) to exclude these cells from analysis [91] [90].
Table 1: Essential Gating Steps and Their Functions
| Gating Step | Primary Function | Key Parameters | Common Controls |
|---|---|---|---|
| Flow Stability Gate | Remove data from unstable flow periods | Time vs. FSC/SSC | Visual inspection of flow rate |
| Singlets Gate | Exclude doublets/cell aggregates | FSC-A vs. FSC-W or SSC-A vs. SSC-W | Pulse geometry analysis |
| Viability Gate | Eliminate dead cells | Viability dye fluorescence | Unstained cells |
| Phenotype Gate | Identify target cell population | Fluorescence markers (CD3, CD4, etc.) | FMO controls, isotype controls |
| Backgating | Verify gating accuracy | FSC vs. SSC of gated population | Comparison to original scatter |
Application-Specific Gating Strategies
Immunophenotyping
Objective: Identify and quantify immune cell subsets (e.g., T cells, B cells, NK cells) [88].
Key Markers:
- CD45 vs. SSC: Gate leukocytes (CD45+) while excluding red blood cells and debris [88]
- Lineage-specific markers: T cells (CD3, CD4, CD8), B cells (CD19, CD20) [88]
Workflow:
- Leukocyte Gating: Use CD45 vs. SSC to isolate all nucleated hematopoietic cells, adjusting compensation to avoid spillover from bright markers [88].
- Subset Identification: Gate CD3+ cells for T cells, then subdivide into CD4+ (helper) and CD8+ (cytotoxic) populations [88].
- Exclusion Gates: Use "NOT" gates to exclude dead cells (e.g., PI+) or irrelevant lineages (e.g., CD19- for T-cell analysis) [88].
Cell Cycle Analysis
Objective: Quantify cells in G0/G1, S, and G2/M phases based on DNA content [88].
Key Parameters:
- PI-A (Propidium Iodide-Area): Measures total DNA content [88]
- PI-W (Propidium Iodide-Width): Discriminates cell doublets from single cells [88]
Workflow:
- Debris Exclusion: Gate on intact cells using FSC vs. SSC to exclude debris and apoptotic bodies [88].
- Doublet Exclusion: Plot PI-W vs. PI-A to eliminate cell doublets, which show higher PI-W values than single cells [88].
- DNA Content Analysis: Analyze the PI-A histogram to quantify phases: G0/G1 (single peak, 2N DNA), S phase (intermediate DNA content), and G2/M (second peak, 4N DNA) [88].
Apoptosis and Viability Assays
Objective: Distinguish live, apoptotic, and dead cells [88].
Key Markers:
- Viability: PI or 7-AAD [88]
- Apoptosis: Annexin V (binds phosphatidylserine exposed on apoptotic cells) [88]
Workflow:
- Debris Exclusion: Gate on intact cells using FSC vs. SSC [88].
- Viability Gating: Identify live cells (PI-/7-AAD-) and dead cells (PI+/7-AAD+) [88].
- Apoptosis Staging: Plot Annexin V vs. PI to distinguish early apoptotic (Annexin V+/PI-) and late apoptotic/necrotic (Annexin V+/PI+) cells [88].
Experimental Protocols and Methodologies
Protocol: Flow Cytometry for Cytokine Detection
Sample Preparation:
- Collect blood samples in EDTA tubes and serum separation tubes [92]
- Centrifuge at 2000×g for 10 minutes at 4°C [92]
- Store aliquots at -40°C until analysis [92]
Staining Procedure:
- Use BD CBA Flex Set System with BD Human Soluble Protein Master Buffer Kit for simultaneous measurement of multiple cytokines [92]
- Incubate capture beads with recombinant standards or test samples to form sandwich complexes [92]
- Add phycoerythrin (PE)-conjugated detection antibodies [92]
- Analyze using flow cytometry with appropriate fluorescence channels [92]
Controls: Include unstained cells, single-stained controls for compensation, and FMO controls for gate setting [88] [89].
Protocol: Comparison with ELISA Methodology
When comparing flow cytometry with ELISA for cytokine measurement (IL-1β, IL-6, TNF-α):
- Use regression analysis and Bland-Altman plots for method comparison [92]
- Account for flow cytometry's higher sensitivity in experimental design [92]
- Note that compatibility between methods varies by cytokine, with better agreement for IL-6 than TNF-α [92]
Table 2: Research Reagent Solutions for Flow Cytometry
| Reagent Type | Specific Examples | Function in Experiment |
|---|---|---|
| Viability Dyes | Propidium Iodide (PI), 7-AAD | Identify and exclude dead cells from analysis |
| Antibody Panels | CD3, CD4, CD8, CD19, CD45 | Identify specific cell populations and subsets |
| Cell Cycle Stains | Propidium Iodide (PI) | Measure DNA content for cell cycle analysis |
| Apoptosis Markers | Annexin V | Detect phosphatidylserine exposure on apoptotic cells |
| Compensation Beads | Single-stained beads | Calculate compensation matrices for fluorescence overlap |
| Lysing Solutions | Ammonium chloride, commercial lysing solutions | Remove red blood cells from whole blood samples |
Common Errors and Troubleshooting
Table 3: Common Gating Errors and Solutions
| Error | Impact on Data | Solution |
|---|---|---|
| Over-gating | Excessive cell loss leading to non-representative populations | Use backgating to verify population distribution; maintain generous initial gates [88] |
| Inadequate compensation | False positive signals due to fluorescence spillover | Recalibrate compensation with single-stained controls [88] |
| Failure to exclude doublets | Inaccurate population statistics | Strictly apply FSC-A vs. FSC-W or PI-W vs. PI-A gating [88] |
| Inconsistent gating across samples | Reduced reproducibility | Use FMO controls and align gates using biological references [88] |
| Ignoring flow instability | Introduction of acquisition artifacts | Implement time gating to exclude unstable flow periods [91] |
Data Visualization and Interpretation
Flow Cytometry Data Plots
- Histograms: Display single-parameter data, typically with signal intensity on the x-axis and cell count on the y-axis. Shifts in peaks indicate changes in fluorescence intensity and marker expression [35] [65].
- Scatter Plots: Present multiparameter data, with each event mapped based on two parameters. Dot plots, density plots, and contour plots are variants that help visualize population distributions [35] [65].
- Quadrant Gates: Divide scatter plots into four regions based on positive/negative expression of two markers, enabling identification of single-positive, double-positive, and double-negative populations [65].
Statistical Analysis
- Percentage Calculation: When gating hierarchically, calculate the percentage of parent populations and back-calculate to total population percentages [65].
- Mean Fluorescence Intensity (MFI): Measures antigen density on cells, providing quantitative data beyond mere positive/negative classification [65].
- Statistical Comparison: Use appropriate tests (t-tests, ANOVA) to compare population percentages or MFI between experimental conditions.
Visualizing Gating Strategies
Diagram 1: Hierarchical Gating Workflow
Diagram 2: Experimental Design and Controls
Effective gating strategies form the foundation of accurate flow cytometry data analysis within the broader context of immunochemical methods. By implementing a systematic, hierarchical approach to gating—incorporating debris exclusion, singlet selection, viability staining, and appropriate controls—researchers can ensure the reliability and reproducibility of their findings. The integration of advanced techniques like Boolean gating, backgating, and careful compensation further enhances data quality. When properly executed, these gating strategies enable researchers to extract meaningful biological insights from complex datasets, advancing both basic research and drug development applications.
Assay validation is the cornerstone of reliable scientific research and robust drug development, providing the objective evidence that a method consistently fulfills the requirements for its specific intended use [93]. In the fields of immunochemistry and flow cytometry, validation transforms a laboratory protocol from a simple procedure into a trusted tool for critical decision-making. The core philosophy of validation is that its rigor must be commensurate with the application; a method used for early-stage research requires a different level of validation than one employed in a clinical trial or for patient diagnostics [93]. This guide focuses on the essential performance characteristics—precision, sensitivity, and linearity—that form the foundation of a robust assay, whether it is used to quantify a soluble analyte via ELISA or to characterize cellular populations via flow cytometry.
The fundamental principles of validation are universal, yet the technical approaches differ significantly between methods. Traditional immunoassays like ELISA rely on a calibration curve derived from known standard concentrations to quantify an unknown sample [94] [68]. In contrast, flow cytometry assays are often qualitative or semi-quantitative, characterizing cells based on relative fluorescence intensity and physical properties without a true standard curve, which introduces unique validation challenges [95] [96]. Understanding these distinctions is critical for applying the correct validation strategy to ensure data integrity across different technological platforms.
Core Validation Parameters
Precision
Precision measures the closeness of agreement between independent test results obtained under stipulated conditions [93]. It demonstrates the reproducibility of your assay and is typically broken down into two key components: intra-assay precision (repeatability) and inter-assay precision (intermediate precision). For ELISA methods, a coefficient of variation (% CV) of less than 10% is generally considered acceptable for both intra- and inter-assay precision [94]. In flow cytometry, while universal CV targets are less defined, the principle of demonstrating consistency across expected variables remains paramount [96].
- Intra-Assay Precision (Repeatability): This assesses the well-to-well variability within a single assay plate or run. It is determined by testing multiple replicates of the same sample (e.g., 14 replicates of three different samples) in the same run and calculating the mean, standard deviation, and % CV [94]. A low % CV indicates good reproducibility within an assay.
- Inter-Assay Precision (Intermediate Precision): This evaluates the reproducibility of results across different assay runs performed on different days, potentially by different operators, or using different reagent lots. It is validated by testing the same samples over multiple independent assays (e.g., 36 times over several days) [94]. A % CV of less than 10% ensures results are consistent over time and between kits.
Table 1: Example Precision Data from ELISA Kit Validation
| Parameter | Sample 1 | Sample 2 | Sample 3 | Acceptance Criteria |
|---|---|---|---|---|
| Intra-Assay Example (VCAM-1 Human ELISA) [94] | ||||
| Mean (ng/mL) | 1.23 | 4.33 | 18.59 | |
| Standard Deviation | 0.06 | 0.33 | 1.43 | |
| Coefficient of Variation (% CV) | 4.85 | 7.62 | 7.68 | <10% |
| Inter-Assay Example (Amyloid beta 42 Human ELISA) [94] | ||||
| Mean (ng/mL) | 71.30 | 40.16 | 21.29 | |
| Standard Deviation | 5.24 | 3.96 | 1.13 | |
| Coefficient of Variation (% CV) | 7.36 | 9.85 | 5.32 | <10% |
Sensitivity
Sensitivity defines the lowest level of an analyte that an assay can reliably detect. It is crucial for measuring low-abundance biomarkers. Two key concepts must be distinguished [97]:
- Analytical Sensitivity (Limit of Detection, LOD): The lowest concentration that can be statistically distinguished from a blank sample (zero standard). It is often calculated as the mean optical density (O.D.) of the zero standard plus two standard deviations [94] [97]. For example, an ELISA kit for Tau protein may report a sensitivity of <10 pg/mL [94].
- Functional Sensitivity (Lower Limit of Quantitation, LLOQ): The lowest analyte concentration that can be quantitatively measured with acceptable precision and accuracy (typically a % CV <20%) [97] [93]. This is the practical limit for reliable quantification in your experiments.
Linearity and Parallelism
Linearity and parallelism are critical parameters that confirm an assay's accuracy across different sample dilutions and its compatibility with complex biological matrices.
Linearity of Dilution: This confirms that serial dilutions of a sample yield measured concentrations that are linearly proportional to the expected values. A well-developed assay will accurately quantify the analyte at any dilution within its dynamic range. It is calculated as: % Linearity = (Measured Concentration / Expected Concentration) x 100. Results between 70–130% are generally considered acceptable [94]. This ensures that samples with high analyte concentrations can be diluted to fall within the assay's working range without losing accuracy.
Parallelism: This validation confirms that the recombinant protein standard used to generate the calibration curve behaves identically to the endogenous, native protein found in your biological samples (e.g., serum, plasma, cell lysates) [94] [93]. It is tested by serially diluting a natural sample and comparing the resulting dose-response curve to the standard curve. If the curves are parallel, it indicates the assay recognizes the native analyte in the same manner as the standard, giving confidence in the quantitation of real-world samples [94].
Table 2: Example Linearity of Dilution Data from a c-Myc Human ELISA Kit [94]
| Dilution | Measured (pg/mL) | Expected (pg/mL) | % Linearity |
|---|---|---|---|
| 1/10 | 372.3 | 372.3 | 100 |
| 1/20 | 205.7 | 186.14 | 111 |
| 1/40 | 117.2 | 93.1 | 126 |
| 1/80 | 56.0 | 46.54 | 120 |
| 1/160 | 25.8 | 23.3 | 111 |
| 1/320 | 8.8 | 11.6 | 76 |
Method-Specific Validation Approaches
Immunoassay (ELISA) Validation
ELISA validation follows a well-established framework for quantifying soluble analytes. Beyond precision, sensitivity, and linearity, several other parameters are essential for a complete validation.
- Accuracy/Recovery: This determines if sample matrices (e.g., serum components) interfere with analyte detection. It is tested by spiking a known amount of the purified target protein into the biological matrix and measuring the recovery percentage. An average recovery of 80–120% is typically considered acceptable, indicating minimal matrix interference [94] [97].
- Specificity: This verifies that the assay detects only the analyte of interest and does not cross-react with other similar molecules. It is validated by screening a panel of related substances (e.g., cytokines from the same family) to confirm a lack of cross-reactivity, which prevents false positive results [94].
- Robustness: This evaluates the ability of the assay to remain unaffected by small, deliberate variations in method parameters (e.g., incubation time, temperature). A robust assay will produce consistent results even with minor deviations from the protocol [93].
Flow Cytometry Assay Validation
Flow cytometry validation presents unique challenges because the data are often not derived from a calibration curve, and true reference standards for cellular analytes are frequently lacking [96]. The CLSI H62 guideline provides the first dedicated framework for validating these cell-based assays [95] [96].
- Pre-Analytical Phase: This foundational stage includes instrument qualification (ensuring the cytometer is performing within specified parameters), reagent optimization (titrating antibodies to determine optimal signal-to-noise ratios), and defining sample requirements (anticoagulant, stability, processing) [96]. For example, a validated basophil degranulation assay must specify the required sample type and handling procedures to ensure reliable CD63 measurement [98].
- Analytical Validation: This phase focuses on the assay's performance itself.
- Precision: Similar to ELISA, this involves demonstrating reproducibility in cell population percentages and fluorescence intensities across replicates, runs, and operators [96].
- Accuracy/Specificity: This is often established by using well-characterized cell lines or clinical samples to confirm that the assay correctly identifies the target cell population. Specificity is demonstrated through careful antibody panel design and the use of appropriate fluorescence-minus-one (FMO) controls.
- Assay Sensitivity: In flow cytometry, this can refer to the lowest frequency of a rare cell population that can be reliably detected, or the minimum difference in antigen density that can be resolved [96].
- Post-Analytical Phase: This involves establishing procedures for data review, gating strategies, reporting, and data storage to ensure consistency and compliance [96].
Experimental Protocols for Key Validation Experiments
Protocol for Determining ELISA Precision
This protocol outlines the steps to determine both intra-assay and inter-assay precision for an ELISA.
- Sample Preparation: Prepare at least three samples with analyte concentrations spanning the dynamic range of the assay (low, medium, and high) [94].
- Intra-Assay Precision:
- Inter-Assay Precision:
Protocol for Assessing Dilutional Linearity and Parallelism
This procedure tests whether sample dilution yields proportional results and if the standard curve mirrors native protein behavior.
- Sample Selection: Choose a natural sample (e.g., serum, cell lysate) with a high endogenous concentration of the analyte or spike a sample with a known amount of recombinant protein [94] [93].
- Serial Dilution: Create a series of dilutions (e.g., 1:10, 1:20, 1:40, etc.) of this sample using the assay's standard dilution buffer. Ensure the dilutions cover the entire dynamic range of the assay [94].
- Assay Execution: Run the diluted samples alongside the standard curve in the same ELISA plate.
- Data Analysis:
- Linearity: For each dilution, calculate the % Linearity as (Measured Concentration / Expected Concentration) x 100. Results should fall within 70-130% [94].
- Parallelism: Plot the measured concentrations of the diluted natural sample against the dilution factor. Superimpose the standard curve. The two curves should be parallel, indicating similar immunoreactivity [94].
The Scientist's Toolkit: Essential Research Reagent Solutions
Table 3: Key Reagents and Materials for Immunoassay and Flow Cytometry Work
| Item | Function | Key Considerations |
|---|---|---|
| Coated Microplates | Solid phase for antigen-antibody binding in ELISA [68]. | Polystyrene or polyvinyl; pre-coated with capture antibody for convenience and reproducibility. |
| Matched Antibody Pairs | Capture and detection antibodies for sandwich ELISA [97]. | High affinity and specificity are critical for assay sensitivity and minimal cross-reactivity. |
| Enzyme Conjugates & Substrates | Generate detectable signal (colorimetric, chemiluminescent) in ELISA [68]. | HRP/TMB is a common combination. Sensitivity can vary with substrate type. |
| Reference Standards & Controls | Calibrate the assay and monitor performance across runs [94]. | Calibrated to international standards (e.g., NIBSC) for consistent quantitation [94]. |
| Flow Cytometry Antibody Panels | Identify and characterize specific cell populations. | Require careful titration and compensation controls; validation is panel-specific [96]. |
| Cell Staining Buffer | Medium for antibody incubation in flow cytometry. | Contains proteins (e.g., BSA) to block non-specific binding and preserve cell viability. |
| Instrument QC Beads | Daily monitoring of flow cytometer performance [96]. | Used to standardize photomultiplier tube (PMT) voltages and track laser alignment over time. |
A rigorous and methodical approach to assay validation is non-negotiable for generating reliable, reproducible, and scientifically defensible data in both immunochemistry and flow cytometry. By systematically establishing performance characteristics like precision, sensitivity, and linearity, researchers and drug development professionals can have full confidence in their results. This guide provides a framework, but it is crucial to remember that the "perfect" validation is defined by the assay's intended use. As technologies evolve and regulatory landscapes shift, the principles outlined here will continue to serve as the foundation for robust scientific inquiry and successful therapeutic development.
Strategic Selection: Validating Assays and Choosing the Right Technique for Your Research
Within the fields of immunology, molecular biology, and drug development, the selection of an appropriate immunochemical method is paramount to the success of research and diagnostic endeavors. Two cornerstone techniques in the scientist's toolkit are the Enzyme-Linked Immunosorbent Assay (ELISA) and Flow Cytometry. While both leverage the specific binding of antibodies to their target antigens, they are designed to answer fundamentally different biological questions. This guide provides an in-depth, side-by-side technical analysis of ELISA and Flow Cytometry, framing their capabilities within the broader context of immunochemical research. By comparing their principles, applications, and methodological workflows, this document aims to equip researchers, scientists, and drug development professionals with the knowledge to make an informed choice tailored to their specific experimental objectives.
Core Principles and Technical Specifications
ELISA and flow cytometry are both powerful immunoassays but are grounded in distinct operational principles, leading to divergent strengths and applications. Understanding these core mechanisms is the first step in selecting the right tool for your research.
ELISA is a plate-based assay technique designed for detecting and quantifying soluble analytes—such as peptides, proteins, antibodies, and hormones—within a sample. In an ELISA, the target substance is typically captured by a specific antibody immobilized on a multi-well plate. Detection is achieved via enzyme-linked antibodies that produce a measurable colorimetric, chemiluminescent, or fluorescent signal, the intensity of which is proportional to the amount of analyte present [20] [99]. Its design is optimal for high-throughput quantification of specific molecules in solution.
Flow Cytometry, in contrast, is a technology that provides rapid multi-parametric analysis of single cells in suspension. Cells are hydrodynamically focused to pass single-file through one or more lasers. As each cell intersects the laser beam, it scatters light and any bound fluorescent antibodies emit light at specific wavelengths. These signals are detected by photomultiplier tubes, allowing for the simultaneous measurement of multiple characteristics—such as cell surface and intracellular markers—for thousands of individual cells per second [32] [100]. A key advantage is its ability to analyze complex cell populations and isolate specific subsets via fluorescence-activated cell sorting (FACS) [20].
Table 1: Core Technical Specifications of ELISA and Flow Cytometry
| Parameter | ELISA | Flow Cytometry |
|---|---|---|
| Primary Principle | Microplate-based quantification of soluble analytes [99] | Cell-by-cell analysis in a fluid stream using light scattering and fluorescence [32] |
| What is Measured | Concentration of a specific target molecule (e.g., cytokine, antibody) [20] | Multiple physical & chemical characteristics per cell (size, granularity, marker expression) [20] [32] |
| Sample Type | Serum, plasma, cell culture supernatant, lysates [17] [99] | Live or fixed cell suspensions (from blood, tissue, culture) [17] [100] |
| Throughput | High (96- to 384-well plates, automated processing) [17] [99] | Moderate to High (thousands of cells/second, but sample preparation can be complex) [17] [100] |
| Sensitivity | High (detection in pg–ng/mL range) [20] [17] | Very High (single-cell level detection) [17] |
| Multiplexing Capability | Typically single-plex; bead-based arrays allow for multiplexing [101] [99] | Inherently multi-parameter (simultaneous detection of 5-20+ markers) [20] [32] |
| Key Output | Quantitative concentration of an analyte [99] | Quantitative population statistics, frequency, and protein density per cell [100] |
Comparative Analysis: Strengths, Limitations, and Applications
The choice between ELISA and flow cytometry is not a matter of which is superior, but rather which is optimal for a given research question. This decision is guided by balancing their respective strengths and limitations against experimental goals.
Advantages and Disadvantages
ELISA is celebrated for its simplicity, robustness, and cost-effectiveness, especially when processing large sample batches [20]. It provides highly sensitive, quantitative data on analyte concentration and is well-suited for automation. However, a significant limitation is its lack of cellular context; it can quantify a cytokine in a supernatant but cannot identify which specific cell type produced it [20]. Furthermore, it is generally a fixed-parameter assay, meaning once it is set up for one molecule, it cannot be altered to detect another without establishing a new test [20].
Flow Cytometry's principal strength lies in its multi-parameter analysis at the single-cell level within a heterogeneous population [20] [100]. This is invaluable in immunology for identifying rare cell populations or characterizing complex activation states. It can also be coupled with cell sorting (FACS) to purify populations for downstream analysis. The main drawbacks are its complexity, higher cost for instrumentation and maintenance, and the requirement for considerable expertise to design multi-color panels and interpret the resulting data [20] [15].
Application Scenarios
- Use ELISA When: Your primary need is the quantification of a specific soluble protein or antibody in a solution like serum, plasma, or culture medium [20] [17]. It is the go-to technique for high-throughput screening of hybridoma clones, measuring antibody titers in serum, and clinical diagnostics for detecting circulating biomarkers [17] [99].
- Use Flow Cytometry When: You need to analyze cell surface or intracellular markers at a single-cell level [17]. It is indispensable for immunophenotyping (e.g., identifying CD4+ and CD8+ T-cells), analyzing cell cycle status, monitoring intracellular signaling pathways (e.g., phosphorylation), and conducting functional assays like cytokine intracellular staining [17] [100].
Experimental Protocols and Workflows
A clear understanding of the methodological workflow for each technique is crucial for proper experimental planning and execution. The following diagrams and protocols outline the key steps involved.
ELISA Workflow
The following diagram illustrates the generalized steps for a sandwich ELISA, one of the most common and specific formats.
Diagram 1: Generalized workflow for a sandwich ELISA, involving sequential binding and signal generation steps.
A typical sandwich ELISA protocol involves the following key steps [99]:
- Coating: A capture antibody specific to the target analyte is immobilized onto a polystyrene microplate well through incubation.
- Blocking: The well is treated with a protein-based buffer (e.g., BSA) to cover any remaining protein-binding sites on the plastic, thereby minimizing non-specific binding of other proteins in subsequent steps.
- Sample Incubation: The test sample (e.g., serum, supernatant) is added. If the target antigen is present, it will bind to the captured antibody. The plate is then washed to remove unbound material.
- Detection Antibody Incubation: A second, enzyme-conjugated antibody specific to a different epitope on the target antigen is added, forming an antibody-antigen-antibody "sandwich." Another wash removes unbound detection antibody.
- Signal Development: A substrate solution for the enzyme (e.g., TMB for HRP) is added. The enzyme catalyzes a reaction that produces a color change.
- Signal Measurement & Analysis: The reaction is stopped, and the absorbance of the solution is measured with a plate reader. The absorbance is proportional to the amount of antigen in the sample, and a standard curve is used to determine the exact concentration [99].
Flow Cytometry Workflow
The workflow for a typical flow cytometry experiment, from sample preparation to data analysis, is outlined below.
Diagram 2: Core steps in a flow cytometry experiment, focusing on cell preparation and instrument analysis.
A standard flow cytometry protocol for cell surface markers includes [100]:
- Sample Preparation: Creation of a high-quality single-cell suspension from blood, tissue, or cultured cells. Passing the sample through a cell strainer is recommended to prevent clogs in the instrument.
- Staining: Cells are incubated with fluorophore-conjugated antibodies targeting specific cell markers. Fc receptor blocking is often performed beforehand to reduce non-specific antibody binding.
- Washing and Resuspension: Unbound antibodies are removed by centrifugation and washing. The cell pellet is resuspended in an appropriate buffer for analysis on the cytometer.
- Acquisition: The cell suspension is introduced into the flow cytometer. Sheath fluid focuses the cells into a single-file stream, which passes through the laser interrogation point. Light scatter (FSC for size, SSC for granularity) and fluorescence signals from each cell are collected by detectors [32] [100].
- Data Analysis: The electronic signals are compiled into data files. Using analysis software, researchers sequentially "gate" on cell populations based on light scatter and fluorescence to identify and quantify specific cell types of interest.
The Scientist's Toolkit: Essential Research Reagent Solutions
The reliability of both ELISA and flow cytometry is heavily dependent on the quality and appropriateness of the reagents used. Below is a table of essential materials and their functions.
Table 2: Key Research Reagents and Their Functions in ELISA and Flow Cytometry
| Reagent / Material | Function | Application Notes |
|---|---|---|
| Capture Antibody | Binds and immobilizes the target analyte onto the solid phase (plate or bead) [99] | In sandwich ELISA, must be specific and paired with a matched detection antibody [99]. |
| Detection Antibody | Binds the captured analyte and facilitates signal generation [99] | Conjugated to an enzyme (HRP, AP) for ELISA or a fluorophore (FITC, PE) for flow cytometry [99] [32]. |
| Fluorophore-Conjugated Antibodies | Tag specific cellular markers for detection by the flow cytometer's lasers and detectors [32] [100] | Critical for panel design; fluorophores must be compatible with instrument lasers and minimize spectral overlap [100]. |
| Blocking Buffer (e.g., BSA) | Prevents non-specific binding of antibodies to the assay surface or to cells [99] [100] | Essential for reducing background noise in both techniques. |
| Enzyme Substrate (TMB, pNPP) | Converted by the detection enzyme into a colored, fluorescent, or luminescent product [99] | The choice depends on the enzyme (HRP/AP) and the required sensitivity for the ELISA. |
| Cell Staining Buffer | Provides an optimal ionic and protein environment for antibody binding to cells in suspension [100] | Often contains salts, proteins, and sometimes sodium azide. |
| Fixation/Permeabilization Buffer | Preserves cell structure and creates pores in the membrane, allowing antibodies to access intracellular targets [100] [102] | Required for flow cytometry analysis of intracellular cytokines or nuclear proteins. |
ELISA and flow cytometry are complementary pillars of modern immunochemical research. ELISA stands out as the premier tool for sensitive, quantitative, and high-throughput measurement of soluble analytes. In contrast, flow cytometry offers an unparalleled capacity for multi-parameter, single-cell analysis within complex populations, providing rich data on cellular heterogeneity. The decision between them is not one of quality but of objective. Researchers must align their choice with the core of their biological question: is the goal to quantify a molecule in solution or to characterize the cells that produce and express it? By understanding the distinct capabilities, workflows, and reagent requirements of each method outlined in this guide, scientists can strategically deploy these powerful techniques to advance research and drug development projects with confidence and precision.
Assay validation serves as the cornerstone of reliable and reproducible data in biomedical research and drug development. For immunochemical methods such as ELISA and flow cytometry, a rigorous validation process demonstrates that an analytical method is suitable for its intended purpose, providing confidence in the generated data. The core parameters of precision, sensitivity, and specificity form the foundation of this process, ensuring that measurements are consistent, accurate, and specific to the target of interest. Within the context of a broader thesis on immunochemical methods, understanding these validation fundamentals is critical for researchers designing robust experimental workflows.
Regulatory bodies like the US Food and Drug Administration (FDA) and European Medicines Agency (EMA) increasingly advocate for a tailored, "fit-for-purpose" approach to assay validation, where the level of validation is aligned with the biomarker's intended clinical use rather than adhering to a one-size-fits-all method [103]. This guide examines the fundamental requirements for precision, sensitivity, and specificity during the validation of ELISA and flow cytometry assays, providing technical details, experimental protocols, and practical considerations for researchers and drug development professionals.
Core Analytical Parameters: Definitions and Requirements
Precision
Precision refers to the reproducibility and consistency of measurements when the assay is repeated multiple times on the same sample. It is typically divided into two components: intra-assay precision (within-run) and inter-assay precision (between-run) [94] [104]. Intra-assay precision is assessed by analyzing multiple replicates of the same sample within a single assay run, while inter-assay precision evaluates consistency across different runs, different days, and often different operators [104]. Precision is quantitatively expressed as the coefficient of variation (% CV), which represents the standard deviation as a percentage of the mean. For a well-validated ELISA, both intra-assay and inter-assay CVs are typically expected to be <10% [94]. In flow cytometry, precision validation must account for instrument standardization and the complexity of multiparameter analysis [105].
Sensitivity
Sensitivity defines the lowest amount of an analyte that an assay can reliably detect or quantify. It is crucial for detecting low-abundance biomarkers. Two key metrics define sensitivity:
- Limit of Detection (LOD): The lowest concentration of an analyte that can be distinguished from background noise with a certain confidence level. It is often calculated as the mean of the blank signal plus 2 or 3 standard deviations [106]. At this level, detection is qualitative.
- Limit of Quantification (LOQ): The lowest concentration at which the analyte can be quantitatively measured with acceptable precision and accuracy. The American Chemical Society defines LOQ as the mean of the blank signal plus 10 standard deviations [106]. The LOQ is also known as the functional sensitivity or lower limit of detection (LLOQ) [97].
Specificity
Specificity is the ability of an assay to detect only the intended target analyte without cross-reactivity or interference from other components in the sample matrix [97] [104]. For immunochemical methods, this primarily depends on the antibody's affinity and specificity for its target epitope. Specificity validation ensures that the antibody binds only to the target antigen and not to other similar proteins, isoforms, or post-translational modifications [104] [107]. Matrix effects, where other substances in the sample (e.g., serum, plasma) interfere with analyte detection, must also be evaluated during specificity assessment [104].
Table 1: Key Performance Parameters for Assay Validation
| Parameter | Definition | Validation Approach | Acceptance Criteria |
|---|---|---|---|
| Precision | Measure of assay reproducibility | Intra-assay: Multiple replicates in one run [94].Inter-assay: Replicates across multiple runs/days [94] [104]. | CV < 10% for both intra- and inter-assay [94]. |
| Sensitivity (LOD) | Lowest detectable analyte level | Mean of blank + 2 or 3 SD [106]. | Distinguishable from background with statistical significance. |
| Sensitivity (LOQ) | Lowest quantifiable analyte level | Mean of blank + 10 SD [106]. | Quantifiable with defined precision and accuracy. |
| Specificity | Ability to measure only the target analyte | Cross-reactivity testing with related proteins [94] [104].Peptide competition assays [107].Matrix effect evaluation [104]. | Minimal cross-reactivity; recovery of 80-120% [97] [104]. |
| Accuracy/Recovery | Closeness to true value | Spike-and-recovery experiments: known analyte amount added to matrix [94] [97]. | Typically 80-120% recovery [97]. |
| Linearity | Ability to provide results proportional to analyte concentration | Serial dilution of sample across assay range [94]. | 70-130% of expected value for each dilution [94]. |
Experimental Protocols for Validation
Protocol for Precision and Accuracy Determination
Purpose: To determine both within-run and between-run precision, as well as the accuracy of the assay via spike-and-recovery.
Materials:
- Test samples at low, medium, and high concentrations within the dynamic range
- Quality Control (QC) samples
- Assay reagents (buffers, substrates, detection antibodies)
- Microplate reader (for ELISA) or flow cytometer (for cytometry)
Procedure:
- Sample Preparation: Prepare a minimum of three samples with concentrations spanning the assay range (low, medium, high) [94] [104].
- Within-Run Precision:
- Analyze each sample in a minimum of 5-10 replicates within the same assay run [94].
- Calculate the mean, standard deviation (SD), and % CV for each sample.
- Between-Run Precision:
- Analyze the same samples in duplicate or triplicate across at least 3-6 separate assay runs performed on different days [104].
- Use the same lot of reagents to minimize variability.
- Calculate the overall mean, SD, and % CV for each sample across all runs.
- Accuracy/Recovery:
- Spike a known amount of purified target analyte into the relevant biological matrix (e.g., serum, plasma) [94] [97].
- Analyze the spiked sample and calculate the measured concentration.
- Calculate the percentage recovery as: (Measured Concentration / Expected Concentration) × 100 [97].
- Repeat this process with multiple matrices and at different concentrations.
Acceptance Criteria: Intra- and inter-assay CV <10-15% [94]; recovery of 80-120% [97] [104].
Protocol for Sensitivity Determination (LOD and LOQ)
Purpose: To establish the Limit of Detection (LOD) and Limit of Quantification (LOQ) for the assay.
Materials:
- Zero standard (blank) – matrix without the analyte
- Low concentration analyte samples
- Assay reagents
Procedure:
- LOD Determination:
- LOQ Determination:
- Analyze multiple replicates of samples with known low concentrations of the analyte.
- The LOQ is the lowest concentration at which the analyte can be measured with acceptable precision (e.g., CV ≤ 20%) and accuracy (e.g., 80-120% recovery) [106].
- Alternatively, LOQ can be calculated as: Mean OD (zero standard) + 10 × SD [106].
Acceptance Criteria: LOD should be statistically distinguishable from the blank. LOQ should have a CV ≤ 20% and recovery of 80-120%.
Protocol for Specificity and Cross-Reactivity Testing
Purpose: To verify that the assay specifically detects the target analyte without interference from similar molecules or matrix components.
Materials:
- Target antigen
- Structurally similar related proteins or analogs (for cross-reactivity)
- Different biological matrices (serum, plasma, etc.)
- Potential interfering substances
Procedure:
- Cross-Reactivity Assessment:
- Test a panel of substances closely related to the target analyte (e.g., isoforms, metabolites, proteins with similar epitopes) at high concentrations [94] [104].
- Calculate the percentage cross-reactivity as: (Concentration of target / Concentration of cross-reactant) × 100%, measured at 50% binding.
- Matrix Effect Evaluation:
- Parallelism Testing:
- Perform serial dilutions of a natural sample containing the endogenous analyte [94].
- The calculated concentration, when adjusted for dilution, should be constant across the dilutions that fall within the assay's range.
- Peptide Competition (Optional):
- Pre-incubate the antibody with the immunizing peptide (or a control peptide) before performing the assay [107].
- Binding should be significantly reduced or abolished in the presence of the specific peptide.
Acceptance Criteria: Cross-reactivity with related substances should be minimal (<1-5%). Recovery in different matrices should be 80-120% [97] [104]. The dilution curve of the natural sample should be parallel to the standard curve.
Method-Specific Considerations for ELISA and Flow Cytometry
ELISA-Specific Validation
ELISA validation requires additional parameters unique to plate-based immunoassays. Linearity of dilution confirms that serial dilutions of a sample provide proportional results, typically accepting 70-130% of the expected value [94]. Parallelism ensures that the dilution curve of a natural sample runs parallel to the standard curve, confirming that the recombinant protein standard accurately reflects the endogenous analyte's behavior [94]. The dynamic range—the span between the lowest and highest concentrations that can be quantified without sample dilution—must be validated using real samples, not just buffer-based standards [97] [106].
Flow Cytometry-Specific Validation
Flow cytometry validation presents distinct challenges due to its cellular focus and instrument complexity. Validation must include instrument standardization to ensure consistent performance over time [105]. For cellular biomarker analysis, sample handling effects (e.g., anticoagulant choice, time from collection to processing) significantly impact results [108]. Gating strategies must be rigorously validated, as inconsistent gating is a major source of variability [17]. When assessing activation-induced markers (AIM), appropriate activation controls and validated positive/negative thresholds are essential [108].
Table 2: Platform Comparison for Biomarker Analysis
| Platform | Key Advantages | Key Limitations | Best Applications | Automatability |
|---|---|---|---|---|
| ELISA | Quantitative, high specificity, established protocols, cost-effective [17] [109]. | Limited multiplexing, requires high-quality antibodies [103] [109]. | Soluble proteins, hormones, antibodies [17]. Screening many samples [17]. | High (fully automated systems available) [109]. |
| Flow Cytometry | Single-cell resolution, multi-parametric analysis, reflects native antigen structure [17]. | Requires viable cells, complex data analysis, higher instrument cost [17]. | Cell surface/intracellular markers, immune profiling, cell sorting [17]. | High (fully automated cell sorting and analysis) [109]. |
| Meso Scale Discovery (MSD) | High sensitivity, broad dynamic range, multiplexing capabilities [103] [109]. | Expensive, specialized reagents, higher sample volumes [109]. | Complex diseases, therapeutic response monitoring [103]. | High (fully automated systems available) [109]. |
| Western Blot | Confirms molecular weight, detects specific isoforms/PTMs [17]. | Denatures proteins, low throughput, not for conformational epitopes [17]. | Protein expression validation, checking cross-reactivity [17]. | Low (manual sample preparation and analysis) [109]. |
Regulatory and Practical Considerations
Regulatory Perspectives
Regulatory agencies emphasize a fit-for-purpose approach to biomarker validation, where the level of validation matches the intended use and associated regulatory status [103] [105]. The FDA and EMA demand comprehensive validation data, including enhanced analytical validity (accuracy, precision) and clinical validity (consistent correlation with clinical outcomes) [103]. A review of EMA biomarker qualification procedures revealed that 77% of challenges were linked to assay validity, with frequent issues in specificity, sensitivity, detection thresholds, and reproducibility [103]. For clinical trials, assays must be validated under Good Laboratory Practice (GLP) conditions with demonstrated transferability and reproducibility [17].
Practical Implementation and Troubleshooting
Successful assay implementation requires careful planning. Orthogonal validation—using two or more distinct methods to confirm results—is strongly recommended [17] [107]. For precision issues, standardize protocols, ensure consistent reagent quality, and maintain environmental controls [104]. For high background in ELISA, optimize blocking conditions and washing steps [104]. When sensitivity is insufficient, ensure all reagents are at room temperature before use and pipette carefully to avoid touching well bottoms [104]. For flow cytometry, rigorous instrument calibration and standardized gating strategies are essential for precision [105].
The Research Reagent Toolkit
Table 3: Essential Research Reagents and Their Functions
| Reagent/Material | Function in Validation |
|---|---|
| Capture & Detection Antibodies | Form the core of immunoassays; specificity and affinity determine assay performance [104]. |
| Antigen/Standard | Used to generate calibration curves; enables quantitative analysis [94]. |
| Biological Matrices | Serum, plasma, cell culture supernatants used to assess matrix effects and validate in relevant conditions [97]. |
| Blocking Buffers | Reduce non-specific binding to improve signal-to-noise ratio [104]. |
| Coated Microplates | Solid phase for ELISA; ensure consistent antibody binding capacity [97]. |
| Flow Cytometry Standards | Beads for instrument calibration, compensation, and standardization across runs [105]. |
| Cell Stimulation Cocktails | For activation-induced marker assays in flow cytometry; evaluate cellular responses [108]. |
| Positive/Negative Controls | Verify assay performance in each run; essential for interpreting results [104]. |
Robust validation of precision, sensitivity, and specificity forms the foundation of reliable immunochemical assays in research and drug development. As regulatory standards evolve toward more comprehensive biomarker qualification, researchers must implement rigorous, fit-for-purpose validation strategies tailored to their specific applications. By adhering to the fundamental principles and experimental protocols outlined in this guide, scientists can ensure their ELISA and flow cytometry assays generate data worthy of confidence, ultimately supporting sound scientific conclusions and advancing drug development pipelines.
Diagrams and Workflows
Assay Validation Workflow
Orthogonal Validation Strategy
The reproducibility of research utilizing immunochemical methods, particularly Enzyme-Linked Immunosorbent Assay (ELISA) and flow cytometry, is fundamentally dependent on antibody specificity. Cross-reactivity—where an antibody binds to off-target proteins sharing similar epitopes—represents a pervasive challenge that can compromise data integrity, leading to false conclusions and costly research delays [17] [110]. Studies indicate that a startling proportion of commercially available research antibodies, potentially up to 50%, fail to perform as expected, contributing significantly to the reproducibility crisis in life sciences [111] [112]. Consequently, rigorous antibody validation is not merely a best practice but an essential prerequisite for generating reliable and meaningful scientific data in drug development and basic research.
The foundation of robust antibody validation lies in understanding that an antibody's performance is inextricably linked to its application. An antibody validated for one technique, such as Western blot using denatured proteins, may perform poorly or nonspecifically in another, like flow cytometry or ELISA, where proteins are in their native conformation [113] [17]. This technical guide outlines a systematic framework for validating antibody specificity, providing detailed methodologies to address cross-reactivity and ensure reproducible results in the context of ELISA and flow cytometry research.
Understanding Antibody Cross-Reactivity
Antibody cross-reactivity occurs when an antibody directed against a specific antigen binds to a different antigen due to structural similarities in their epitopes, the specific regions recognized by the antibody [110]. This phenomenon is a major source of non-specific binding and experimental irreproducibility. The underlying cause is often sequence homology between the target protein and off-target proteins, where shared linear amino acid sequences (linear epitopes) or similar three-dimensional structural motifs (conformational epitopes) can lead to unintended antibody binding [113] [110].
The impact of undetected cross-reactivity is severe, potentially resulting in:
- False Positives: Misinterpretation of data due to signal from off-target binding [17].
- Mischaracterized Biology: Incorrect conclusions about protein expression, localization, or function [111].
- Resource Waste: Failed experiments and misguided research directions, with one source noting that over $1 billion is spent annually on research antibodies, half of which may not work as expected [112].
Core Validation Strategies for Specificity
A multi-faceted approach is crucial for confirming antibody specificity. The following strategies form the cornerstone of effective antibody validation.
Knockout (KO) Validation: The Gold Standard
Knockout validation is widely regarded as the most rigorous method for determining antibody specificity [114]. This method involves comparing signals from wild-type cell lines or tissues with those from genetically modified counterparts where the gene encoding the target protein has been deleted or inactivated.
- Principle: A specific antibody will show a significant reduction or complete absence of signal in the KO sample compared to the wild-type control. Any residual signal indicates binding to off-target proteins [114].
- Application: While commonly used for Western blot (WB) and Immunohistochemistry/Immunocytochemistry (IHC/ICC), the KO principle is equally critical for flow cytometry and ELISA. For these assays, cell lines lacking the target antigen can be used to distinguish specific from non-specific binding [114].
The diagram below illustrates the logical workflow for interpreting knockout validation results.
Genetic and Biophysical Validation Methods
Beyond KO validation, other powerful techniques provide deep insight into antibody behavior.
- Protein Microarrays: These tools assess antibody specificity on a proteome-wide scale. Thousands of purified proteins are spotted onto a slide, which is then probed with the antibody of interest. This allows for the high-throughput identification of both intended on-target binding and unintended off-target interactions across a vast array of potential cross-reactants [114].
- BLAST Analysis for Cross-Species Reactivity: For researchers needing to determine if an antibody validated for one species (e.g., human) might cross-react with another (e.g., mouse or rat), in silico analysis is a valuable first step. The Basic Local Alignment Search Tool (BLAST) can compare the immunogen sequence used to generate the antibody against the protein sequence database of the species of interest [110].
- Procedure: Copy the immunogen sequence from the antibody datasheet. Use a protein BLAST (BLASTp) tool to align it against the sequence database of your target species. An alignment score (sequence homology) of over 85% is a good indicator that cross-reactivity is likely [110]. It is critical to note that while high homology suggests potential cross-reactivity, it does not guarantee it, especially for antibodies detecting post-translational modifications like phosphorylation. Experimental confirmation is always required [110].
- Biophysical Characterization: Emerging biophysical methods provide an extra layer of validation by assessing the purity and binding characteristics of the antibody preparation itself, helping to identify issues like aggregation or poly-specificity that can lead to non-specific binding [114].
Application-Specific Validation for ELISA and Flow Cytometry
Antibody validation must be tailored to the specific immunochemical method, as sample preparation and antigen presentation differ significantly.
Validation for Sandwich ELISA
The specificity of a sandwich ELISA hinges on the precise interaction of a matched antibody pair. Validation here ensures both the capture and detection antibodies are specific for the target and do not interfere with each other.
- Epitope Binning: Ensure the capture and detection antibodies bind to non-overlapping epitopes on the target antigen to prevent steric hindrance [113].
- Cross-Reactivity Testing: Test each antibody individually against a panel of related proteins (e.g., protein family members or proteins with high sequence homology) to confirm lack of binding to non-targets [113].
- Assay Validation Parameters: Once a specific antibody pair is identified, the entire ELISA method must be validated [113].
- Precision: Measure within-run and between-run precision using multiple replicates of high and low concentration samples.
- Accuracy & Matrix Effects: Perform spike-and-recovery experiments by adding a known quantity of the pure analyte into the biological matrix (e.g., serum, plasma). Recovery should typically be between 80-120% [113].
- Linearity of Dilution: Serially dilute a sample with a high concentration of the analyte. The measured concentrations, when plotted against the dilution factor, should produce a linear curve, demonstrating that the assay accurately measures the analyte across its working range.
The workflow for developing and validating a sandwich ELISA is complex and requires multiple validation steps, as shown below.
Validation for Flow Cytometry
Flow cytometry presents unique challenges for antibody validation due to the need to detect antigens on complex, mixed cell populations in their native state.
- Use of Control Beads: Innovative bead-based assays, such as the one developed for SARS-CoV-2 serology, can quantify background noise from non-specific binding, facilitating straightforward data interpretation [29]. These multiplex bead assays allow for simultaneous detection of multiple antibody isotypes or targets with high reproducibility, demonstrating intra-assay coefficients of variation (CVs) from 3.16% to 6.71% and inter-assay CVs from 3.33% to 5.49% [29].
- Critical Gating Controls:
- Isotype Controls: Antibodies of the same isotype but irrelevant specificity, used to set a baseline for non-specific binding. While common, their utility can be limited if they do not match the concentration and fluorophore-to-protein ratio of the primary antibody.
- Fluorescence Minus One (FMO) Controls: Samples stained with all antibodies except one. These are essential for setting accurate gates in multicolor panels, especially for dim populations, as they reveal spillover spreading from other fluorochromes [115].
- Biological Controls: Known positive and negative cell populations (e.g., cell lines or primary cells with confirmed expression or lack of expression of the target) provide the most robust validation of antibody performance.
Table 1: Key Experimental Controls for Flow Cytometry Validation
| Control Type | Description | Primary Function | Limitations |
|---|---|---|---|
| Isotype Control | Same immunoglobulin class/type with irrelevant specificity. | Estimates non-specific antibody binding. | May not accurately reflect the non-specific binding of the specific primary antibody. |
| FMO Control | All fluorochrome-conjugated antibodies except one. | Sets accurate gates by revealing fluorescence spillover. | Required for each combination in a multi-color panel; can be resource-intensive. |
| Biological Control | Cell populations known to be positive or negative for the target. | Confirms antibody can distinguish true expression. | Can be difficult to obtain for some rare targets or cell types. |
Quantitative Data and Reproducibility Metrics
Robust validation is quantified through statistical measures of assay performance. The high-throughput flow cytometry array for SARS-CoV-2 antibodies exemplifies the level of reproducibility achievable with rigorous validation, as shown in the table below [29].
Table 2: Reproducibility Metrics from a Validated Bead-Based Flow Cytometry Assay [29]
| Parameter | Intra-Assay Precision (CV%) | Inter-Assay Precision (CV%) |
|---|---|---|
| IgM Detection | 3.16% - 4.85% | 3.33% - 4.12% |
| IgG Detection | 4.91% - 6.71% | 4.55% - 5.49% |
| IgA Detection | 4.22% - 5.88% | 4.01% - 4.97% |
| Overall Assay | ≤ 6.71% | ≤ 5.49% |
Successful antibody validation relies on a suite of key reagents and tools.
Table 3: Key Research Reagent Solutions for Antibody Validation
| Reagent / Tool | Function in Validation | Example Use Case |
|---|---|---|
| Knockout Cell Lines | Provides a negative control to confirm antibody specificity by lacking the target antigen. | Used in flow cytometry or WB to distinguish specific signal from background. |
| Protein Microarrays | Systematically profiles antibody specificity against thousands of human proteins. | Identifying off-target binding and confirming epitope specificity. |
| BLAST Analysis Tool | Predicts potential cross-species reactivity by comparing immunogen and target species protein sequences. | Determining if a human-validated antibody is likely to work in a mouse model. |
| Validated Antibody Pairs | Pre-validated matched antibodies for sandwich ELISA that bind distinct epitopes without interference. | Developing a robust and specific quantitative ELISA assay. |
| Multiplex Bead Panels | Enables simultaneous quantification of multiple analytes or isotypes in a single sample with internal controls. | High-throughput serological screening (e.g., IgM, IgG, IgA against a virus) [29]. |
Addressing antibody cross-reactivity through systematic validation is a non-negotiable standard for ensuring the specificity and reproducibility of research in ELISA and flow cytometry. As the field advances, the adoption of a multi-strategy approach—incorporating knockout controls, application-specific tests, and orthogonal methods—is paramount. The scientific community is moving towards stricter standards, supported by resources from organizations like The Antibody Society, which foster discussion on best practices [112]. By integrating these rigorous validation protocols, researchers and drug development professionals can generate reliable, high-quality data, thereby upholding the integrity of scientific discovery and accelerating the development of effective therapeutics.
In the fields of immunology, cell biology, and drug development, the choice of analytical technique is a critical determinant of experimental success. Among the most pivotal tools in the researcher's arsenal are the Enzyme-Linked Immunosorbent Assay (ELISA) and Flow Cytometry. While both are antibody-based detection methods, they serve distinct purposes and provide fundamentally different types of data. The selection between these techniques is not merely a matter of preference but should be a strategic decision aligned with core research objectives, sample characteristics, and practical constraints [17] [20]. This technical guide provides a structured decision framework to help researchers, scientists, and drug development professionals select the optimal method for their specific immunochemical research goals.
Misapplication of these techniques can lead to misinterpreted data, false leads, and costly delays in project timelines [17]. Studies indicate that mischaracterized antibodies, often due to poor assay selection, are a major contributor to irreproducible results in biomedical research [17]. A foundational understanding of each technology's principles, capabilities, and limitations is therefore essential for robust experimental design and data integrity.
ELISA: Soluble Molecule Quantification
ELISA is a well-established, plate-based assay designed for the detection and quantification of soluble molecules such as proteins, peptides, antibodies, and hormones. The technique relies on immobilizing the target substance on a solid surface (typically a microplate well) and using specific antibody-antigen interactions for capture and detection. The readout is an ensemble measurement, providing an average concentration for the entire sample without cellular context [20].
Key Strengths: ELISA is renowned for its simplicity, robustness, and high throughput. It is highly sensitive, capable of detecting targets in the picogram to nanogram per milliliter range, and is generally cost-effective for processing large sample batches [17] [116] [20]. Its quantitative nature makes it the gold standard for measuring analyte concentrations in solutions like serum, plasma, and cell culture supernatants [116].
Flow Cytometry: Single-Cell Multi-Parameter Analysis
Flow Cytometry is a laser-based technology that analyzes the physical and chemical characteristics of single cells or particles as they flow in a fluid stream through a beam of light. By labeling cells with fluorophore-conjugated antibodies, it can simultaneously measure multiple parameters per cell, providing a high-resolution view of complex cell populations [100] [117].
Key Strengths: The primary advantage of flow cytometry is its single-cell resolution and multi-parametric capability. It allows researchers to identify and quantify distinct cell subtypes within a heterogeneous sample, assess cell size and granularity, and analyze rare cell populations [17] [100]. Modern instruments can analyze thousands of cells per second and detect up to 20 or more markers simultaneously [100]. A related technique, Fluorescence-Activated Cell Sorting (FACS), can also physically isolate specific cell populations for downstream analysis [100].
Emerging Hybrid Technology: Flow Cytometry Multiplex Bead Arrays (FCMBA)
Flow Cytometry Multiplex Bead Array technology combines principles from both techniques. It uses color-coded microbeads, each set coated with a capture antibody for a different analyte. These beads are mixed with a sample, and the analyte is detected in a sandwich immunoassay format, similar to ELISA. The beads are then read on a flow cytometer, allowing for the simultaneous quantification of multiple analytes from a single small-volume sample [56] [57]. This approach offers a powerful compromise when multi-analyte profiling is needed from a solution sample.
Comparative Analysis: A Structured Comparison
A direct comparison of core parameters reveals the inherent trade-offs between ELISA and Flow Cytometry. The table below summarizes these key differences to provide an at-a-glance overview.
Table 1: Core Technical and Operational Differences Between ELISA and Flow Cytometry
| Parameter | ELISA | Flow Cytometry |
|---|---|---|
| Sensitivity & Detection | High sensitivity (pg–ng/mL range) for soluble proteins [17]. | Very high sensitivity at the single-cell level; can detect rare populations [17] [117]. |
| Sample Type | Serum, plasma, cell culture supernatants [17]. | Requires live or fixed cell suspensions (e.g., blood, PBMCs, cultured cells) [17] [100]. |
| Information Output | Quantitative data on total analyte concentration [17] [20]. | Multi-parameter data per cell (phenotype, size, complexity); single-cell resolution [17] [100]. |
| Throughput | High throughput (96- or 384-well plates); amenable to automation [17] [116]. | Moderate to high throughput (can analyze 10,000+ cells/second), but sample staining is often manual [17]. |
| Cost & Time Efficiency | Cost-effective for reagent and equipment; results in 2-6 hours [17]. | Higher instrument and maintenance cost; complex setup; results in minutes to hours after staining [17] [20]. |
| Multiplexing Capacity | Traditionally single-plex per well. Multiplexing requires bead-based arrays (FCMBA) [56] [57]. | High innate multiplexing capacity; can simultaneously detect 5-20+ markers on a single cell [100]. |
Decision Framework: Selecting the Right Assay
The choice between ELISA and flow cytometry should be guided by a series of strategic questions related to the primary research goal. The following diagram provides a visual roadmap for this decision-making process.
Detailed Application Scenarios
The high-level decision tree can be further refined by considering specific experimental needs:
Use ELISA When [17] [116] [20]:
- Quantifying soluble analytes is the primary goal (e.g., measuring cytokine concentration in serum or antibody titer in culture supernatant).
- Your project involves screening a large number of samples and requires a high-throughput, cost-effective method.
- You need to assess pharmacokinetic properties of a therapeutic, such as its concentration in blood over time.
- Sample is a liquid (e.g., plasma, urine), and you lack the equipment or expertise for complex cell preparation.
Use Flow Cytometry When [17] [100] [117]:
- You need to identify and characterize different cell types within a mixed population (e.g., immunophenotyping of PBMCs).
- Your research question requires analysis of cell surface markers, intracellular proteins, or post-translational modifications with single-cell resolution.
- You are studying rare cell populations or need to understand the heterogeneity of a cell sample.
- Multi-parameter data is essential (e.g., simultaneously measuring CD4, CD8, CD25, and cytokine production in T cells).
- There is a need to physically sort and isolate live cells for downstream functional assays (via FACS).
Consider Multiplex Bead Arrays (FCMBA) When [56] [57]:
- You need to quantify multiple soluble analytes simultaneously from a small-volume sample (e.g., a panel of cytokines from pediatric blood samples).
- The experimental design would benefit from a broader dynamic range than traditional ELISA.
Experimental Protocols and Methodologies
To ensure robust and reproducible results, adherence to standardized protocols is critical. Below are detailed methodologies for representative applications of each technique.
Protocol: Quantifying Cytokines by ELISA
This protocol outlines the key steps for quantifying a specific cytokine, such as TNF-α or IL-6, from a cell culture supernatant or serum sample using a sandwich ELISA [118] [116].
Table 2: Key Reagent Solutions for a Sandwich ELISA
| Reagent / Material | Function |
|---|---|
| Capture Antibody | A high-affinity antibody coated onto the microplate well to specifically immobilize the target analyte. |
| Detection Antibody | A second high-affinity antibody that binds to a different epitope on the captured analyte. It is typically biotinylated or conjugated to an enzyme. |
| Standard | A known concentration of the pure target analyte used to generate a standard curve for quantification. |
| Streptavidin-HRP | Binds to biotin on the detection antibody. The enzyme Horseradish Peroxidase (HRP) catalyzes the colorimetric reaction. |
| TMB Substrate | A chromogenic substrate (3,3',5,5'-Tetramethylbenzidine) that produces a blue color when oxidized by HRP. The reaction is stopped with acid, turning the solution yellow. |
| Microplate Reader | An instrument that measures the absorbance of the stopped reaction, which is proportional to the amount of analyte present. |
Workflow Diagram:
Detailed Steps:
- Coating: Dilute the capture antibody in a coating buffer and add it to a microplate. Incubate overnight at 4°C or for 1-2 hours at room temperature.
- Blocking: Wash the plate to remove unbound antibody. Add a blocking buffer (e.g., 1-5% BSA or non-fat dry milk in PBS) to cover all remaining protein-binding sites. Incubate for 1-2 hours.
- Sample & Standard Incubation: Wash the plate. Add serial dilutions of the standard to create a calibration curve, followed by the test samples. Incubate for 2 hours to allow the antigen to be captured.
- Detection Antibody Incubation: Wash the plate. Add the biotinylated detection antibody. Incubate for 1-2 hours.
- Enzyme Conjugate Incubation: Wash the plate. Add Streptavidin-HRP conjugate. Incubate for 30-60 minutes in the dark.
- Signal Development: Wash the plate thoroughly. Add the TMB substrate solution. Incubate in the dark for 5-30 minutes, observing for color development.
- Termination and Reading: Stop the reaction by adding a stop solution (e.g., sulfuric acid). Read the absorbance immediately at 450 nm using a microplate reader. Plot the standard curve and interpolate sample concentrations [116].
Protocol: Immunophenotyping of Human PBMCs by Flow Cytometry
This protocol describes how to characterize immune cell subsets in human peripheral blood mononuclear cells (PBMCs) by staining for cell surface markers [100] [117].
Table 3: Key Reagent Solutions for Immunophenotyping by Flow Cytometry
| Reagent / Material | Function |
|---|---|
| Fluorophore-Conjugated Antibodies | Antibodies specific to cell markers (e.g., CD3, CD4, CD8, CD19) that are tagged with fluorescent dyes (e.g., FITC, PE, PerCP). |
| Viability Dye | A dye (e.g., propidium iodide, DAPI) that distinguishes live cells from dead cells, improving data accuracy. |
| Staining Buffer | PBS-based buffer containing protein (e.g., BSA) to block non-specific antibody binding and prevent cell clumping. |
| Fc Receptor Blocking Reagent | Used to block Fc receptors on immune cells, preventing non-specific binding of antibody conjugates. |
| Flow Cytometer | The instrument that hydrodynamically focuses the cell suspension, excites the fluorophores with lasers, and detects the scattered light and fluorescence. |
Workflow Diagram:
Detailed Steps:
- Sample Preparation: Isolate PBMCs from whole blood using density gradient centrifugation (e.g., Ficoll-Paque). Resuspend the cell pellet in a cold staining buffer to create a single-cell suspension. Pass through a cell strainer if clumps are present.
- Cell Counting: Count the cells and aliquot a predetermined number of cells (e.g., 0.5-1 million) into a flow cytometry tube.
- Fc Blocking: Centrifuge the cells, remove the supernatant, and resuspend the pellet in staining buffer containing an Fc receptor blocking reagent. Incubate for 10-15 minutes on ice.
- Antibody Staining: Add a pre-optimized cocktail of fluorophore-conjugated antibodies directly to the cell suspension. Vortex gently and incubate for 20-30 minutes in the dark on ice.
- Washing: Add 2-3 mL of staining buffer to the tube, centrifuge, and carefully decant the supernatant to remove unbound antibodies. Repeat this wash step once more.
- Fixation (Optional): For cell surface staining only, cells can be fixed with a 1-4% paraformaldehyde solution to preserve the staining. Resuspend the final cell pellet in a known volume of staining buffer.
- Data Acquisition: Run the samples on the flow cytometer. Begin with unstained and single-stained controls to set up the instrument, including compensation for spectral overlap.
- Data Analysis: Use flow cytometry analysis software. First, gate on cells based on FSC (size) and SSC (granularity), exclude doublets and dead cells, and then analyze the fluorescence of the gated population to identify specific immune cell subsets [100].
ELISA and flow cytometry are complementary pillars of immunochemical analysis, each with a definitive and powerful role in biomedical research. The strategic selection between them, and potentially the use of hybrid technologies like FCMBA, is fundamental to generating high-quality, interpretable data. This decision framework underscores that there is no universal "best" assay—only the most appropriate one for a specific scientific question, sample type, and resource context.
By aligning your research goals with the intrinsic strengths of each technology as outlined in this guide, you can optimize your experimental design, ensure efficient use of resources, and accelerate progress in your research and drug development programs. A thoughtful, goal-oriented approach to assay selection is a critical component of rigorous and reproducible science.
Immunochemical methods form the cornerstone of modern bioanalysis, providing critical tools for detecting and quantifying specific molecules in complex biological systems. Among these, the Enzyme-Linked Immunosorbent Assay (ELISA) and flow cytometry have emerged as foundational technologies that support research and development across diverse fields, from basic science to clinical diagnostics. These methodologies leverage the exquisite specificity of antibody-antigen interactions to generate quantitative data on biomarkers, cellular populations, and therapeutic agents, enabling informed decision-making throughout the project lifecycle.
The journey from initial discovery screening to rigorous clinical validation represents a critical pathway in biomedical research and drug development. At each stage, technical requirements evolve, regulatory considerations intensify, and methodological stringency increases. Understanding how to appropriately implement and transition between ELISA and flow cytometry methodologies across these stages is paramount for generating reliable, reproducible, and clinically meaningful data. This guide examines the strategic application of these techniques throughout the research and development continuum, providing a framework for method selection, optimization, and validation aligned with project objectives.
Technology Comparison: ELISA versus Flow Cytometry
Fundamental Principles and Applications
ELISA operates on the principle of immobilizing antigens or antibodies on a solid surface, typically a microplate, followed by sequential binding steps that ultimately produce a measurable signal proportional to the target analyte concentration. The most robust format, sandwich ELISA, captures the antigen between two specific antibodies, providing enhanced specificity for complex matrices [81]. This method excels at soluble analyte quantification in fluids such as serum, plasma, and cell culture supernatants, making it ideal for cytokine profiling, therapeutic protein monitoring, and biomarker verification [81] [119].
Flow cytometry employs laser-based technology to analyze physical and chemical characteristics of cells or particles in suspension as they flow single-file through an optical system. By detecting light scattering and fluorescence emission from labeled antibodies bound to cellular targets, this platform enables multiparametric analysis at the single-cell level [120] [121]. This capability makes flow cytometry particularly powerful for immunophenotyping, intracellular signaling analysis, and characterizing heterogeneous cell populations based on surface and intracellular marker expression [122] [121].
Performance Characteristics and Operational Considerations
Table 1: Comparative Analysis of ELISA and Flow Cytometry Performance Characteristics
| Parameter | ELISA | Flow Cytometry |
|---|---|---|
| Sensitivity | Generally higher for soluble analytes [23] | Superior for rare cell populations [119] |
| Multiplexing Capacity | Single-analyte per well (traditional); requires multiple wells for multiple targets | High (5-40+ parameters simultaneously) [122] [121] |
| Sample Volume | Typically 50-100 μL per analyte [81] | 100-500 μL (enables multiple analyses from one sample) [120] |
| Throughput | High for sample numbers; lower for parameter numbers | Lower for sample numbers; higher for parameters per sample |
| Dynamic Range | Limited [23] | Greater [23] |
| Reproducibility | Moderate to high (CV ~10%) [31] [93] | High with proper standardization (CV ~5-8%) [23] |
| Data Complexity | Simple concentration values | High-dimensional single-cell data |
| Primary Applications | Soluble analyte quantification, antibody detection, biomarker validation [81] [31] | Cell phenotyping, intracellular signaling, rare cell detection [122] [121] |
The selection between ELISA and flow cytometry depends heavily on the biological question, sample type, and required data output. ELISA provides a straightforward solution for quantifying soluble analytes when sample volume is limited but information on multiple parameters is not required simultaneously. Flow cytometry offers unparalleled insights into cellular heterogeneity and function at the single-cell level, making it indispensable for immunology, oncology, and stem cell research [119] [121]. For cytokine analysis specifically, studies have shown that while both methods generally show good correlation for certain cytokines like IL-6, they may demonstrate greater disagreement for others such as TNF-α when assessed using statistical methods like Bland-Altman plots, highlighting the importance of method validation for specific analytes [119].
Stage-Specific Methodological Considerations
Discovery and Screening Stages
During initial discovery phases, research objectives focus on identifying potential targets, screening large compound libraries, and generating preliminary hypotheses. At this stage, methodological flexibility and throughput often take precedence over rigorous validation.
ELISA Implementation: For screening applications, traditional direct or indirect ELISA formats provide rapid results with minimal optimization [81]. Commercial kits can accelerate method establishment, though researchers should verify critical reagents and begin developing in-house standards for later stages. Key considerations include identifying appropriate sample diluents that match the biological matrix and establishing preliminary dynamic range for target analytes [81] [31].
Flow Cytometry Implementation: Discovery-stage flow cytometry focuses on panel feasibility rather than complete validation. Researchers should identify critical markers for target populations, consult literature resources such as Optimized Multicolor Immunofluorescence Panels (OMIPs), and perform basic antibody titrations to establish approximate staining conditions [122] [121]. At this stage, establishing a single-cell suspension protocol with high viability and minimal aggregation is paramount, as sample quality directly impacts data quality [121].
Integrated Workflow Diagram: The following diagram illustrates the parallel methodological pathways from discovery through validation, highlighting critical decision points and outputs at each stage.
Assay Development and Optimization
The transition from screening to robust analytical methods requires systematic optimization and characterization of both ELISA and flow cytometry assays. This stage establishes the foundation for generating reliable, reproducible data capable of supporting critical project decisions.
ELISA Optimization: Comprehensive ELISA development involves methodical optimization of each component through checkerboard titration experiments, which efficiently determine optimal concentrations for capture antibodies, detection antibodies, and samples while conserving reagents [81]. Recommended concentration ranges vary by antibody type: affinity-purified monoclonal antibodies typically require 1-12 μg/mL for coating and 0.5-5 μg/mL for detection, while polyclonal sera may need 5-15 μg/mL for coating and 1-10 μg/mL for detection [81]. Additional critical parameters include blocking buffer composition, sample dilution in appropriate matrix-matched diluents, and substrate selection based on required sensitivity [81] [31].
Flow Cytometry Optimization: Assay development for flow cytometry centers on panel design, antibody titration, and compensation controls. Antibody titration is particularly critical, as insufficient staining reagents increase non-specific binding, while excessive amounts elevate background noise and costs [122]. The optimal titer provides the highest signal-to-noise ratio, effectively distinguishing positive and negative populations [122]. For multicolor panels, combinatorial titration approaches can streamline optimization by testing multiple antibodies simultaneously without compromising data quality [122]. Researchers must also carefully consider antigen density and expression patterns when assigning fluorophores to specific markers, pairing bright fluorophores with low-abundance antigens and dimmer fluorophores with highly expressed targets [121].
Clinical Validation Stage
The clinical validation stage demands the highest level of methodological rigor, with requirements defined by regulatory agencies such as the FDA and EMA [31] [93]. At this stage, assays must demonstrate reliability, reproducibility, and accuracy under defined conditions sufficient for their intended use.
Table 2: Core Validation Parameters for Immunoassays in Clinical Applications
| Validation Parameter | ELISA Requirements | Flow Cytometry Requirements | Regulatory Significance |
|---|---|---|---|
| Precision | Intra-assay: CV <10%Inter-assay: CV <15% [31] | Intra-assay: CV <10%Inter-assay: CV <15% [93] | Ensures reproducible results across runs and operators |
| Accuracy | Recovery of 80-120% for spiked samples [31] | Comparison to reference method or quantitative standards | Verifies closeness to true value |
| Specificity | Demonstrate minimal cross-reactivity with related molecules [31] | Resolution of target populations with minimal non-specific binding | Confirms measurement of intended target only |
| Sensitivity (LLOD/LLOQ) | Determined via standard deviation of blank and curve slope [31] | Determined using isotype controls or negative populations | Defines lowest reliably detectable/quantifiable level |
| Linearity & Range | Demonstrates direct proportionality across assay range [31] | Linear fluorescence intensity across concentration/cell number | Establishes working range of assay |
| Robustness | Testing impact of minor variations [93] | Testing impact of sample handling, staining time, etc. | Measures resistance to small procedural variations |
| Sample Stability | Evaluation under various storage conditions [93] | Evaluation of staining stability over time | Ensures reliable results with real-world samples |
ELISA Validation: Complete ELISA validation requires demonstrating precision, accuracy, specificity, sensitivity, linearity, and robustness according to regulatory guidelines [31] [93]. Precision encompasses both intra-assay (within-run) and inter-assay (between-run) components, with coefficients of variation typically below 10% and 15% respectively [31]. Accuracy is established through spike-and-recovery experiments using known analyte concentrations, with acceptable recovery generally falling between 80-120% [31]. Specificity validation must confirm minimal cross-reactivity with structurally similar molecules that could generate false positive results [31].
Flow Cytometry Validation: While sharing many validation parameters with ELISA, flow cytometry requires additional considerations specific to cellular analysis. These include stability of staining over time, instrument performance standardization, and reproducibility of gating strategies [121]. For clinical applications, standardization across multiple sites and instruments becomes critical, requiring rigorous attention to protocol harmonization, reagent consistency, and data analysis conventions [93]. Validation should also establish sample stability requirements regarding time from collection to processing, staining stability before analysis, and effects of cryopreservation if applicable [121].
Essential Reagents and Research Solutions
Successful implementation of ELISA and flow cytometry methodologies depends on appropriate selection and qualification of critical reagents. These components form the foundation of reliable assays across all project stages.
Table 3: Essential Research Reagent Solutions for Immunochemical Methods
| Reagent Category | Specific Examples | Function | Stage Considerations |
|---|---|---|---|
| Antibodies | Monoclonal, polyclonal, recombinant [121] | Target recognition and binding | Discovery: Commercial antibodies with literature supportValidation: Full characterization required |
| Blocking Buffers | BSA, non-fat dry milk, proprietary formulations [81] | Reduce non-specific binding | Optimization required for each assay matrix |
| Detection Systems | HRP, AP, fluorescent conjugates [81] | Generate measurable signal | HRP concentration: 20-200 ng/mL (colorimetric) [81] |
| Sample Diluents | Matrix-matched solutions [81] | Maintain analyte integrity | Should mimic sample matrix composition |
| Staining Buffers | PBS/BSA with azide [120] | Maintain cell viability during staining | Standardized formulation critical for reproducibility |
| Lyse Buffers | Ammonium chloride-based, commercial formulations [120] [121] | Remove red blood cells | Species-specific formulations required |
| Reference Standards | International standards, purified proteins [31] | Calibration and quantification | Traceability to reference materials required for validation |
For flow cytometry specifically, antibody selection warrants particular attention. Recombinant antibodies offer advantages for clinical applications due to their defined composition and minimal lot-to-lot variation, while monoclonal antibodies provide consistent specificity to single epitopes [121]. Polyclonal antibodies, while potentially more sensitive due to recognition of multiple epitopes, introduce greater variability and require more extensive validation [121]. The International Working Group for Antibody Validation (IWGAV) has established guidelines for antibody characterization, emphasizing the need for application-specific validation to ensure reliable results [121].
Advanced Applications and Integrated Approaches
Multiplexing Technologies
Multiplex immunoassay platforms represent a significant advancement beyond traditional methods, enabling simultaneous quantification of multiple analytes from single samples. These approaches provide substantial benefits for efficiency, sample conservation, and data quality.
Multiplex Flow Cytometry: Flow cytometry inherently offers multiplexing capability through multicolor panel design, with spectral flow cytometry further expanding parameter capacity by capturing full emission spectra rather than discrete wavelengths [121]. This technology enables comprehensive immunophenotyping panels that can characterize complex cell populations and functional states in unprecedented detail [122] [121]. For cytokine analysis, bead-based multiplex arrays (e.g., CBA Flex Set System) allow simultaneous measurement of multiple cytokines from small sample volumes, addressing a key limitation of traditional ELISA [119].
Multiplex ELISA Platforms: Various technologies now support multiplexed protein detection in ELISA-like formats, including array-based systems and digital immunoassays [123]. These platforms maintain the sensitivity and specificity of traditional ELISA while dramatically increasing information yield per sample [124]. For tissue diagnostics, multiplex immunohistochemistry enables simultaneous detection of multiple biomarkers on a single tissue section, preserving spatial relationships that are lost in flow cytometry [124].
Integrated Workflow Solutions
As research complexity increases, fragmented workflows comprising disconnected instruments and manual steps introduce variability and inefficiency [123]. Integrated systems that consolidate instruments, reagents, and software into cohesive ecosystems address these challenges by standardizing processes from sample preparation to data analysis [123].
Sample Preparation Standardization: Consistent sample processing is foundational for reliable results, particularly in flow cytometry where cell viability and single-cell suspension quality directly impact data [121]. Automated homogenization systems, standardized digestion protocols, and controlled resting procedures after thawing cryopreserved cells all contribute to reduced variability [121]. For ELISA, standardized sample collection tubes, processing timelines, and storage conditions minimize pre-analytical variations [31].
Data Management and Analysis: Both ELISA and flow cytometry generate substantial data requiring robust management and analysis solutions. For flow cytometry, this includes standardized gating strategies, automated population identification algorithms, and documentation adhering to MiFlowCyt requirements for publications [121]. ELISA data management should incorporate standard curve validation, sample tracking, and results documentation compliant with regulatory standards [31] [93].
The successful application of ELISA and flow cytometry technologies across the project continuum from discovery to clinical validation requires thoughtful consideration of stage-specific requirements and methodological capabilities. ELISA remains the gold standard for soluble analyte quantification, offering robust performance, regulatory acceptance, and relatively straightforward implementation. Flow cytometry provides unparalleled insights into cellular heterogeneity and function, with expanding multiplexing capabilities enabling increasingly comprehensive profiling.
Strategic method selection, systematic optimization, and rigorous validation appropriate for each project stage form the foundation for generating reliable data capable of supporting critical research and development decisions. As immunoassay technologies continue to evolve, with advances in multiplexing, sensitivity, and integration, researchers must maintain awareness of both capabilities and limitations to effectively leverage these powerful tools in biomedical science and clinical applications.
Regulatory Considerations for Preclinical and Clinical Assay Development
The development of robust preclinical and clinical assays is a critical pillar in the drug development process, serving as the foundation for generating reliable, reproducible, and regulatory-compliant data. Assays such as Enzyme-Linked Immunosorbent Assay (ELISA) and flow cytometry are indispensable tools in this landscape, used for purposes ranging from pharmacokinetic studies and biomarker quantification to immunophenotyping and receptor occupancy measurements. The validation of these assays ensures they are fit for their intended purpose, providing confidence in the results that underpin key development decisions and regulatory submissions. Regulatory agencies including the U.S. Food and Drug Administration (FDA) and the European Medicines Agency (EMA), along with harmonization bodies like the International Council for Harmonisation (ICH), have established frameworks to guide assay validation. These frameworks emphasize principles such as accuracy, reliability, and reproducibility, requiring a demonstration that the method performs consistently and as intended in the specified operating environment [125] [126].
The regulatory landscape is dynamic, evolving to incorporate technological advancements and a deeper scientific understanding of complex modalities. A significant recent shift is the move toward a tailored, risk-based approach to validation, where the extent and rigor of validation are aligned with the assay's specific intended use and the criticality of the decisions it will inform [103]. Furthermore, for sophisticated technologies like flow cytometry, which present unique challenges such as the lack of a traditional calibration curve, dedicated guidelines have been developed to address these specific needs [96]. This guide provides an in-depth examination of the core regulatory considerations for developing and validating ELISA and flow cytometry assays, detailing the essential validation parameters, experimental protocols, and strategic implementation practices necessary for success in the current regulatory environment.
Core Regulatory Guidelines and Principles
Navigating the regulatory expectations for assay validation requires a firm understanding of the key governing documents. The following table summarizes the principal guidelines relevant to ELISA and flow cytometry.
Table 1: Key Regulatory Guidelines for Assay Validation
| Guideline | Issuing Body | Primary Focus | Key Principles |
|---|---|---|---|
| ICH Q2(R2) [126] | ICH | Analytical procedure validation for chemical and biological pharmaceuticals. | Harmonized parameters for validation: specificity, linearity, accuracy, precision, range, LOD, LOQ. Promotes a science- and risk-based approach. |
| FDA Bioanalytical Method Validation [125] | FDA | Validation of bioanalytical methods used in human clinical and non-clinical studies. | Demonstrates reliability for intended use. Covers parameters like accuracy, precision, selectivity, sensitivity, and reproducibility. |
| CLSI H62 [96] [95] | CLSI (FDA-recognized) | Validation of assays performed by flow cytometry. | Addresses unique challenges of cell-based assays. Covers instrument qualification, assay optimization, and validation for cellular measurands. |
| FDA Guidance on ADCs [127] | FDA | Clinical pharmacology for Antibody-Drug Conjugates (ADCs). | Mandates multi-component bioanalysis (antibody, payload, linker). Highlights need for pharmacogenomic evaluations in some cases. |
A fundamental concept in modern assay validation is the "fit-for-purpose" approach. Both the FDA and EMA advocate for this strategy, which dictates that the level and rigor of validation should be commensurate with the stage of drug development and the specific role of the assay [103]. For instance, an exploratory biomarker assay may require less extensive validation than a definitive bioanalytical assay used to support dosing decisions in a pivotal clinical trial. The ICH Q2(R2) guideline, complemented by ICH Q14 on analytical procedure development, provides a structured framework for this, emphasizing the definition of an Analytical Target Profile (ATP) and a science- and risk-based approach to method development and lifecycle management [126].
For flow cytometry, the CLSI H62 guideline is a landmark document, as it is the first official guidance dedicated to validating flow cytometric assays. It acknowledges that existing guidance for soluble analytes is not fully applicable to the quantification and characterization of cellular measurands. The guideline provides critical strategies for pre-examination activities (e.g., sample requirements, reagent optimization), examination phase activities (e.g., instrument monitoring), and post-examination activities (e.g., data review and reporting) [96] [95]. Furthermore, the FDA is actively promoting innovation in testing paradigms, as evidenced by its plan to phase out animal testing requirements for monoclonal antibodies and other drugs, encouraging the use of New Approach Methodologies (NAMs) like AI-based computational models and human organoid-based testing [128]. This signals a broader shift toward more human-relevant and technologically advanced testing methods.
ELISA Assay Development and Validation
Validation Parameters and Experimental Protocols
The ELISA remains a cornerstone technique for quantifying soluble analytes like proteins, hormones, and antibodies in biological matrices. Per FDA regulations, an ELISA protocol must be thoroughly validated to demonstrate its accuracy, reliability, and reproducibility for its intended purpose in drug development [125]. The validation process involves testing the protocol with appropriate samples and evaluating a defined set of performance parameters.
The following diagram illustrates the key stages in the ELISA development and validation workflow, from initial design to ongoing maintenance.
Table 2: Core ELISA Validation Parameters and Experimental Protocols
| Validation Parameter | Experimental Protocol & Methodology | Key Acceptance Criteria |
|---|---|---|
| Specificity | Assess ability to measure analyte in presence of potential interferents (e.g., matrix components, related substances). Spike analyte into biological matrix and measure recovery. | High percent recovery (e.g., 80-120%) with no significant interference from cross-reacting substances [125] [126]. |
| Linearity & Range | Prepare a series of analyte standards in the biological matrix across the expected concentration range. Analyze and plot signal response vs. concentration. | A linear relationship with a correlation coefficient (R²) of ≥ 0.99 is typically expected [126]. |
| Accuracy | Spike the analyte at multiple known concentrations (low, mid, high) into the matrix (n ≥ 5 per level). Calculate mean measured concentration vs. theoretical. | Mean percent recovery should be within predefined limits (e.g., ±20% for LLOQ, ±15% for other levels) [125] [126]. |
| Precision | Repeatability: Analyze multiple replicates (n ≥ 5) of QC samples at low, mid, high concentrations in a single run.Intermediate Precision: Repeat the run on a different day, with a different analyst or instrument. | Expressed as %CV. Typically, ≤20% CV for LLOQ and ≤15% CV for other QC levels is acceptable [125] [126]. |
| Limit of Detection (LOD) / Quantification (LOQ) | LOD: Analyze blank and low-concentration samples. LOD is the lowest concentration with signal significantly different from blank (e.g., signal-to-noise ≥ 3:1).LOQ: The lowest concentration that can be measured with acceptable accuracy and precision (e.g., ±20% bias, ≤20% CV) [125] [126]. | LOD/LOQ should be sufficient for the assay's intended use. Accuracy and precision at LOQ must meet predefined criteria. |
| Robustness | Deliberately vary key operational parameters (e.g., incubation time/temperature, reagent concentrations, wash volume) within a small, predefined range. | The method should remain unaffected by small variations, with all key parameters meeting acceptance criteria [126]. |
The Scientist's Toolkit: Essential Reagents for ELISA
Table 3: Key Research Reagent Solutions for ELISA
| Reagent/Material | Function | Critical Considerations |
|---|---|---|
| Capture & Detection Antibodies | Bind specifically to the target analyte. The detection antibody is often conjugated for signal generation. | High specificity and affinity are paramount. Must be validated for minimal cross-reactivity [125]. |
| Antigen/Standard | The purified analyte used to generate the calibration curve for quantification. | Should be highly pure and well-characterized. Its integrity directly impacts accuracy [125]. |
| Enzyme-Conjugate | An enzyme (e.g., HRP, AP) linked to the detection antibody. Catalyzes a reaction to produce a measurable signal. | Conjugation must not impair antibody binding or enzyme activity. Stability is critical [125]. |
| Chromogenic/ Chemiluminescent Substrate | Reacts with the enzyme-conjugate to produce a colorimetric or light-based signal. | Choice impacts sensitivity and dynamic range. Chemiluminescence often offers higher sensitivity [103]. |
| Blocking Buffer | Prevents non-specific binding of antibodies to the solid phase (well surface). | Must effectively block without interfering with specific antibody-antigen interactions [125]. |
Flow Cytometry Assay Development and Validation
Validation Parameters and Experimental Protocols
Flow cytometry presents unique validation challenges because its data are often not derived from a traditional calibration curve, and true reference standards for cellular analytes are frequently lacking [96]. The CLSI H62 guideline provides a critical framework for addressing these challenges, focusing on instrument qualification, assay optimization, and analytical validation for cell-based assays.
The process for validating a flow cytometry assay involves several distinct phases, as outlined below.
Table 4: Core Flow Cytometry Validation Parameters and Experimental Protocols
| Validation Parameter | Experimental Protocol & Methodology | Key Acceptance Criteria |
|---|---|---|
| Instrument Qualification | Run standardized fluorescent particles to assess performance: fluidics, optics, and electronics. Monitor parameters like laser delay, CV, and mean fluorescence intensity (MFI). | Daily CVs and MFI should be within established ranges. Ensures instrument is stable and performing optimally before sample analysis [96] [95]. |
| Precision (Repeatability & Reproducibility) | Repeatability: Analyze multiple aliquots of the same sample (e.g., stabilized whole blood or cell lines) in one run.Reproducibility: Analyze the same sample type across different days, analysts, or instruments. | Expressed as %CV or %Difference for cell population frequencies and MFI. Criteria are application-dependent but must be predefined (e.g., CV < 10-15% for major populations) [96]. |
| Accuracy/Bias | Due to a lack of a gold standard, this is often assessed by comparison to a validated method or by using well-characterized reference materials (e.g., certified cell lines). | The difference (%Bias) between the measured value and the expected value from the reference material should be within acceptable limits [96]. |
| Specificity | Use fluorescence-minus-one (FMO) controls and isotype controls to distinguish specific antibody binding from background fluorescence and non-specific binding. | Positive populations should be clearly distinguishable from negative populations based on FMO controls [96]. |
| Stability | Evaluate sample stability over time under various storage conditions (e.g., room temperature, 4°C). Also assess reagent stability. | The measured cell counts and MFI should not change significantly (%Change within pre-set limit) compared to a freshly processed baseline sample [96]. |
| Linearity & Reportable Range | For assays quantifying cell number or concentration, perform serial dilutions of a sample with a high target cell count into a negative matrix. | The measured cell count should correlate linearly with the expected dilution. The range where linearity and acceptable precision are maintained is the reportable range [96]. |
Special Considerations for Rare Matrix Samples
Applying flow cytometry to rare, unique, or limited-availability specimen types (e.g., certain tissues, pediatric samples) introduces additional complexities. A consensus among subject matter experts emphasizes that while the CLSI H62 guideline provides the foundational framework, laboratories must adapt validation practices for these challenging samples [129]. Key considerations include:
- Sample Volume and Cell Number: Validation must account for the minimum required volume and cell yield, potentially requiring miniaturization of the assay.
- Stability: Given the difficulty of obtaining repeat samples, establishing robust stability data for the specific rare matrix under various handling and storage conditions is critical.
- Precision: With limited cell counts, the precision of the assay, especially for rare cell populations within the sample, must be rigorously evaluated, as CVs may be higher.
- Controls: Identifying appropriate control materials that mimic the rare matrix can be challenging but is necessary for reliable assay performance monitoring [129].
Implementation and Strategic Considerations
Integrated Validation Workflow
Successfully navigating the regulatory landscape requires a holistic, integrated approach that spans the entire assay lifecycle. The following diagram synthesizes the core activities from both ELISA and flow cytometry into a comprehensive validation workflow, highlighting the interconnected phases from initial planning to final regulatory submission.
Documentation and Lifecycle Management
Documentation: Every step involved in designing, optimizing, and validating an assay must be thoroughly documented. This includes the final protocol, all optimization and validation results, and any deviations encountered. This documentation must be stored securely and be readily available for regulatory authorities upon request [125]. In regulated environments, it is highly desirable to use software that adheres to 21 CFR Part 11 guidelines for electronic records and signatures, though manual processes may be needed to control functionality in non-compliant software packages [96].
Lifecycle Management: Once validated, an assay must be actively monitored and maintained. This involves the regular testing of control samples, careful monitoring of reagent and equipment performance, and periodic calibration of instruments [125]. The concept of assay lifecycle management, as introduced in ICH Q14, encourages a continuous process of monitoring performance and making science-based adjustments as needed, ensuring the assay remains robust and fit-for-purpose throughout its use in drug development [126].
Advanced Modalities and Future Directions
The regulatory framework is continuously adapting to novel therapeutic modalities. For example, the FDA's first dedicated guidance on Antibody-Drug Conjugates (ADCs) mandates a multi-component bioanalytical strategy. Developers must measure not just the intact ADC, but also the antibody, linker, payload, and relevant metabolites with validated assays, justifying the exclusion of any component [127]. This underscores the need for sophisticated, multi-faceted assay portfolios for complex biologics.
The future of biomarker validation and bioanalysis is moving beyond traditional ELISA. Advanced technologies like Meso Scale Discovery (MSD) and Liquid Chromatography tandem Mass Spectrometry (LC-MS/MS) offer superior sensitivity, broader dynamic ranges, and multiplexing capabilities. Regulators increasingly welcome the comprehensive data these techniques provide, which can facilitate a smoother review process [103]. Furthermore, the FDA's commitment to phasing out animal testing for monoclonal antibodies and other drugs in favor of New Approach Methodologies (NAMs)—including AI-based computational models and human cell-based assays—signals a paradigm shift toward more human-relevant, efficient, and ethical testing methods [128]. Staying abreast of these technological and regulatory trends is crucial for maintaining a competitive edge in drug development.
Conclusion
ELISA and flow cytometry are powerful, complementary techniques that form the backbone of modern biomedical research. ELISA excels in the sensitive, cost-effective quantification of soluble analytes, making it ideal for high-throughput screening. In contrast, flow cytometry provides unparalleled multi-parameter analysis at the single-cell level, enabling deep phenotypic and functional characterization of complex cell populations. The choice between them is not a matter of superiority but of strategic alignment with the research question, target, and sample type. Success hinges on rigorous antibody validation, meticulous protocol optimization, and the implementation of appropriate controls. As technology advances, the integration of these methods with emerging platforms like spectral cytometry and mass cytometry will further empower researchers to unravel complex biological systems, accelerate biomarker discovery, and advance the development of novel therapeutics.
References
- 1. ELISA Assay Technique | Thermo Fisher Scientific - US [https://www.thermofisher.com/us/en/home/life-science/protein-biology/protein-biology-learning-center/protein-biology-resource-library/pierce-protein-methods/overview-elisa.html]
- 2. Enzyme Linked Immunosorbent Assay - StatPearls - NCBI - NIH [https://www.ncbi.nlm.nih.gov/books/NBK555922/]
- 3. ELISA - Wikipedia [https://en.wikipedia.org/wiki/ELISA]
- 4. 酶联免疫吸附实验(ELISA) 概述 [https://www.cellsignal.cn/applications/elisa/elisa-educational]
- 5. ELISA是什么检测方法?一文读懂其原理、类型和应用 [https://new.mlbio.cn/article-843.html]
- 6. Data analysis for ELISA [https://www.abcam.com/en-us/technical-resources/guides/elisa-guide/calculating-elisa-data]
- 7. How to Read and Analyze ELISA Data [https://www.rndsystems.com/resources/how-to-analyze-elisa-data]
- 8. Immunofluorescence versus ELISA for the detection of ... [https://pubmed.ncbi.nlm.nih.gov/12050861/]
- 9. Flow Cytometry [https://wertheim.scripps.ufl.edu/cores-and-technologies/flow-cytometry/]
- 10. The future direction and applications of flow cytometry [https://www.ddw-online.com/the-future-direction-and-applications-of-flow-cytometry-34291-202504/]
- 11. Basic Principles in Flow Cytometry - Print [https://www.aabb.org/aabb-store/product/basic-principles-in-flow-cytometry---print-2283]
- 12. How high-throughput flow cytometry is transforming drug ... [https://www.drugdiscoverynews.com/how-high-throughput-flow-cytometry-is-transforming-drug-discovery-16312]
- 13. Flow Cytometry: Principles, Methods & Applications [https://biotrac.com/facs/]
- 14. Flow Cytometry vs. IHC vs. ELISA: How to Choose the ... [https://www.linkedin.com/pulse/flow-cytometry-vs-ihc-elisa-how-choose-right-immunophenotyping-y8zaf]
- 15. Flow Cytometry Market Size and Forecast 2025 to 2034 [https://www.precedenceresearch.com/flow-cytometry-market]
- 16. Flow Cytometry Reagents Market Size, Growth Demand & ... [https://www.consegicbusinessintelligence.com/flow-cytometry-reagents-market]
- 17. ELISA, Flow, Western: Choosing the Right Assay for Your ... [https://precisionantibody.com/elisa-flow-western-choosing-the-right-assay-for-your-antibody/]
- 18. Comparison of ELISA and flow cytometry for measurement ... [https://www.degruyterbrill.com/document/doi/10.1515/tjb-2017-0164/html?lang=en&srsltid=AfmBOoqhU7J9UCtku8l-HJLDAKQT7WDeo53Akmp8ANKDpUnccsyoEqOl]
- 19. The principle and method of ELISA [https://www.mblbio.com/bio/g/support/method/elisa.html]
- 20. ELISA vs. Flow Cytometry: Which is Right for Your ... [https://www.xlbiotec.com/blog/elisa-vs-flow-cytometry-which-is-right-for-your-immunology-study/]
- 21. Flow Cytometry Blood Cell Identification - StatPearls - NCBI [https://www.ncbi.nlm.nih.gov/books/NBK608011/]
- 22. Overview of Flow Cytometry [https://www.cellsignal.com/applications/flow-cytometry/flow-cytometry-overview?srsltid=AfmBOoruvmPufMhRrZbnKvNXl22VFabWO8_xDZkjDCHrX61McplyVIU7]
- 23. A comparison of ELISA and flow microsphere-based ... [https://pubmed.ncbi.nlm.nih.gov/12009201/]
- 24. ELISA-R: an R-based method for robust ELISA data analysis [https://www.frontiersin.org/journals/immunology/articles/10.3389/fimmu.2024.1427526/full]
- 25. Flow Cytometry Protocol | Abcam [https://www.abcam.com/en-us/technical-resources/protocols/flow-cytometry-for-intracellular-and-extracellular-targets]
- 26. Spectral Flow Cytometry Data Analysis [https://www.thermofisher.com/ru/en/home/life-science/cell-analysis/flow-cytometry/flow-cytometry-learning-center/flow-cytometry-resource-library/flow-cytometry-methods/spectral-flow-cytometry-data-analysis.html]
- 27. How Cell Sorting is Becoming an Even More Powerful Tool? [https://www.thermofisher.com/blog/behindthebench/how-cell-sorting-is-becoming-an-even-more-powerful-tool/]
- 28. Comparison of ELISA and flow cytometry for measurement ... [https://www.degruyterbrill.com/document/doi/10.1515/tjb-2017-0164/html?lang=en&srsltid=AfmBOoraPtjmuKW6mS5ydfTMpXENd9AXraq7VBZVTyKyU8GrLHwREg2z]
- 29. A Novel Flow Cytometry Array for High Throughput ... [https://pmc.ncbi.nlm.nih.gov/articles/PMC12567774/]
- 30. Simplified flow cytometry-based assay for rapid multi- ... [https://www.frontiersin.org/journals/pharmacology/articles/10.3389/fphar.2025.1594141/full]
- 31. ELISA Assay Validation: Best Practices, Methods, and Key ... [https://www.nebiolab.com/elisa-assay-validation-guide/]
- 32. Flow Cytometry: An Overview - PMC [https://pmc.ncbi.nlm.nih.gov/articles/PMC5939936/]
- 33. How Does Flow Cytometry Work? [https://nanocellect.com/blog/how-does-flow-cytometry-work/]
- 34. Flow Cytometry Guide: Principles, Applications [https://lifesciences.danaher.com/us/en/library/flow-cytometry-guide.html]
- 35. How to Interpret Flow Cytometry Data [https://www.fortislife.com/resources/antibody-resources/how-to-interpret-flow-cytometry-data]
- 36. Advanced flow cytometry data analysis ... [https://www.flowjo.com/advanced_analysis.html]
- 37. ELISA Guide; Part 2: The ELISA Protocol [https://www.jacksonimmuno.com/secondary-antibody-resource/immuno-techniques/elisa-guide-part-2/]
- 38. ELISA, flow cytometry, and immunohistochemistry [https://pubmed.ncbi.nlm.nih.gov/20717793/]
- 39. A Guide to Building a Direct Sandwich ELISA [https://www.ptglab.com/news/blog/a-guide-to-building-a-direct-sandwich-elisa/?srsltid=AfmBOoo_dPLf-PmLATzPfVjShk2tJ-z12rxpBUgbojs9pUmIKe6Uu8M7]
- 40. Troubleshooting Guide: ELISA [https://www.rndsystems.com/resources/troubleshooting-guide-elisa-development]
- 41. Flow Cytometry Sample Prep Guidelines [https://cancer.iu.edu/research/shared-facilities/flow-cytometry/sample-prep.html]
- 42. Flow Cytometry Sample Preparation: Protocols for Cell ... [https://www.bosterbio.com/protocol-and-troubleshooting/flow-cytometry-sample-preparation?srsltid=AfmBOoo0ivYBmdigv6L_JjV6i_J1dN2jMecEH0eU_iM3OjYeSTWLb-cv]
- 43. BestProtocols: Viability Staining Protocol for Flow Cytometry [https://www.thermofisher.com/us/en/home/references/protocols/cell-and-tissue-analysis/protocols/viability-staining-flow-cytometry.html]
- 44. Guidelines for preparation and flow cytometry analysis of ... [https://pmc.ncbi.nlm.nih.gov/articles/PMC11739683/]
- 45. Text has enhanced contrast | ACT Rule | WAI [https://www.w3.org/WAI/standards-guidelines/act/rules/09o5cg/]
- 46. Detection and Isolation of Tissue‐Specific Extracellular ... [https://pmc.ncbi.nlm.nih.gov/articles/PMC12183346/]
- 47. Comparison between enzyme‐linked immunospot assay and ... [https://pmc.ncbi.nlm.nih.gov/articles/PMC9449588/]
- 48. Ultra-high-scale cytometry-based cellular interaction ... [https://www.nature.com/articles/s41592-025-02744-w]
- 49. Advances of extracellular vesicles isolation and detection ... [https://jnanobiotechnology.biomedcentral.com/articles/10.1186/s12951-025-03768-2]
- 50. Recommendations for Accurate Target Expression ... [https://pubmed.ncbi.nlm.nih.gov/40519160/]
- 51. Intracellular Cytokine Staining - an overview [https://www.sciencedirect.com/topics/medicine-and-dentistry/intracellular-cytokine-staining]
- 52. Optimization and Validation of an 8-Color Intracellular ... [https://pmc.ncbi.nlm.nih.gov/articles/PMC2683732/]
- 53. How to get reliable data from intracellular cytokine staining [https://www.abcam.com/en-us/stories/articles/intracellular-cytokine-staining-best-practices]
- 54. Staining Intracellular Antigens for Flow Cytometry [https://www.thermofisher.com/us/en/home/references/protocols/cell-and-tissue-analysis/protocols/staining-intracellular-antigens-flow-cytometry.html]
- 55. Introducing the Dish Soap Protocol: A Unified Approach for ... [https://pmc.ncbi.nlm.nih.gov/articles/PMC12447862/]
- 56. Guide to Multiplex Immunoassays: Multiplex ELISA and More [https://www.thermofisher.com/blog/life-in-the-lab/guide-to-multiplex-immunoassays-multiplex-elisa-and-more/]
- 57. Flow Cytometry Multiplex Bead Array Technology and Its ... [https://pmc.ncbi.nlm.nih.gov/articles/PMC12588060/]
- 58. Comparing Flow Cytometry QBeads PlexScreen Assays ... [https://www.sciencedirect.com/science/article/pii/S247255522206885X]
- 59. nELISA: a high-throughput, high-plex platform enables ... [https://www.nature.com/articles/s41592-025-02861-6]
- 60. Multiplex microarray ELISA versus classical ... [https://pubmed.ncbi.nlm.nih.gov/23945745/]
- 61. Traditional ELISA vs Multiplex ELISA [https://www.bosterbio.com/newsletter-archive/20190710-traditional-elisa-vs-multiplex-elisa?srsltid=AfmBOorqJTom6-UD7CWuxCfrsSr9-aqPZNTebyOxEdgCfpk9RPpesh89]
- 62. A Rapid, Multiplexed, High-Throughput Flow-Through ... [https://pmc.ncbi.nlm.nih.gov/articles/PMC4665536/]
- 63. Flow Cytometry Multiplexing Used to Analyze Metabolic ... [https://www.thermofisher.com/us/en/home/life-science/cell-analysis/flow-cytometry/flow-cytometry-learning-center/flow-cytometry-resource-library/flow-cytometry-application-notes/flow-cytometry-multiplexing-used-analyze-metabolic-activity-assess-pharmaceutical-compound-toxicity-as-high-throughput-screening-tool.html]
- 64. Fluorescence-Activated Cell Sorting (FACS) [https://cellcarta.com/fluorescence-activated-cell-sorting-facs/]
- 65. Data analysis in flow cytometry [https://www.abcam.com/en-us/technical-resources/guides/flow-cytometry-guide/data-analysis-in-flow-cytometry]
- 66. Flow cytometry: Shining a light on new therapeutics [https://www.ddw-online.com/flow-cytometry-shining-a-light-on-new-therapeutics-32158-202410/]
- 67. Isolating Unique Cell Populations with Microbubble ... [https://www.akadeum.com/blog/isolating-unique-cell-populations-quickly-gently-and-efficiently/?srsltid=AfmBOopWkVTsaWSkimkp026wwsSNEfJ_u3vd70JHBDjaTtmwpmfpn8UF]
- 68. An overview of ELISA: a review and update on best laboratory ... [https://pmc.ncbi.nlm.nih.gov/articles/PMC11808753/]
- 69. Overview of Enzyme-Linked Immunosorbent Assay (ELISA) [https://www.cellsignal.com/applications/elisa/elisa-educational?srsltid=AfmBOopcBaU3qZ5_wECB4vtBu_6A_LAvDd4ovQwcNbx8udpXQC1U3yH7]
- 70. What Causes High Background in ELISA Tests? [https://shop.surmodics.com/elisa-test-results-high-background-causes]
- 71. How to deal with high background in ELISA [https://www.abcam.com/en-us/technical-resources/troubleshooting/high-background-elisa]
- 72. Troubleshooting ELISA [https://www.hycultbiotech.com/elisa-test/troubleshooting/]
- 73. ELISA Troubleshooting: Low Signal or No Detection [https://protocolsandsolutions.com/blogs/elisa-protocols/elisa-troubleshooting-low-signal-or-no-detection]
- 74. Development and Validation of ELISA for In Vitro Diagnosis ... [https://www.mdpi.com/2673-8112/5/7/108]
- 75. Beyond the limits of conventional 'endpoint' ELISA and ... [https://www.sciencedirect.com/science/article/pii/S0166093425001247]
- 76. Comparison of ELISA and flow cytometry for measurement ... [https://www.degruyterbrill.com/document/doi/10.1515/tjb-2017-0164/html?lang=en&srsltid=AfmBOorCAecB7RrynXTsjfQeqRw_yVwTMKIbweghLw52juwvdbRrNwzA]
- 77. Troubleshooting Flow Cytometry Issues [https://www.bosterbio.com/protocol-and-troubleshooting/flow-cytometry-troubleshooting?srsltid=AfmBOorppt2IMU-8kxpcwFZlVxsuoKqTdDTaB8nygYSgQ3LWP9EI4kB9]
- 78. Flow Cytometry Troubleshooting Guide [https://www.cellsignal.com/learn-and-support/troubleshooting/flow-cytometry-troubleshooting-guide?srsltid=AfmBOopdpsWqm9FC53PfGKP3E9QJxrI7n59wzTAwBe3kAnm3U0HInt17]
- 79. Optimize ELISA Assays with Checkerboard Titration ... [https://www.bosterbio.com/blog/post/how-to-use-checkerboard-titration-to-optimize-your-elisa-immunoassays?srsltid=AfmBOooTMyh9G25UTj21HLvOUwbxoUYEytDWPxotkoJvWYkUMYQcZjFo]
- 80. ELISA Guide; Part 3: ELISA Optimization [https://www.jacksonimmuno.com/secondary-antibody-resource/immuno-techniques/elisa-guide-part-3-elisa-optimization/]
- 81. ELISA Development and Optimization [https://www.thermofisher.com/us/en/home/life-science/protein-biology/protein-biology-learning-center/protein-biology-resource-library/pierce-protein-methods/overview-elisa/elisa-development-optimization.html]
- 82. Application of the checkerboard immunoblotting technique ... [https://pmc.ncbi.nlm.nih.gov/articles/PMC2712874/]
- 83. Development of a competitive ELISA using monoclonal ... [https://www.sciencedirect.com/science/article/pii/S1090023325000991]
- 84. Development and optimization of a new competitive ELISA ... [https://pubmed.ncbi.nlm.nih.gov/39813278/]
- 85. Recommended controls for flow cytometry [https://www.abcam.com/en-us/technical-resources/guides/flow-cytometry-guide/recommended-controls-for-flow-cytometry]
- 86. Flow Cytometry Controls [https://fluorofinder.com/flow-controls/]
- 87. ELISA Controls: Importance, Types, and Best Practices [https://www.astorscientific.us/blogs/news/elisa-controls?srsltid=AfmBOopt9KKbKMdrcAPRFI26-lcBWXUQVk8tV2wNas4oirXbAUT6-JBS]
- 88. Comprehensive Guide to Gating Strategies in Flow Cytometry [https://www.bosterbio.com/blog/post/comprehensive-guide-to-gating-strategies-in-flow-cytometry?srsltid=AfmBOop-e3aJ_WlHwYXukPAZv3lvWcKa-2Ah9evqHj2pv8tuRlc8saKR]
- 89. Mastering Flow Cytometry Gating Strategies [https://kcasbio.com/blogs/getting-a-go-to-gating-strategy/]
- 90. 5 Gating Strategies For Publishing Flow Cytometry Data [https://www.linkedin.com/pulse/5-gating-strategies-publishing-flow-cytometry-data-tim-bushnell]
- 91. The Gate of Flow Cytometry To Improve Your FACS Data ... [https://expertcytometry.com/3-flow-cytometry-gates-that-will-improve-the-accuracy-of-your-facs-data-analysis/]
- 92. Comparison of ELISA and flow cytometry for measurement ... [https://www.degruyterbrill.com/document/doi/10.1515/tjb-2017-0164/html?lang=en&srsltid=AfmBOoqcR4H5-Ejr8tZd7G31oWcgVpxlS3zlWEjdpyg_YqDogJuyQCU2]
- 93. A Practical Guide to Immunoassay Method Validation - PMC [https://pmc.ncbi.nlm.nih.gov/articles/PMC4541289/]
- 94. ELISA Kit Validation and Quality Testing [https://www.thermofisher.com/us/en/home/life-science/antibodies/immunoassays/elisa-kits/elisa-kit-validation-quality-testing.html]
- 95. Publication of CLSI H62 Validation of Assays Performed ... - Blog [https://blog.td2inc.com/publication-of-clsi-h62-validation-of-assays-performed-by-flow-cytometry]
- 96. H62 | Validation of Assays Performed by Flow Cytometry [https://clsi.org/shop/standards/h62/]
- 97. How to select the right ELISA kit - Biomedica [https://www.bmgrp.com/how-to-select-the-right-elisa/]
- 98. Validation of a flow cytometry-based basophil ... [https://www.labcorp.com/content/labcorp/us/en/education-events/posters/validation-flow-cytometry-based-basophil-degranulation-assay-use-multi-centric-clinical-trials-0.html]
- 99. ELISA: The Complete Guide [https://www.antibodies.com/applications/elisa]
- 100. Flow Cytometry Overview [https://www.southernbiotech.com/introduction-to-flow-cytometry/]
- 101. Comparison of ELISA and flow cytometry for measurement of interleukin-1 beta, interleukin-6 and tumor necrosis factor-α [https://www.degruyterbrill.com/document/doi/10.1515/tjb-2017-0164/html?lang=en]
- 102. Modified flow cytometry and cell-ELISA methodology to detect HLA class I antigen processing machinery components in cytoplasm and endoplasmic reticulum - PubMed [https://pubmed.ncbi.nlm.nih.gov/12957394/]
- 103. Beyond ELISA: the future of biomarker validation [https://www.drugtargetreview.com/article/154316/beyond-elisa-the-future-of-biomarker-validation/]
- 104. Antibody Validation for ELISA: Ensuring Accurate and ... [https://www.ptglab.com/news/blog/antibody-validation-for-elisa-ensuring-accurate-and-reliable-results/?srsltid=AfmBOorh4dwGQ0YmM7_QdxDed3x1BpGhmKZgIjp0WT0CSmkxYXkeR0_m]
- 105. Validating Assays in Flow Cytometry [https://www.bdbiosciences.com/en-us/learn/science-thought-leadership/events/validating-assays-in-flow-cytometry]
- 106. The difference between sensitivity and detection range in ... [https://www.bosterbio.com/blog/post/the-difference-between-sensitivity-and-the-minimum-level-of-assay-range-in-elisa-testing?srsltid=AfmBOop0Z2_cLGQBwtEM0r_Jd1Lz2LkuXFKsVlOW8C8I0vU-AKwB8pDv]
- 107. Hallmarks of Antibody Validation: Complementary Strategies [https://www.cellsignal.com/about-us/approach-validation-principles/complementary-assay?srsltid=AfmBOorjpa-8X9rLU1NaSWQmwc0yQ8fIJQgTS6RTpPIKeKpkLU09aY9m]
- 108. Comparison of four different assays to evaluate cellular ... [https://pmc.ncbi.nlm.nih.gov/articles/PMC12122514/]
- 109. Precision-Driven Biomarker Validation: A Biotech ... [https://www.criver.com/eureka/precision-driven-biomarker-validation-biotech-perspective-part-i]
- 110. Antibody Cross-Reactivity: How to Assess & Predict Binding [https://www.bosterbio.com/blog/post/how-to-determine-antibody-cross-reactivity?srsltid=AfmBOorv2jtjamiBy5wOpitQ45t2yyqwYbxOW1Anbj3ohqDPUFXomOry]
- 111. Antibody Validation Webinar Series [https://www.antibodysociety.org/learningcenter/antibody-validation-webinar-series/]
- 112. 2025 International Antibody Validation Meeting: First Look ... [https://blog.citeab.com/2025-international-antibody-validation-programme/]
- 113. Antibody Validation for ELISA: Ensuring Accurate and ... [https://www.ptglab.com/news/blog/antibody-validation-for-elisa-ensuring-accurate-and-reliable-results/?srsltid=AfmBOoo97Q884CE5yyHls9cU-m5mJ3xFQ47qPD4C1qIJfDrEN-oM9qFF]
- 114. Antibody Applications and Validation [https://www.antibodies.com/antibody-basics/applications-validation]
- 115. Applications of Flow Cytometry in Drug Discovery and ... [https://www.mdpi.com/1422-0067/25/7/3851]
- 116. Advantages of ELISA for Accurate and Accelerated Drug ... [https://www.moleculardevices.com/lab-notes/microplate-readers/advantages-of-elisa-for-accurate-and-accelerated-drug-discovery]
- 117. Flow Cytometry Applications: Advanced Uses, Benefits ... [https://cellcarta.com/science-hub/flow-cytometry-applications-advanced-uses-benefits-and-limitations/]
- 118. Comparison of ELISA and flow cytometry for measurement ... [https://www.degruyterbrill.com/document/doi/10.1515/tjb-2017-0164/html?lang=en&srsltid=AfmBOoqKGUJCVEQGatm0MZUMaJsCmJZakoJ-hnkhI7-437DQx05loPx5]
- 119. Comparison of ELISA and flow cytometry for measurement ... [https://www.degruyterbrill.com/document/doi/10.1515/tjb-2017-0164/html?lang=en&srsltid=AfmBOorOhQhP69_ysKamO9bxqMV0juY4huMK4Rf9NtbGF_No311vxg68]
- 120. Flow Cytometry Protocol for Cell Surface Markers [https://www.rndsystems.com/resources/protocols/flow-cytometry-protocol-staining-membrane-associated-proteins-suspended-cells]
- 121. Flow Cytometry Experimental Process—Spectral versus ... [https://www.thermofisher.com/us/en/home/life-science/cell-analysis/flow-cytometry/flow-cytometry-learning-center/flow-cytometry-resource-library/flow-cytometry-methods/spectral-flow-cytometry-experimental-process.html]
- 122. Flow Cytometry Antibody Titration Protocol [https://www.fn-test.com/news/product-news/flow-cytometry-antibody-titration-protocol/]
- 123. Reimagining Immunoassays With End-to-End Integrated ... [https://www.technologynetworks.com/tn/white-papers/reimagining-immunoassays-with-end-to-end-integrated-solutions-404561]
- 124. Multiplexing technology for efficiency [https://diagnostics.roche.com/global/en/article-listing/diagnostics-insights/multiplex-testing-efficiency-efficacy.html]
- 125. Validation of Elisa protocol as per FDA Regulation for Drug ... [https://www.mybiosource.com/learn/validation-of-elisa-protocol-as-per-fda-regulation-for-drug-developmen/]
- 126. ICH Guidelines for Analytical Method Validation Explained [https://amsbiopharma.com/ich-guidelines-analytical-method/]
- 127. Understanding the FDA's Guidance for ADC Development [https://cellcarta.com/science-hub/fda-guidance-adc/]
- 128. FDA Announces Plan to Phase Out Animal Testing ... [https://www.fda.gov/news-events/press-announcements/fda-announces-plan-phase-out-animal-testing-requirement-monoclonal-antibodies-and-other-drugs]
- 129. Implementation of Flow Cytometry in Rare Matrix Samples [https://cytometry.org/public-admin/mobile/show_presentation.php?abstractno=57]