ELISA vs. Luminex: A Comprehensive Guide to Choosing the Right Cytokine Quantification Assay
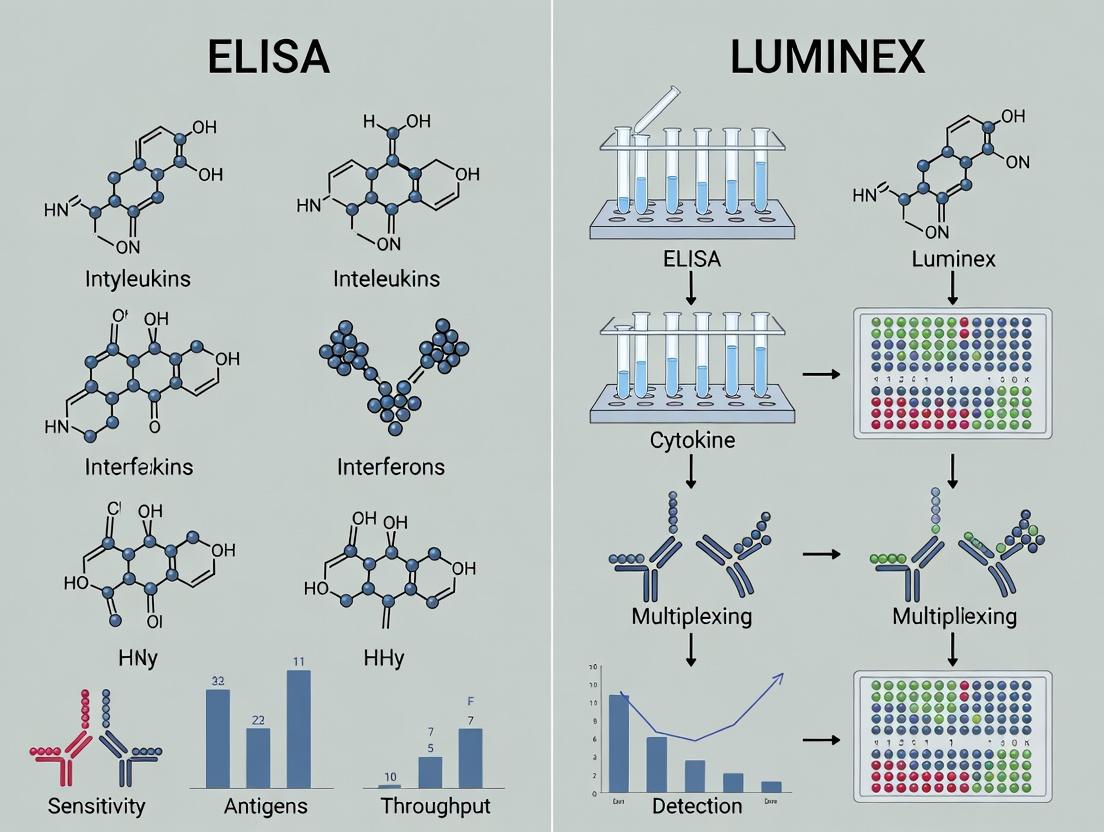
This article provides a detailed comparative analysis of ELISA and Luminex xMAP technologies for cytokine quantification, tailored for researchers and drug development professionals.
ELISA vs. Luminex: A Comprehensive Guide to Choosing the Right Cytokine Quantification Assay
Abstract
This article provides a detailed comparative analysis of ELISA and Luminex xMAP technologies for cytokine quantification, tailored for researchers and drug development professionals. We explore the foundational principles of each platform, delve into methodological workflows and ideal application scenarios, address common troubleshooting and optimization strategies, and present a critical validation and comparative analysis of sensitivity, throughput, and cost. This guide synthesizes current best practices and data to empower informed assay selection for basic research, biomarker discovery, and clinical development.
ELISA and Luminex Explained: Core Principles of Cytokine Detection
What is ELISA? The Gold Standard of Immunoassays Explained.
Enzyme-Linked Immunosorbent Assay (ELISA) is a fundamental plate-based assay technique designed to detect and quantify soluble substances such as peptides, proteins, antibodies, and hormones. Its principle hinges on the specific binding of an antigen by its corresponding antibody, coupled with an enzyme-mediated colorimetric detection system. Within the context of comparative research for cytokine quantification, such as in a thesis comparing ELISA to multiplex platforms like Luminex, ELISA remains the historical and often current gold standard due to its high sensitivity, specificity, and well-characterized methodology. This application note details the core principles, protocols, and considerations for implementing ELISA in cytokine research.
Core Principles and Types
The assay leverages the high specificity of antibody-antigen interactions. An enzyme conjugated to one component of the complex catalyzes a reaction with a substrate to produce a measurable signal, typically a color change proportional to the target concentration.
Common ELISA Formats:
- Direct ELISA: Labeled primary antibody binds directly to the immobilized antigen.
- Indirect ELISA: A labeled secondary antibody binds to the unlabeled primary antibody.
- Sandwich ELISA (most common for cytokines): The target antigen is captured between a coated capture antibody and a detection antibody.
- Competitive ELISA: Used for small antigens; sample antigen competes with a reference antigen for binding sites.
Detailed Protocol: Sandwich ELISA for Cytokine Quantification
This protocol provides a step-by-step methodology for quantifying a specific cytokine from cell culture supernatant or serum samples.
Materials & Reagent Solutions
Key Research Reagent Solutions:
| Reagent/Material | Function & Specification |
|---|---|
| 96-Well Microplate | Pre-coated with cytokine-specific capture antibody. |
| Recombinant Cytokine Standard | High-purity protein for generating the standard curve. |
| Detection Antibody | Biotin-conjugated cytokine-specific antibody. |
| Streptavidin-HRP Conjugate | Enzyme conjugate that binds to biotin. |
| TMB Substrate | Chromogenic substrate for Horseradish Peroxidase (HRP). |
| Stop Solution | Typically 1M H₂SO₄ or HCl; halts enzyme reaction. |
| Wash Buffer | PBS or Tris buffer with a detergent (e.g., 0.05% Tween-20). |
| Assay Diluent | Protein-based buffer (e.g., BSA) to dilute samples/standards and block non-specific binding. |
| Plate Reader | Spectrophotometer capable of reading absorbance at 450nm (and 570nm/620nm for reference). |
Procedure
Day 1: Coating (If not using a pre-coated plate)
- Dilute capture antibody in carbonate/bicarbonate coating buffer (pH 9.6).
- Add 100 µL per well to a 96-well plate. Seal and incubate overnight at 4°C.
Day 2: Assay Steps
- Wash: Aspirate coating solution and wash plate 3x with >300 µL wash buffer per well.
- Blocking: Add 300 µL of blocking buffer (e.g., 5% BSA in PBS) per well. Incubate for 1-2 hours at room temperature (RT). Wash 3x.
- Standard & Sample Addition:
- Prepare a 2-fold serial dilution series of the cytokine standard in assay diluent.
- Dilute test samples appropriately in assay diluent.
- Add 100 µL of standard or sample to appropriate wells. Include blank wells (diluent only). Incubate for 2 hours at RT or overnight at 4°C for higher sensitivity. Wash 3-5x.
- Detection Antibody Addition:
- Add 100 µL of biotinylated detection antibody (diluted per manufacturer's instructions) to each well.
- Incubate for 1-2 hours at RT. Wash 3-5x.
- Enzyme Conjugate Addition:
- Add 100 µL of Streptavidin-HRP (diluted per manufacturer's instructions) to each well.
- Incubate for 30-60 minutes at RT, protected from light. Wash 3-5x.
- Substrate Addition & Detection:
- Add 100 µL of TMB substrate solution to each well.
- Incubate for 5-30 minutes at RT, protected from light, until color develops adequately.
- Stop Reaction:
- Add 100 µL of stop solution to each well. The blue color will turn yellow.
- Read Plate: Measure the absorbance at 450 nm within 30 minutes. Subtract any reference wavelength (e.g., 570 nm) readings to correct for optical imperfections.
Data Analysis
- Generate a standard curve by plotting the mean absorbance (corrected) of the standard replicates against their known concentration.
- Fit the data using a 4- or 5-parameter logistic (4PL/5PL) curve fitting model, which is most appropriate for sigmoidal immunoassay data.
- Interpolate the concentration of unknown samples from the standard curve.
Quantitative Performance Data
Typical performance characteristics of a commercial high-sensitivity cytokine ELISA are summarized below.
Table 1: Representative Performance Metrics for a Sandwich ELISA
| Parameter | Typical Value/Range | Notes |
|---|---|---|
| Assay Time | 5 - 8 hours (excluding coating) | Can be extended for overnight incubation steps. |
| Sample Volume | 50 - 100 µL | Depends on kit specifications. |
| Dynamic Range | 3 - 4 logs (e.g., 1.95 - 2000 pg/mL) | Defined by the standard curve. |
| Sensitivity (LLOQ) | 1 - 10 pg/mL | Lower Limit of Quantification. |
| Intra-Assay Precision (CV) | < 10% | Variation within the same plate. |
| Inter-Assay Precision (CV) | < 15% | Variation between different plates/runs. |
| Recovery (Spike-in) | 80 - 120% | Assesses accuracy in biological matrix. |
Comparative Context: ELISA in Research
In a thesis comparing ELISA to Luminex for cytokine quantification, key differentiators must be highlighted. ELISA is a single-plex, high-throughput method ideal for validating results from discovery-based multiplex screens or for focusing on a specific cytokine of interest with maximum sensitivity and lower cost per analyte. Luminex allows simultaneous quantification of dozens of analytes from a small sample volume but may have a narrower dynamic range and higher per-plex cost.
Visualizations
Title: Sandwich ELISA Workflow
Title: Sandwich ELISA Detection Principle
This document serves as an application note and protocol guide for Luminex xMAP technology, contextualized within a comparative research thesis evaluating ELISA versus Luminex for cytokine quantification. The xMAP (multi-Analyte Profiling) platform enables simultaneous quantification of multiple cytokines from a single, small-volume sample, offering a high-throughput advantage for researchers and drug development professionals.
Principles of xMAP Technology
Luminex xMAP employs polystyrene or magnetic microspheres ("beads") internally dyed with precise ratios of two or three fluorophores, creating distinct spectral signatures. This allows for the creation of up to 500 unique bead sets, each covalently coupled to a specific capture biomolecule (e.g., an antibody). In a multiplexed assay, these bead sets are mixed and incubated with a sample. Analytes are captured and then detected via a biotinylated detection antibody and a streptavidin-phycoerythrin (SA-PE) conjugate. A dual-laser flow-based detector identifies the bead set (and thus the analyte) via the internal dyes and quantifies the amount of captured analyte via the PE fluorescence signal.
Comparative Data: Luminex vs. ELISA for Cytokine Analysis
Table 1: Key Performance and Operational Comparison
| Parameter | Luminex Multiplex Assay (Magnetic Bead-based) | Traditional Sandwich ELISA |
|---|---|---|
| Multiplexing Capacity | 1-500 analytes per well | Typically 1 analyte per well |
| Sample Volume Required | 25-50 µL for a 30-plex cytokine panel | 50-100 µL per analyte measured |
| Assay Time (Hands-on) | ~4 hours (for plate preparation, incubation, reading) | ~4-5 hours (per analyte, excluding coating) |
| Dynamic Range | Typically 3-4 logs (e.g., 1-10,000 pg/mL) | Typically 2-3 logs (e.g., 15-1,000 pg/mL) |
| Throughput (96-well plate) | 96 samples x up to 50 analytes = 4,800 data points | 96 samples x 1 analyte = 96 data points |
| Inter-assay CV | Typically <15% | Typically <12% |
| Primary Advantage | High-density data from minimal sample, time, and cost per data point. | Established, simple, high sensitivity for single analyte. |
| Primary Limitation | Potential for bead-bead/antibody interference; requires specialized analyzer. | Low plex limits sample utility for multi-analyte studies. |
Table 2: Representative Data from a Comparative Study (Hypothetical 10-Plex Cytokine Panel)
| Cytokine | ELISA Mean Conc. (pg/mL) | Luminex Mean Conc. (pg/mL) | Correlation (R²) | % CV (Luminex) |
|---|---|---|---|---|
| IL-6 | 150.2 | 142.8 | 0.98 | 8.2 |
| TNF-α | 89.7 | 95.1 | 0.97 | 9.5 |
| IL-1β | 32.5 | 29.8 | 0.95 | 11.3 |
| IL-10 | 45.6 | 48.3 | 0.96 | 7.9 |
Detailed Protocol: Magnetic Bead-Based Cytokine Multiplex Assay
Protocol 1: Assay Procedure for Pre-coupled Magnetic Bead Panels
This protocol is for a commercially available 30-plex human cytokine magnetic bead panel.
I. Materials & Pre-Assay Preparation
- Kit Components: Magnetic bead cocktail, assay diluents, standards (lyophilized or reconstituted), detection antibody cocktail, streptavidin-PE, wash buffer.
- Other Materials: Filter plates (1.2 µm or 0.45 µm pore size), plate sealer, plate shaker, magnetic plate washer (or hand-held magnet), Luminex xMAP-compatible analyzer (e.g., Luminex 200, FLEXMAP 3D).
- Preparation:
- Warm all reagents to room temperature (RT) for 30 min.
- Prepare a 1X Wash Buffer by diluting the 10X concentrate with deionized water.
- Reconstitute standards as per kit insert and serially dilute in the provided matrix to generate a 7-point standard curve.
- Dilute samples as necessary (typically 1:2 or 1:4) in the provided assay diluent.
II. Assay Workflow
- Bead Addition: Vortex magnetic bead cocktail for 60 sec. Add 50 µL to each well of a 96-well filter plate placed on the magnetic separator. Allow beads to settle, then apply magnet for 60 sec. Aspirate supernatant.
- Wash: Remove plate from magnet. Add 100 µL of 1X Wash Buffer. Shake briefly, then apply magnet and aspirate. Repeat once.
- Sample/Standard Incubation: Remove plate from magnet. Add 50 µL of standard, sample, or control to appropriate wells. Add 50 µL of assay diluent to all wells. Seal plate and incubate on a plate shaker (500-600 rpm) for 2 hours at RT, protected from light.
- Wash: Aspirate liquid, wash plate twice as in Step 2.
- Detection Antibody Incubation: Add 50 µL of the detection antibody cocktail to each well. Seal and incubate on a shaker for 1 hour at RT.
- Wash: Aspirate and wash twice as before.
- Streptavidin-PE Incubation: Add 50 µL of streptavidin-PE to each well. Seal and incubate on a shaker for 30 min at RT, protected from light.
- Final Wash & Resuspension: Aspirate and wash twice. Remove plate from magnet. Add 100-150 µL of Wash Buffer (or a specified sheath fluid) to resuspend beads. Shake for 5 min to ensure complete resuspension.
- Acquisition: Read plate on the Luminex analyzer immediately. Acquire a minimum of 50 beads per region.
III. Data Analysis
- Use instrument software to calculate median fluorescence intensity (MFI) for each bead region.
- Use a 5-parameter logistic (5PL) curve fit to generate a standard curve for each analyte.
- Interpolate sample concentrations from the respective standard curves.
Protocol 2: Bead Coupling (for Custom Assay Development)
Objective: Covalently couple a purified capture antibody to a specific magnetic carboxylated bead region.
- Activation: Resuspend 12.5 million beads in 500 µL of activation buffer. Add 10 µL of 50 mg/mL Sulfo-NHS and 10 µL of 50 mg/mL EDC. Mix and incubate for 20 min at RT with rotation.
- Wash: Place tube on a magnet for 2 min, remove supernatant. Wash beads twice with 1 mL of 50 mM MES buffer, pH 5.0.
- Coupling: Resuspend activated beads in 500 µL of MES buffer. Add 50 µg of purified capture antibody (in PBS, pH ~7.4). Mix and incubate for 2 hours at RT with rotation.
- Blocking: Add 500 µL of 1% BSA/PBS to block remaining active sites. Incubate for 30 min at RT.
- Storage: Wash beads 3x with 1 mL of PBS-TBN (PBS + 0.1% BSA + 0.05% NaN3, pH 7.4). Resuspend in 500 µL of storage buffer. Count beads and store at 4°C protected from light.
Visualizations
Luminex xMAP Sandwich Assay Workflow
Dual Laser Detection Principle in Luminex
The Scientist's Toolkit: Key Research Reagent Solutions
Table 3: Essential Materials for Luminex xMAP Cytokine Assays
| Item | Function & Key Features |
|---|---|
| Magnetic Bead Panel | Pre-coupled, spectrally distinct bead sets for target cytokines. Enables multiplexing. Magnetic properties facilitate wash steps. |
| Assay Diluent Buffer | Matrix-matched buffer for diluting standards/samples. Contains blockers (e.g., BSA, serum) to reduce non-specific binding. |
| Lyophilized Cytokine Standards | Precisely quantified analyte for generating standard curves. Reconstitution stability is critical for assay reproducibility. |
| Biotinylated Detection Antibody Cocktail | A pre-mixed blend of analyte-specific, biotin-conjugated detection antibodies. Must be validated for multiplex compatibility. |
| Streptavidin-Phycoerythrin (SA-PE) | Fluorescent reporter conjugate. Binds to biotin on detection antibodies, providing amplified signal for quantification. |
| Filter/Bottom Seal Plates | 96-well plates with a hydrophobic filter membrane to retain beads during vacuum or magnetic wash steps. |
| Magnetic Plate Washer/ Separator | Device to rapidly immobilize magnetic beads against the plate magnet for efficient and consistent supernatant aspiration. |
| Luminex xMAP Analyzer | Flow cytometer with dual lasers for bead classification (internal dye) and analyte quantification (PE signal). |
In the comparative analysis of ELISA versus Luminex bead-based immunoassays for cytokine quantification, understanding core performance parameters is critical. These key terms—Sensitivity, Dynamic Range, Specificity, and Cross-Reactivity—define the capabilities and limitations of each platform, directly impacting data reliability in preclinical and clinical research.
Definitions and Quantitative Comparison
Table 1: Key Terminology Definitions and Comparative Metrics for ELISA vs. Luminex
| Term | Definition | Impact on Cytokine Quantification | Typical ELISA Performance (Cytokine) | Typical Luminex/xMAP Performance (Cytokine) |
|---|---|---|---|---|
| Sensitivity | The lowest concentration of analyte that can be reliably distinguished from zero (LoD). | Determines ability to detect low-abundance cytokines (e.g., IL-10, IL-17). | 1-10 pg/mL (Colorimetric detection) | 0.5-5 pg/mL (Fluorescent detection; varies by panel) |
| Dynamic Range | The span of concentrations over which an assay provides quantitative results. | Critical for quantifying cytokines across wide concentration ranges (e.g., TNF-α in inflammation). | ~2 logs (e.g., 10-2000 pg/mL) | 3-4 logs (e.g., 3-10,000 pg/mL) |
| Specificity | The assay's ability to measure only the target analyte without interference from similar molecules. | Ensures accuracy in complex matrices like serum or cell culture supernatant. | High; singleplex format minimizes interference. | High per bead region; multiplexing requires careful validation. |
| Cross-Reactivity | Non-specific signal caused by non-target analytes or assay components (e.g., antibodies). | Can cause false positives, especially in multiplex panels with homologous cytokines. | Typically <1-5% (assessed against related analytes). | <1-10% between bead regions; must be validated per panel. |
Table 2: Platform-Level Comparison for Cytokine Profiling
| Feature | Sandwich ELISA | Luminex/xMAP Bead-Based Assay |
|---|---|---|
| Multiplex Capacity | Singleplex (one analyte per well) | Multiplex (up to 50+ analytes per well) |
| Sample Volume | 50-100 µL per analyte | 25-50 µL for multiple analytes |
| Throughput | Lower (limited by plates and singleplex) | High (multiplex reduces plates & hands-on time) |
| Assay Time | 4-6 hours (hands-on) | 2-4 hours (mostly hands-off) |
| Cost per Data Point | Lower for single analyte | Lower per analyte in multiplex panels |
Experimental Protocols for Comparative Analysis
Protocol 1: Assessing Sensitivity (Limit of Detection - LoD)
Objective: Empirically determine the LoD for a target cytokine (e.g., IL-6) on both platforms. Materials: Recombinant cytokine standard, assay diluent, ELISA kit, Luminex multiplex panel, matrix (e.g., PBS + 1% BSA). Procedure:
- Prepare Standards: Serially dilute the recombinant cytokine in matrix across 10-12 concentrations, spanning the expected LoD (e.g., 0.1-100 pg/mL).
- Run Assays: Perform ELISA and Luminex assays in triplicate per manufacturer's protocol.
- Data Analysis: For each concentration, calculate mean signal and standard deviation (SD). Perform a linear regression of signal vs. concentration for the low-end linear range.
- Calculate LoD: LoD = Meanblank + (3 * SDblank). Use the zero-standard as the blank.
Protocol 2: Evaluating Dynamic Range
Objective: Define the upper and lower limits of quantitation (ULOQ, LLOQ). Procedure:
- Run a Broad Standard Curve: Include concentrations from expected LoD to the maximum standard provided (e.g., 0.5 - 20,000 pg/mL).
- Calculate Accuracy (% Recovery): (Observed Concentration / Expected Concentration) * 100.
- Define LLOQ & ULOQ: The lowest and highest concentrations where % recovery is within 80-120% (or 70-130% for LLOQ) and precision (CV) is <20%.
- Compare: Plot log concentration vs. signal for both platforms to visualize the linear range.
Protocol 3: Testing Specificity and Cross-Reactivity
Objective: Verify assay specificity for the target and quantify cross-reactivity with homologous cytokines. Materials: Target cytokine and related cytokines (e.g., for IL-1β: IL-1α, IL-1RA). Procedure:
- Spike-and-Recovery with Homologues: Prepare samples spiked with a high concentration (e.g., 1000 pg/mL) of a related cytokine into matrix.
- Run Assays: Measure the sample on both platforms. A specific assay will read the sample as near the blank (low pg/mL).
- Calculate % Cross-Reactivity: (Measured Apparent Target Concentration / Concentration of Homologue Added) * 100.
- Matrix Effects: Repeat in biological matrix (e.g., 10% serum).
Visualization of Concepts and Workflows
The Scientist's Toolkit: Research Reagent Solutions
Table 3: Essential Materials for Comparative Immunoassay Studies
| Item | Function & Selection Criteria | Example Vendors/Catalog Notes |
|---|---|---|
| Recombinant Cytokine Standards | Calibrate assays; ensure identical source for platform comparison to isolate platform variability. | R&D Systems, PeproTech, NIBSC. Opt for carrier-free, high-purity. |
| Multiplex Bead Panel | Simultaneously quantify multiple cytokines in Luminex; choose panels aligned with research focus (e.g., Th1/Th2/Th17). | Thermo Fisher (ProcartaPlex), Bio-Rad (Bio-Plex), R&D Systems. |
| Singleplex ELISA Kits | Quantify individual cytokines for comparison; match analytes to multiplex panel. | Thermo Fisher (Invitrogen), R&D Systems (DuoSet), BioLegend. |
| Assay Diluent/Matrix | Dilute standards/samples; critical for accuracy. Use kit-recommended or validated diluent (e.g., PBS + 1% BSA, 0.05% Tween-20). | Prepare in-lab or use commercial immunoassay diluent. |
| Quality Control (QC) Samples | Monitor inter-assay precision; use pooled donor serum or commercial QC material at low, mid, high concentrations. | Bio-Rad, SeraCare. |
| Luminex-Compatible Plate Washer | Efficient bead washing is critical for low background in Luminex assays. | BioTek, Bio-Rad. Must have magnetic plate holder for bead retention. |
| Luminex Analyzer | Read multiplex assays; MAGPIX or FLEXMAP 3D systems. | Luminex Corporation. |
| Plate Reader (for ELISA) | Read colorimetric (450nm) or chemiluminescent signals. | SpectraMax, Synergy. |
| Data Analysis Software | Generate standard curves and calculate concentrations. 5PL logistic fit standard for both platforms. | Bio-Plex Manager, xPONENT, GraphPad Prism, SoftMax Pro. |
Cytokines are small, secreted proteins that mediate and regulate immunity, inflammation, and hematopoiesis. Precise quantification of these molecules is critical for understanding disease pathogenesis, identifying biomarkers, monitoring therapeutic responses, and developing targeted biologics. The choice of quantification platform—such as ELISA or multiplex immunoassays like Luminex—profoundly impacts data quality, throughput, and clinical utility.
Comparative Platform Analysis: ELISA vs. Luminex
The selection between ELISA and Luminex hinges on specific project requirements. The following table summarizes a comparative analysis based on current literature and technical specifications.
Table 1: Comparative Analysis of ELISA and Luminex xMAP for Cytokine Quantification
| Parameter | Conventional Sandwich ELISA | Luminex xMAP Multiplex Assay |
|---|---|---|
| Multiplexing Capacity | Single analyte per well | High-plex (up to 50+ analytes simultaneously) |
| Sample Volume Required | 50-100 µL per analyte | 25-50 µL for multiplex panel |
| Throughput (Samples/Day) | Medium (40-80 samples, singleplex) | High (100s of samples, multiplex data) |
| Dynamic Range | Typically 2-3 logs | 3-4 logs with dynamic bead regions |
| Sensitivity (Typical pg/mL) | 1-10 pg/mL | 0.5-5 pg/mL |
| Assay Time (Hands-on) | ~4-5 hours, extensive hands-on | ~3-4 hours, automated friendly |
| Cost per Data Point | Low (for single analyte) | Lower in high-plex context |
| Primary Best Use Case | Validating specific targets, limited sample, low-plex need | Discovery/screening, limited volume, pathway analysis |
Detailed Experimental Protocols
Protocol 3.1: Standard Sandwich ELISA for Cytokine Quantification (e.g., TNF-α)
Objective: To accurately quantify TNF-α concentration in human serum samples.
Materials & Reagents:
- Coating Antibody (Capture): Mouse anti-human TNF-α monoclonal antibody.
- Detection Antibody: Biotinylated mouse anti-human TNF-α monoclonal antibody.
- Standards: Recombinant human TNF-α protein, serially diluted.
- Samples: Human serum (diluted 1:2 in assay diluent).
- Microplate: 96-well high-binding polystyrene plate.
- Detection System: Streptavidin-Horseradish Peroxidase (SA-HRP) and TMB substrate.
- Plate Reader: Spectrophotometer capable of reading 450 nm (with 570 nm correction).
Procedure:
- Coating: Dilute capture antibody to 1-4 µg/mL in carbonate/bicarbonate coating buffer (pH 9.6). Add 100 µL per well. Seal plate and incubate overnight at 4°C.
- Washing & Blocking: Aspirate wells. Wash 3x with 300 µL PBS containing 0.05% Tween-20 (PBST). Add 300 µL blocking buffer (e.g., PBS with 1% BSA or 5% non-fat dry milk). Incubate 1-2 hours at room temperature (RT). Wash 3x with PBST.
- Sample & Standard Incubation: Prepare standard curve (e.g., 1000 pg/mL to 15.6 pg/mL, 2-fold serial dilutions) in assay diluent. Load 100 µL of standards, samples, and blanks per well in duplicate. Incubate 2 hours at RT. Wash 5x with PBST.
- Detection Antibody Incubation: Add 100 µL of biotinylated detection antibody (pre-determined optimal dilution) per well. Incubate 1-2 hours at RT. Wash 5x with PBST.
- Enzyme Conjugate Incubation: Add 100 µL of diluted SA-HRP per well. Incubate 30 minutes at RT in the dark. Wash 5-7x with PBST.
- Substrate Development: Add 100 µL of TMB substrate per well. Incubate 5-20 minutes at RT in the dark until color develops.
- Stop & Read: Add 50 µL of 1M H₂SO₄ stop solution. Gently mix. Read absorbance at 450 nm within 30 minutes, using 570 nm or 620 nm as a reference wavelength.
- Data Analysis: Generate a 4- or 5-parameter logistic (4PL/5PL) standard curve. Interpolate sample concentrations, applying any necessary dilution factors.
Protocol 3.2: Luminex xMAP Multiplex Assay for a 10-Plex Cytokine Panel
Objective: To simultaneously quantify a panel of 10 cytokines (e.g., IL-1β, IL-2, IL-4, IL-6, IL-8, IL-10, IL-12p70, IFN-γ, TNF-α, GM-CSF) in human plasma.
Materials & Reagents:
- Kit: Pre-mixed magnetic bead-based 10-plex human cytokine panel (e.g., from R&D Systems, Bio-Rad, or Millipore).
- Standards & Controls: Lyophilized or reconstituted multiplex standard cocktail and quality controls.
- Samples: Human plasma (EDTA or Heparin), diluted 1:2.
- Microplate: 96-well flat-bottom plate.
- Luminex Instrument: MAGPIX or FLEXMAP 3D system with xPONENT software.
- Plate Washer: Magnetic plate washer compatible with 96-well format.
Procedure:
- Preparation: Reconstitute standards and controls as per kit instructions. Prepare a 1:2 dilution of all samples in the provided assay diluent.
- Bead Preparation: Vortex magnetic bead bottle for 30 seconds. Add 50 µL of mixed beads to each well of a 96-well plate.
- Washing: Place plate on a magnetic separator for 1 minute. Decant supernatant. Wash beads 2x with 100 µL of wash buffer.
- Incubation: Add 50 µL of standards, controls, or samples to appropriate wells. Seal plate and incubate on a plate shaker (800 rpm) for 2 hours at RT, protected from light.
- Detection Antibody Incubation: Wash beads 3x as in step 3. Add 50 µL of biotinylated detection antibody cocktail to each well. Seal and incubate on shaker for 1 hour at RT.
- Streptavidin-PE Incubation: Wash beads 3x. Add 50 µL of Streptavidin-Phycoerythrin (SA-PE) to each well. Seal and incubate on shaker for 30 minutes at RT, protected from light.
- Final Wash & Resuspension: Wash beads 3x. Add 100 µL of wash buffer to resuspend beads. Shake for 2-5 minutes.
- Acquisition: Run plate on Luminex analyzer immediately. Acquire a minimum of 50 beads per region.
- Data Analysis: Use instrument software to generate standard curves for each analyte (5PL weighted). Report median fluorescence intensity (MFI) and concentration (pg/mL) for each analyte.
Visualizations: Signaling Pathways and Workflows
The Scientist's Toolkit: Key Research Reagent Solutions
Table 2: Essential Reagents and Materials for Cytokine Quantification Studies
| Item | Function/Description | Key Considerations for Selection |
|---|---|---|
| Matched Antibody Pairs (ELISA) | Capture and detection antibodies specific to the same cytokine epitope but non-competing. | Verify species reactivity, cross-reactivity data, and recommended pairings from supplier. |
| Multiplex Bead Kits (Luminex) | Pre-optimized panels of magnetic or polystyrene beads, each uniquely dyed and conjugated to a capture antibody. | Select panels based on relevant biological pathways. Validate in your specific sample matrix. |
| Recombinant Protein Standards | Highly pure, quantitated cytokine protein for generating standard curves. | Ensure the standard matches the assay's recognized epitopes (e.g., natural vs. recombinant sequence). |
| Assay Diluent/Matrix | Buffer used to dilute standards and samples. Often contains blockers to reduce nonspecific binding. | Use a diluent that mimics the sample matrix (e.g., serum/plasma matrix for biofluid samples). |
| Detection Conjugates | Enzymes (HRP, AP) or fluorophores (PE, APC) linked to streptavidin or secondary antibodies. | Match conjugate to detection system (spectrophotometer, Luminex analyzer). Consider brightness and stability. |
| Magnetic Plate Washer | Automated washer for bead-based assays, using a magnet to retain beads during wash cycles. | Essential for reproducibility in high-plex Luminex assays. Reduces bead loss vs. manual washing. |
| Multiplex Analyzer | Luminex MAGPIX, FLEXMAP 3D, or similar. Uses lasers to identify beads (via internal dye) and quantify bound analyte (via reporter fluorescence). | Throughput, sensitivity, and dynamic range vary between instruments. |
From Protocol to Purpose: Methodological Workflows and Optimal Use Cases
Thesis Context: This protocol details a standard sandwich ELISA for quantifying a single cytokine (e.g., IL-6). It serves as a foundational reference method within a broader thesis comparing the performance, throughput, and utility of ELISA versus multiplex platforms like Luminex for cytokine profiling in biomedical research and drug development.
The sandwich ELISA is the gold standard for sensitive and specific quantification of soluble proteins. It employs two antibodies: a capture antibody immobilized on a plate and a detection antibody that binds a different epitope on the target cytokine. This creates a "sandwich," minimizing cross-reactivity. The detection antibody is conjugated to an enzyme (e.g., Horseradish Peroxidase, HRP), which catalyzes a colorimetric reaction upon substrate addition, with signal intensity proportional to cytokine concentration.
Research Reagent Solutions & Essential Materials
| Item | Function |
|---|---|
| 96-Well Microplate (Pre-coated) | Polystyrene plate pre-coated with capture antibody specific to the target cytokine. Provides the solid phase for immunoassay. |
| Recombinant Cytokine Standard | Precisely quantified protein used to generate a standard curve for interpolating sample concentrations. |
| Assay Diluent Buffer | Matrix (often protein-based) for reconstituting standards and diluting samples. Minimizes non-specific binding. |
| Wash Buffer (10X Concentrate) | Typically PBS or Tris with a detergent (e.g., Tween-20). Diluted to 1X for washing away unbound materials. |
| Detection Antibody (Biotinylated) | A second cytokine-specific antibody, conjugated to biotin. Binds the captured cytokine to form the sandwich. |
| Streptavidin-HRP Conjugate | Binds with high affinity to biotin on the detection antibody, introducing the enzyme for signal generation. |
| TMB Substrate Solution | Colorimetric substrate for HRP. Yields a blue product upon enzymatic reaction, which turns yellow when stopped. |
| Stop Solution (e.g., 1M H2SO4) | Acidic solution that halts the HRP-TMB reaction, stabilizing the final signal for measurement. |
| Microplate Reader | Instrument to measure optical density (OD), typically at 450 nm (with 570 nm or 620 nm reference wavelength). |
Detailed Protocol
Day 1: Plate Coating (If using an uncoated plate)
- Dilute capture antibody to recommended concentration (typically 1-10 µg/mL) in carbonate/bicarbonate coating buffer (pH 9.6).
- Add 100 µL per well to a 96-well microplate. Seal and incubate overnight at 4°C.
Day 2: Assay Procedure
A. Plate Preparation & Standard Dilution
- Wash: Aspirate coating buffer and wash plate 3 times with 300 µL of 1X Wash Buffer. Blot dry.
- Block: Add 300 µL of Assay Diluent or blocking buffer (e.g., 1% BSA, 5% non-fat dry milk) per well. Incubate for 1-2 hours at room temperature (RT). Wash 3x.
- Prepare Standard Curve: Reconstitute the cytokine standard. Prepare a 2-fold or 5-fold serial dilution series in Assay Diluent to cover the expected range (e.g., from 1000 pg/mL to 15.6 pg/mL). Include a zero standard (diluent only).
B. Sample & Standard Incubation
- Add 100 µL of each standard, sample (diluted as optimized), and blank (diluent) to appropriate wells in duplicate or triplicate.
- Seal plate. Incubate for 2 hours at RT or overnight at 4°C for higher sensitivity.
- Wash plate 3-5 times thoroughly.
C. Detection Antibody Incubation
- Add 100 µL of biotinylated detection antibody (diluted in Assay Diluent per kit instructions) to each well.
- Seal plate. Incubate for 1-2 hours at RT.
- Wash plate 3-5 times.
D. Enzyme Conjugate Incubation
- Add 100 µL of Streptavidin-HRP (diluted per instructions) to each well.
- Seal plate. Incubate for 30-60 minutes at RT, protected from light.
- Wash plate 3-5 times.
E. Substrate Reaction & Signal Detection
- Add 100 µL of TMB Substrate Solution to each well. Incubate for 5-30 minutes at RT, protected from light. Monitor for blue color development in standard wells.
- When desired color intensity is reached, add 50 µL of Stop Solution to each well. The blue color will turn yellow.
- Read the Optical Density (OD) at 450 nm within 30 minutes, using 570 nm or 620 nm as a reference wavelength to subtract background.
Data Analysis & Interpretation
- Calculate the average OD for each standard, sample, and blank.
- Subtract the average zero standard (blank) OD from all other averages.
- Generate a standard curve by plotting the logarithm of the standard concentration (x-axis) against the corrected average OD (y-axis). Use a 4- or 5-parameter logistic (4PL/5PL) curve fit.
- Interpolate sample concentrations from the standard curve. Apply any sample dilution factor.
Table 1: Example IL-6 Standard Curve Data (Hypothetical)
| Standard Point | Concentration (pg/mL) | Avg. OD (450 nm) | Corrected OD |
|---|---|---|---|
| Blank | 0 | 0.050 | 0.000 |
| S1 | 15.6 | 0.120 | 0.070 |
| S2 | 31.3 | 0.210 | 0.160 |
| S3 | 62.5 | 0.450 | 0.400 |
| S4 | 125 | 0.950 | 0.900 |
| S5 | 250 | 1.650 | 1.600 |
| S6 | 500 | 2.100 | 2.050 |
| S7 | 1000 | 2.300 | 2.250 |
Typical Assay Performance Metrics:
- Dynamic Range: 15.6 - 1000 pg/mL (as per example)
- Limit of Detection (LoD): Typically 1-10 pg/mL (calculated as mean blank + 2SD)
- Intra-assay CV: <10%
- Inter-assay CV: <15%
- Recovery (Spike-in): 80-120%
Visualized Workflow
Diagram Title: Sequential Steps in a Sandwich ELISA Protocol
Diagram Title: Molecular Components of a Sandwich ELISA
Within a thesis comparing ELISA and Luminex xMAP technology for cytokine quantification, this protocol details the execution of a multiplex Luminex assay. While ELISA is a robust, single-plex standard, Luminex allows for the simultaneous quantification of up to 500 analytes from a single small-volume sample, providing a high-throughput, data-rich alternative critical for comprehensive biomarker profiling in drug development.
Principle of the xMAP Technology
The Luminex xMAP system utilizes color-coded magnetic microspheres ("beads"), each set impregnated with unique ratios of two fluorescent dyes. Each bead set is conjugated to a capture antibody specific for a target cytokine. Beads are mixed with the sample, allowing target cytokines to bind. After washing, a biotinylated detection antibody is added, followed by streptavidin-phycoerythrin (SAPE) reporter. A dual-laser flow cytometer identifies each bead set (and thus the analyte) by its internal color and quantifies the amount of bound analyte via the PE fluorescence intensity.
Detailed Protocol
Day 1: Assay Setup & Sample Incubation
- Preparation: Thaw all kit components (standards, controls, samples, beads, detection antibodies) slowly on ice. Prepare all wash and dilution buffers as per kit instructions. Filter all samples through a 0.22 µm low-protein-binding membrane.
- Standard Dilution: Serially dilute the provided standard cocktail to generate a 7- or 8-point standard curve. Include a blank (zero) standard.
- Plate Layout: Map the positions of standards, quality controls (QCs), and samples on a 96-well flat-bottom microplate.
- Bead Preparation: Vortex and sonicate the antibody-coupled magnetic bead stock for 30 seconds. Add the required volume of each bead set to an excess of bead diluent to create the multiplex bead mixture.
- Wash Beads: Transfer 100 µL of the bead mixture to each well of a magnetic separation plate. Place on a magnetic separator for 60 seconds, aspirate supernatant, and remove from the magnet.
- Add Assay Buffer: Add 100 µL of assay buffer to each well.
- Add Standards & Samples: Add 50 µL of standard, control, or sample to appropriate wells in duplicate. Seal the plate and incubate on a plate shaker (500-600 rpm) protected from light for 2 hours at room temperature.
- Wash: Using a magnetic separator, wash each well 3 times with 100 µL of wash buffer.
Day 1: Detection Antibody Incubation
- Add Detection Antibody: Add 50 µL of the biotinylated detection antibody cocktail to each well. Seal, and incubate on a plate shaker for 1 hour at room temperature.
- Wash: Perform 3 wash steps as before.
Day 1: Streptavidin-PE Incubation
- Add SAPE: Add 50 µL of Streptavidin-Phycoerythrin (typically 1-10 µg/mL) to each well. Seal, and incubate on a plate shaker for 30 minutes at room temperature.
- Final Wash: Perform 3 wash steps.
- Resuspend: Add 100-150 µL of drive fluid/reading buffer to each well. Resuspend the beads on a plate shaker for 5 minutes.
Day 1: Data Acquisition
- Run on Analyzer: Calibrate the Luminex analyzer (e.g., MAGPIX, Luminex 200). Set the gate settings for doublet discrimination. Run the plate, analyzing a minimum of 50 beads per region (analyte). Median Fluorescence Intensity (MFI) data is collected for each well.
Data Analysis
- Curve Fitting: Using the instrument software or a specialized data analysis package (e.g., xPONENT, Belysa), generate a 5-parameter logistic (5PL) standard curve for each analyte.
- Concentration Interpolation: Interpolate sample concentrations from the standard curve. Apply any sample-specific dilution factors.
- QC Acceptance: Verify that control values fall within expected ranges and that standard curve metrics (e.g., R² > 0.98, % recovery) meet pre-set criteria.
Key Data Comparison: ELISA vs. Luminex
Table 1: Comparative Metrics for Cytokine Quantification
| Parameter | Traditional Sandwich ELISA | Multiplex Luminex Assay |
|---|---|---|
| Multiplexing Capacity | Single analyte per well | Up to 500 analytes per well (practical limit: 40-50 for cytokines) |
| Sample Volume Required | 50-100 µL per analyte | 25-50 µL for all analytes |
| Assay Time (Hands-on) | ~4-5 hours (for one analyte) | ~4-5 hours (for a 30-plex panel) |
| Dynamic Range | Typically 2-3 logs | Typically 3-4 logs |
| Sensitivity | Low pg/mL range | Comparable, often improved for some targets |
| Throughput (Data Points/Day) | Low | Very High |
| Cost per Data Point | Higher | Lower |
The Scientist's Toolkit: Essential Research Reagent Solutions
Table 2: Key Materials and Reagents
| Item | Function & Importance |
|---|---|
| Magnetic Bead-Based Assay Kit | Pre-optimized, analyte-specific panel containing matched antibody pairs, beads, and standards. Critical for reproducibility. |
| Magnetic Separation Plate/Device | Enables rapid washing and buffer exchange by immobilizing magnetic beads. |
| Plate Shaker with Ambient Control | Ensures consistent bead suspension and binding kinetics during incubations. |
| Luminex xMAP Analyzer | Dual-laser flow-based instrument for bead identification (internal dye) and quantitation (PE signal). |
| Streptavidin-Phycoerythrin (SAPE) | Fluorescent reporter that binds biotin on detection antibodies, amplifying signal. |
| Low-Protein-Binding Microplates & Tips | Minimizes nonspecific adsorption of proteins (especially cytokines) to surfaces. |
| Automated Plate Washer | Provides consistent and thorough wash steps, essential for reducing background. |
| Data Analysis Software | Specialized software for curve fitting, interpolation, and managing multiplex data. |
Visualization of Workflow and Technology
Title: Luminex Assay Step-by-Step Protocol Workflow
Title: Principle of xMAP Bead-Based Detection
Within a comparative thesis evaluating ELISA versus Luminex multiplex assays for cytokine quantification, ELISA emerges as the preeminent tool for targeted analysis and validation. While Luminex offers high-throughput, multi-analyte screening, ELISA provides unparalleled specificity, sensitivity, and precision for confirming key targets identified in broader screens. This application note details the ideal use cases and protocols for ELISA in this validation-centric role.
Key Advantages for Targeted Validation
- High Specificity: Minimal cross-reactivity is critical for validating specific cytokine targets.
- Superior Sensitivity: Often achieves lower limits of detection for low-abundance cytokines compared to multiplex panels.
- Robust Quantification: Excellent precision and accuracy for absolute concentration measurements, essential for pharmacokinetic/pharmacodynamic (PK/PD) studies.
- Standardization and Regulatory Acceptance: Widely recognized and accepted for clinical diagnostics and biopharmaceutical lot release testing.
Quantitative Performance Comparison (Summarized Data)
Table 1: Typical Assay Performance Metrics for Validation-Grade ELISA
| Performance Parameter | Typical ELISA Range | Luminex xMAP (Comparative Range) | Ideal Application for ELISA |
|---|---|---|---|
| Dynamic Range | 2-3 logs | 3-4 logs | Confirmatory assays where linearity is paramount |
| Lower Limit of Detection (LLOD) | 0.5 - 5 pg/mL | 1 - 10 pg/mL | Validating low-abundance cytokines (e.g., IL-10, IL-17) |
| Inter-Assay Precision (%CV) | <12% | <15% | Longitudinal studies and batch-to-batch comparison |
| Sample Volume Required | 50 - 100 µL | 25 - 50 µL | Validating targets where sample volume is not limiting |
| Assay Time (Hands-on) | Moderate-High | Low-Moderate | Focused analysis of 1-10 key analytes from a multiplex screen |
Application Note: Validation of Luminex-Derived Cytokine Hits
Objective: To confirm the concentration and specificity of a lead cytokine (e.g., IL-6) identified in a preliminary Luminex screening experiment.
Experimental Workflow:
Diagram 1: ELISA Validation of Luminex Screening Results
Detailed Protocol: Sandwich ELISA for Cytokine (IL-6) Quantification
Materials & Reagents (The Scientist's Toolkit)
Table 2: Essential Research Reagent Solutions for Validation ELISA
| Item | Function & Specification |
|---|---|
| Pre-coated 96-well Plate | Microplate coated with capture antibody specific to the target cytokine (e.g., anti-human IL-6). |
| Cytokine Standards | Recombinant protein of known concentration for generating the standard curve. |
| Detection Antibody (Biotinylated) | A second target-specific antibody for sandwich complex formation, conjugated to biotin. |
| Streptavidin-HRP Conjugate | Enzyme conjugate that binds to biotin, enabling colorimetric detection. |
| TMB Substrate Solution | 3,3',5,5'-Tetramethylbenzidine, a chromogenic HRP substrate that turns blue upon oxidation. |
| Stop Solution (1M H₂SO₄) | Acidic solution to terminate the HRP-TMB reaction, changing color from blue to yellow. |
| Wash Buffer (PBS + 0.05% Tween-20) | Buffered solution to remove unbound reagents between steps. |
| Sample Diluent (Assay Buffer) | Protein-rich buffer (e.g., with BSA) for diluting samples/standards to minimize non-specific binding. |
| Microplate Reader | Spectrophotometer capable of measuring absorbance at 450 nm (with 570 nm or 620 nm reference). |
Step-by-Step Methodology
- Reagent & Sample Preparation: Reconstitute standards as per kit instructions. Prepare sample dilutions in assay buffer (optimal dilution determined from Luminex results).
- Plate Setup: Add 100 µL of standards (in duplicate) and samples to the pre-coated plate. Include blank wells (assay buffer only). Incubate 2 hours at room temperature (RT).
- Wash: Aspirate and wash wells 4 times with 300 µL wash buffer using a plate washer or manual manifold.
- Detection Antibody: Add 100 µL of biotinylated detection antibody to each well. Incubate 1 hour at RT. Wash as in Step 3.
- Enzyme Conjugate: Add 100 µL of Streptavidin-HRP solution to each well. Incubate 30 minutes at RT, protected from light. Wash as in Step 3.
- Substrate Reaction: Add 100 µL of TMB substrate to each well. Incubate for exactly 15-20 minutes at RT (monitor for color development).
- Stop Reaction: Add 100 µL of stop solution to each well. The color will change from blue to yellow.
- Read Plate: Measure the absorbance at 450 nm within 30 minutes using a plate reader. Subtract the reference wavelength (570 nm or 620 nm) reading.
- Data Analysis: Generate a 4- or 5-parameter logistic (4PL/5PL) standard curve. Interpolate sample concentrations from the curve. Perform correlation analysis (e.g., Pearson's r) with Luminex-derived data.
Data Analysis & Interpretation Pathway
Diagram 2: ELISA Data Analysis and Validation Decision Path
For thesis research comparing analytical platforms, ELISA remains the gold standard for validating cytokine targets identified via high-throughput Luminex screening. Its focused design ensures reliable, precise, and defensible quantitative data for key analytes, forming a critical foundation for robust scientific conclusions in drug development and biological research.
Application Note: Luminex in the Discovery Phase
Within the context of a thesis comparing ELISA to Luminex, the discovery phase presents a prime application for Luminex technology. Discovery research, particularly in immunology, oncology, and infectious disease, requires the simultaneous quantification of multiple analytes from limited sample volumes to identify novel biomarkers or signaling pathways.
Luminex xMAP (Multi-Analyte Profiling) technology fulfills this need via multiplexed, bead-based immunoassays. Unlike traditional ELISA, which measures a single cytokine per well, Luminex allows for the concurrent measurement of up to 500 targets in a single microplate well (theoretically), with practical panels ranging from 10 to 100 analytes. This multiplex capability is critical for constructing comprehensive cytokine/chemokine profiles from precious preclinical samples (e.g., tumor microenvironment fluid, cerebral spinal fluid) where volume is severely limited.
A key advantage is the ability to uncover complex, non-linear relationships between biomarkers without a priori assumptions. For example, discovering that a specific combination of IL-6, IL-10, and MCP-1, rather than a single cytokine, correlates with disease progression. This systems-level view accelerates hypothesis generation.
Table 1: Comparative Throughput in Discovery Phase
| Metric | Singleplex ELISA | Luminex Multiplex (15-plex panel) |
|---|---|---|
| Sample Volume Required (for 15 targets) | 150 µL (10 µL/assay x 15) | 25-50 µL (single well) |
| Time to Acquire 15 Data Points | ~2-3 days (serial processing) | ~3-4 hours (parallel processing) |
| Data Point Generation Rate | Low | High |
| Primary Application Stage | Target Validation, Low-plex confirmation | Broad Biomarker Discovery, Pathway Mapping |
Application Note: Luminex in High-Throughput Screening (HTS)
In drug development, HTS of compound libraries or biologicals requires rapid, reproducible, and information-rich readouts. Luminex is adapted for HTS to identify leads that modulate specific cytokine signatures or signaling pathways. Modern automated liquid handlers and plate washers can process 96- or 384-well Luminex assays, integrating them into robotic screening platforms.
The technology's strength in HTS lies in its multi-parametric output, which increases the information content per well and reduces false positives/negatives associated with single-endpoint assays. For instance, screening for an anti-inflammatory therapeutic can simultaneously monitor desired suppression of TNF-α and IL-1β while ensuring no undesirable suppression of regulatory IL-10 or cytotoxic IFN-γ. This provides an early functional profile of hits.
Current platforms, such as the Luminex FLEXMAP 3D, can analyze up to 500 beads per second, enabling rapid plate reading. Furthermore, validated, commercially available kits ensure reproducibility across large screening campaigns.
Table 2: HTS Suitability: ELISA vs. Luminex
| Parameter | ELISA (Singleplex) | Luminex (Multiplex) | Impact on HTS |
|---|---|---|---|
| Assay Density (Data per well) | 1 | 10-50 | Higher content, fewer wells |
| Reagent Cost per Data Point | Low | Lower (in multiplex) | Reduced cost for multi-parameter screens |
| Automation Compatibility | Moderate | High (96/384-well) | Enables robotic screening |
| Hit Identification Confidence | Single-target | Multi-target signature | Reduces false leads |
Experimental Protocols
Protocol 1: Multiplex Cytokine Profiling for Discovery Using a Magnetic Bead Kit
Objective: To simultaneously quantify 30 cytokines from a conditioned cell culture supernatant to identify novel response signatures.
Materials:
- Luminex xMAP Magnetic Bead Kit (30-plex human cytokine panel)
- Cell culture supernatants (undiluted, cleared by centrifugation)
- Assay Buffer, Wash Buffer, Detection Antibodies, Streptavidin-PE
- Luminex plate washer (or magnetic separation stand)
- Luminex analyzer (e.g., MAGPIX, FLEXMAP 3D)
- Data analysis software (xPONENT, Belysa)
Methodology:
- Bead Preparation: Vortex magnetic bead stock for 60 sec. Add bead mixture to each well of a 96-well plate.
- Wash: Place plate on magnetic separator for 60 sec. Decant supernatant. Wash twice with Wash Buffer.
- Standard & Sample Addition: Add 50 µL of standard (serial dilution) or pre-cleared sample to appropriate wells. Include background and QC controls.
- Incubation: Seal plate. Incubate for 2 hours at room temperature (RT) on a plate shaker (~800 rpm).
- Wash: Perform 3 wash steps as in step 2.
- Detection Antibody Incubation: Add 25 µL of biotinylated detection antibody mixture to each well. Incubate for 1 hour at RT on shaker.
- Wash: Perform 3 wash steps.
- Streptavidin-PE Incubation: Add 50 µL of Streptavidin-PE to each well. Incubate for 30 minutes at RT on shaker, protected from light.
- Wash: Perform 3 wash steps.
- Resuspension: Add 100-150 µL of Drive Fluid/Sheath to each well. Resuspend beads on shaker for 5 min.
- Acquisition: Read plate on Luminex analyzer. A minimum of 50 beads per region (analyte) is required for statistical robustness.
Protocol 2: High-Throughput Screening for Modulators of a Specific Cytokine Pathway
Objective: To screen a 10,000-compound library for agents that inhibit IL-6, IL-8, and MCP-1 secretion from LPS-stimulated THP-1 cells in a 384-well format.
Materials:
- THP-1 monocyte cell line
- LPS (for stimulation)
- 384-well cell culture plates
- Compound library (in DMSO)
- Automated liquid handling system
- Luminex 3-plex magnetic bead kit (IL-6, IL-8, MCP-1)
- 384-well compatible magnetic washer
- High-throughput Luminex reader
Methodology:
- Cell Plating & Compound Addition: Using an automated liquid handler, dispense 2000 THP-1 cells/well in 25 µL medium into 384-well plates. Pin-transfer 100 nL of compound (or DMSO control) into each well. Pre-incubate for 1 hour.
- Stimulation: Add 25 nL of LPS (final concentration 100 ng/mL) to each well using a nanoliter dispenser. Incubate plates for 18-24 hours at 37°C, 5% CO2.
- Supernatant Harvest: Centrifuge plates (300 x g, 5 min). Using the liquid handler, transfer 10 µL of supernatant from each well to a corresponding well in a new 384-well assay plate.
- Automated Luminex Assay: Perform the multiplex assay (as in Protocol 1) using a fully automated workflow: bead addition, washing, reagent incubation, and final resuspension.
- High-Speed Reading: Load plates into the Luminex analyzer configured for 384-well plates and high-speed acquisition.
- Data Analysis: Normalize cytokine levels in compound wells to DMSO-stimulated controls (100% response). Apply a hit threshold (e.g., >50% inhibition in all 3 analytes) to identify primary leads. Use Z'-factor calculations to validate assay quality for HTS.
Visualizations
Luminex Workflow for Biomarker Discovery
Logic of Multiplexed Hit Identification in HTS
TLR4 Pathway & Multiplexed Cytokine Output
The Scientist's Toolkit: Key Research Reagent Solutions
Table 3: Essential Materials for Luminex-Based Discovery & Screening
| Item | Function & Relevance |
|---|---|
| Magnetic Bead-Based Multiplex Kits | Pre-optimized, validated panels (e.g., 10- to 100-plex) for specific pathways (inflammation, neurodegeneration). Essential for consistent, high-quality discovery data. |
| Automated Magnetic Plate Washer | Provides reproducible, hands-off washing of magnetic beads in 96- or 384-well formats, critical for HTS robustness and minimizing bead loss. |
| Luminex Calibration and QC Kits | For daily instrument calibration and performance verification, ensuring data accuracy across long screening campaigns. |
| High-Performance Data Analysis Software | Software like Milliplex Analyst or Belysa that manages 5-PL curve fitting, calculates concentrations, and handles large HTS data sets. |
| Assay Buffer Systems | Matrix-optimized buffers for specific sample types (e.g., serum, plasma, cell culture) to minimize interference and improve recovery. |
| Multichannel and Electronic Pipettes | For accurate, repetitive reagent dispensing during manual or semi-automated protocol steps. |
| Plate Seals and Foils | Prevents evaporation and contamination during crucial incubation steps, ensuring well-to-well consistency. |
| Standardized Reference Samples (QC) | Run-to-run quality control samples to monitor inter-assay precision and validate plate-to-plate comparisons in HTS. |
In the comparative research of ELISA versus Luminex multiplex immunoassays for cytokine quantification, the selection and proper preparation of biological sample matrices are critical variables that directly impact assay performance, data accuracy, and cross-platform comparability. Serum, plasma, and cell culture supernatants each possess distinct biochemical compositions that can influence antigen stability, epitope recognition, and generate matrix effects leading to signal interference. This application note details the considerations and protocols for handling these sample types within the context of a rigorous methodological comparison.
Key Characteristics and Comparative Data
Table 1: Comparative Analysis of Sample Matrices for Cytokine Assays
| Characteristic | Serum | Plasma (EDTA) | Cell Culture Supernatant |
|---|---|---|---|
| Clotting Factors | Consumed during clot formation | Present (anticoagulated) | Absent |
| Fibrinogen | Largely absent | Present | Absent |
| Platelet-derived Factors | Released (e.g., TGF-β, PF4) | Minimal if processed rapidly | Absent |
| Complement Activity | Activated during clotting | Mostly intact | Absent |
| Common Additives | None (clot activator) | EDTA, Heparin, Citrate | FBS, BSA, Antibiotics |
| Typical Dilution Range | 1:2 to 1:10 | 1:2 to 1:10 | Often undiluted or 1:2 |
| Primary Matrix Concern | Hemolysis, clotting time variability | Residual platelets, anticoagulant interference | High protein/albumin, phenol red |
| Optimal Processing | Allow 30-60 min clot, centrifuge >1000g | Centrifuge promptly 15-30 min post-collection | Centrifuge to remove cells, aliquot, sterile filter if needed |
| Stability at -80°C | Generally high for most cytokines | Generally high; avoid freeze-thaw | Variable; depends on cytokine & media |
Table 2: Impact of Sample Type on Assay Platform Performance (Representative Data)
| Interference Type | Effect on ELISA | Effect on Luminex | Most Affected Sample |
|---|---|---|---|
| Hemoglobin (>0.5 g/dL) | ↑ Background, Quenching | ↓ MFI (absorbance), ↑ CV | Serum, Plasma |
| Lipids (Gross lipemia) | ↑ Background, optical | Potential bead aggregation | Serum, Plasma |
| Heterophilic Antibodies | ↑ False positive | ↑ False positive (some beads) | Serum > Plasma |
| Fibrin Clots/Microclots | Well-to-well variability | Bead clogging in analyzer | Plasma (poorly processed) |
| Anticoagulants (e.g., Heparin) | Minimal effect | Can interfere with bead coupling chemistry | Plasma |
| High Albumin (>5 g/dL) | Possible nonspecific binding | Can increase background MFI | Supernatant (with FBS) |
| Phenol Red | Significant absorbance at 540nm | Minimal effect on laser/fluorescence | Supernatant |
Detailed Protocols for Sample Collection and Preparation
Protocol 3.1: Serum Preparation for Cytokine Analysis
Objective: To obtain cell- and fibrin-free serum suitable for ELISA and Luminex. Materials: Blood collection tube (serum separator/clot activator), sterile pipettes, centrifuge, polypropylene cryovials.
- Collect whole blood by venipuncture into serum separator tube.
- Invert tube 5-10 times gently for mixing.
- Incubate upright at room temperature (RT) for 30-60 minutes to allow complete clot formation.
- Centrifuge at 1,200-2,000 x g for 10-15 minutes at 4°C (or RT if processing immediately).
- Carefully aspirate the clear supernatant (serum) using a pipette, avoiding the clot and buffy coat layer.
- Aliquot immediately into polypropylene cryovials to avoid freeze-thaw cycles.
- Flash-freeze in liquid nitrogen or on dry ice and store at ≤ -80°C. Critical Note: Hemolyzed samples should be noted and avoided for quantitative analysis.
Protocol 3.2: Plasma (EDTA) Preparation for Cytokine Analysis
Objective: To obtain platelet-poor plasma, minimizing platelet-derived cytokine release. Materials: Blood collection tube (K2EDTA), sterile pipettes, refrigerated centrifuge, polypropylene cryovials.
- Collect whole blood into pre-chilled K2EDTA tube.
- Invert tube 8-10 times gently for immediate mixing with anticoagulant.
- Process samples within 30 minutes of collection.
- Centrifuge at 1,500-2,000 x g for 15 minutes at 4°C.
- Aspirate the plasma layer, carefully avoiding the buffy coat (white cell layer).
- For optimal platelet removal, perform a second centrifugation of the aspirated plasma at 2,500 x g for 10 minutes at 4°C.
- Aliquot and flash-freeze as in Protocol 3.1. Critical Note: Heparin or citrate plasma can be used but requires validation, as anticoagulants can variably affect different immunoassays.
Protocol 3.3: Cell Culture Supernatant Preparation
Objective: To harvest sterile, cell-free supernatant from stimulated cell cultures. Materials: Cell culture vessel, sterile conical tubes, centrifuge, 0.22 µm syringe filter (optional), cryovials.
- Stimulate cells (e.g., PBMCs, cell lines) as per experimental design.
- At designated time point, transfer culture medium to a sterile conical tube.
- Centrifuge at 300-500 x g for 5 minutes at 4°C to pellet cells.
- Transfer supernatant to a new tube.
- Optional for complete clarification: Centrifuge a second time at 10,000 x g for 5 minutes or filter through a 0.22 µm low-protein-binding membrane.
- Aliquot and freeze at ≤ -80°C. Avoid repeated freeze-thaw. Critical Note: Account for high background protein (e.g., FBS) by including appropriate control media blanks in the assay.
General Protocol for Assessing Matrix Effects in Comparative Studies
Objective: To evaluate and normalize for matrix interference when comparing ELISA and Luminex.
- Prepare a standard curve of recombinant cytokines in the recommended assay diluent (e.g., PBS-BSA).
- Spike the same known concentrations of cytokines into pools of (a) normal serum, (b) normal plasma, and (c) culture media (with FBS).
- Run both ELISA and Luminex assays in parallel using these spiked samples and the standard curve in diluent.
- Calculate the percent recovery for each sample matrix:
[Measured Concentration in Spike / Expected Spike Concentration] x 100. - Determine the optimal required dilution for each matrix where recovery falls between 80-120%.
- Validate this dilution for all subsequent experiments.
Visualizations
Sample Processing Workflow for Immunoassays
Common Matrix Interferences on Assay Signal
The Scientist's Toolkit: Essential Research Reagents and Materials
Table 3: Key Reagent Solutions for Sample Handling and Analysis
| Item | Function & Importance | Recommended Specification/Example |
|---|---|---|
| Protease Inhibitor Cocktail | Prevents cytokine/chemokine degradation during processing. Critical for labile analytes (e.g., IL-1β, IL-6). | Broad-spectrum, EDTA-free if measuring metal-dependent analytes. |
| Polypropylene Cryovials | Storage vessels; minimize protein adsorption to tube walls. | Low protein-binding, sterile, internally threaded. |
| Assay Diluent (with protein) | Dilutes samples to minimize matrix effect; protein blocks nonspecific binding. | PBS or Tris-based with 1% BSA or proprietary commercial diluent. |
| Heterophilic Blocking Reagent | Blocks interfering human antibodies (HAMA, RF) that cause false positives. | Commercially available heterophile blocking tubes or solutions. |
| Recombinant Cytokine Standards | Generate standard curves for quantification in each matrix. | WHO international standards or vendor-matched master kits. |
| Matrix Spike & Recovery Controls | Validate assay performance in specific biological matrices. | Pre-formulated cytokine mixes for spiking into sample pools. |
| Sterile, Low-Binding Filters | Clarify cell culture supernatants without significant analyte loss. | 0.22 µm PVDF or PES membrane, low protein binding. |
| Multiplex Assay Buffer Kit | Specific buffer system for Luminex bead washing, dilution, and incubation. | Kit-matched buffers (e.g, Bio-Plex, MILLIPLEX kits) for optimal performance. |
Troubleshooting ELISA and Luminex: Solving Common Pitfalls and Enhancing Performance
Within a research thesis comparing ELISA and Luminex for cytokine quantification, a rigorous assessment must account for technical challenges inherent to each platform. For ELISA, three prevalent issues—high background, the hook effect, and plate variability—can critically compromise data reliability, leading to false conclusions in comparative analyses. This document details these challenges and provides optimized protocols to mitigate them, ensuring robust data for platform comparison.
High Background Signal
High background occurs when non-specific signal is detected in wells lacking the target analyte, reducing the assay's signal-to-noise ratio and dynamic range. In the context of cytokine comparison, high ELISA background can exaggerate sensitivity versus Luminex.
Primary Causes & Mitigation Protocols:
- Non-Specific Binding: Blocking is insufficient or incompatible.
- Optimized Protocol: Compare blocking buffers. Coat plate, then block with 300 µL/well of either 1% BSA in PBS, 5% non-fat dry milk in PBS, or a commercial protein-free blocker (e.g., Pierce SuperBlock) for 2 hours at 25°C. Wash. Include wells with only detection antibody. The blocker yielding the lowest signal in analyte-negative wells is optimal.
- Antibody Cross-Reactivity or Concentration: Detection antibodies bind non-specifically.
- Optimized Protocol: Perform a checkerboard titration for matched antibody pairs. Test 2x serial dilutions of capture antibody (e.g., 4 to 0.25 µg/mL) against dilutions of detection antibody (e.g., 2 to 0.0625 µg/mL) with a mid-range standard. Select the lowest combination giving maximal target signal with minimal background.
- Inadequate Washing: Residual unbound components cause signal.
- Optimized Protocol: Implement a stringent wash: Add 300 µL wash buffer (PBS with 0.05% Tween-20), let sit 30 seconds, aspirate completely, and blot firmly on clean lint-free paper. Repeat 5 times between all steps.
Hook Effect (High-Dose Hook Effect)
The hook effect manifests in sandwich ELISA when extremely high analyte concentrations saturate both capture and detection antibodies, preventing the formation of the "sandwich" and leading to a falsely low signal. This is a critical confounder when quantifying cytokines in samples with unknown, potentially high concentrations (e.g., serum from acute inflammation).
Identification and Resolution Protocol:
- Protocol for Detection: Always run samples at a minimum of two serial dilutions (e.g., neat, 1:10, 1:100). A decreasing signal with increasing sample concentration is diagnostic of the hook effect.
- Resolution Protocol: If a hook effect is suspected, further dilute the sample (e.g., 1:1000, 1:10,000) and re-assay. The measured concentration should increase proportionally with dilution until the hook zone is exited, then stabilize. The accurate reading is from the dilution that falls within the linear range of the standard curve.
Table 1: Simulated Data Illustrating the Hook Effect
| Sample Dilution | Raw OD (450 nm) | Apparent Concentration (pg/mL) | Corrected Concentration (pg/mL) |
|---|---|---|---|
| Neat | 1.05 | 150 | -- |
| 1:10 | 2.80 | 1,200 | -- |
| 1:100 | 2.95 | 1,500 | 150,000 |
| 1:1,000 | 1.85 | 650 | 650,000 |
| 1:10,000 | 0.50 | 95 | 950,000 |
Note: Corrected concentration = Apparent concentration × Dilution Factor. The true concentration plateaus at the correct value once outside the hook effect zone (1:100 to 1:10,000 dilutions).
Plate Variability
Inter- and intra-plate variability increase data variance, reducing statistical power to detect true differences between ELISA and Luminex performance metrics like precision and reproducibility.
Causes and Standardization Protocols:
- Edge Effect (Evaporation): Wells on the plate perimeter evaporate faster, altering reaction kinetics.
- Protocol: Use a plate seal during all incubations. For critical assays, utilize only the inner 60 wells of a 96-well plate, using the outer wells for a uniform buffer or blank solution.
- Pipetting Inaccuracy: A major source of intra-plate CV.
- Protocol: Calibrate pipettes monthly. For standard curve generation, use a reverse pipetting technique for coating and detection antibody addition. For sample addition, pre-wet tips 3x with sample.
- Inconsistent Incubation: Temperature and time fluctuations.
- Protocol: Standardize incubation times using a timer and perform all steps in a temperature-controlled incubator or thermal shaker, not on an open bench.
Table 2: Impact of Mitigation Protocols on Plate Variability (Intra-Assay CV%)
| Assay Condition | Mean CV% (Across 10 Cytokines) |
|---|---|
| Standard Protocol (Bench) | 12.5% |
| With Sealing & Inner Wells Only | 8.2% |
| With Sealing, Inner Wells, & Calibrated Pipetting | 5.1% |
Experimental Protocols for Comparative Thesis Research
Protocol A: Side-by-Side Assay for Hook Effect Assessment.
- Sample Prep: Prepare a high-concentration cytokine stock (≥10x the ELISA kit's maximum standard). Create 8 serial dilutions in sample matrix.
- ELISA Setup: Run all dilutions per kit instructions, but include an extra high-concentration point beyond the standard curve.
- Data Analysis: Plot signal vs. log concentration. Identify the plateau or decrease in signal indicating the hook effect. Report the validated working range.
Protocol B: Inter-Plate Reproducibility Test.
- Control Samples: Prepare three quality control (QC) samples (Low, Mid, High concentration) in assay diluent.
- Run Design: Include these QC samples in duplicate on three separate ELISA plates run on different days by two operators.
- Statistical Analysis: Calculate inter-plate and inter-operator CV% for each QC. A CV% <15% is typically acceptable.
Visualizations
Title: ELISA Hook Effect Mechanism
Title: ELISA QC Experimental Workflow
The Scientist's Toolkit: Key Reagent Solutions
| Item | Function in Mitigating ELISA Challenges |
|---|---|
| High-Affinity, Monoclonal Antibody Pairs | Minimize non-specific binding and broaden dynamic range to reduce hook effect risk. |
| Protein-Free Blocking Buffer | Reduces background vs. protein-based blockers by eliminating cross-reactivity. |
| Pre-Coated, Validated Plates | Reduces plate-to-plate variability from coating inconsistencies. |
| Stable, Lyophilized Standards | Provides consistency for standard curves across multiple assay runs. |
| HRP-Streptavidin & High-Sensitivity Chemiluminescent Substrate | Amplifies signal selectively, improving signal-to-noise for low-abundance cytokines. |
| Automated Plate Washer | Ensures consistent and complete washing to lower background and variability. |
1. Introduction Within the comparative framework of a thesis evaluating ELISA versus Luminex for cytokine quantification, optimizing the enzyme-linked immunosorbent assay (ELISA) is paramount for ensuring data accuracy and reliability. This protocol details the critical steps of antibody pair selection, blocking, and detection to maximize assay sensitivity and specificity, thereby providing a robust foundation for comparative method analysis.
2. Antibody Pair Selection The cornerstone of a sandwich ELISA is the matched antibody pair. Careful selection is required to prevent cross-competition and ensure high specificity for the target cytokine.
Key Criteria:
- Epitope Recognition: The capture and detection antibodies must bind to non-overlapping epitopes on the target antigen.
- Affinity & Specificity: Use high-affinity monoclonal antibodies to minimize non-specific binding.
- Species & Isotype: Paired antibodies should be raised in different host species or of different isotypes to minimize interference during detection.
Validation Protocol:
- Coat wells with a range of capture antibody concentrations (1-10 µg/mL in PBS, 100 µL/well) overnight at 4°C.
- Block and add a fixed concentration of recombinant cytokine standard.
- Test a titration series of the proposed detection antibody.
- Select the pair and concentration combination yielding the highest signal-to-noise (S/N) ratio and the lowest limit of detection (LOD) in the standard curve.
3. Blocking Strategies Effective blocking eliminates non-specific binding sites on the plate after capture antibody coating. The optimal agent depends on the sample matrix and antibody pair.
- Common Blocking Buffers:
| Blocking Agent | Typical Concentration | Primary Function & Use Case |
|---|---|---|
| BSA (Bovine Serum Albumin) | 1-5% (w/v) in PBS | Inert protein blocker; universal choice for most serum-based assays. |
| Non-Fat Dry Milk | 1-5% (w/v) in PBS | Contains casein; cost-effective but can contain biotin and phosphatases. |
| Casein | 1-2% (w/v) in PBS | Pure form of milk protein; low background, compatible with biotin-streptavidin systems. |
| Fish Skin Gelatin | 0.1-1% (w/v) in PBS | Low cross-reactivity with mammalian antibodies; suitable for complex samples. |
| Commercial Blockers | As per manufacturer | Often contain polymers and additives for aggressive blocking of challenging targets. |
- Optimization Protocol:
- Coat and wash plate as standard.
- Apply different blocking buffers (200 µL/well) to separate wells. Incubate for 1-2 hours at room temperature (RT).
- Add a high sample matrix control (e.g., 10% serum) and a negative control. Proceed with standard detection.
- Select the blocker yielding the lowest background signal for the matrix control while maintaining the positive control signal.
4. Detection System Optimization The detection system amplifies the specific signal. The choice between direct and indirect detection impacts sensitivity and workflow.
Direct vs. Indirect Detection:
- Direct: Detection antibody is conjugated directly to an enzyme (e.g., HRP). Faster, fewer steps, less non-specific binding risk.
- Indirect: Detection antibody is unconjugated and is bound by a secondary enzyme-conjugated antibody. Offers signal amplification and flexibility.
Enhanced Signal Generation Protocol (for Indirect Detection):
- After sample incubation, add biotinylated detection antibody (recommended starting concentration: 0.5-2 µg/mL in blocking buffer). Incubate 1-2 hours at RT.
- Wash 3x.
- Add streptavidin-poly-HRP conjugate (typically 1:5000 to 1:20000 dilution). Incubate 20-30 minutes at RT. Poly-HRP provides multiple enzyme molecules per binding event, significantly amplifying signal.
- Wash 3x.
- Develop with high-sensitivity chemiluminescent substrate (e.g., luminol-based) for maximal sensitivity, or a high dynamic range TMB substrate for colorimetric readout.
5. The Scientist's Toolkit: Key Reagent Solutions
| Item | Function in Optimized ELISA |
|---|---|
| High-Binding Polystyrene Plates | Solid phase for passive adsorption of capture antibodies. |
| Matched Antibody Pair (MAB) | Guarantees specific, non-competing capture and detection of the target analyte. |
| Recombinant Cytokine Standard | Provides a known-concentration analyte for generating the standard curve. |
| Biotinylated Detection Antibody | Enables use of high-sensitivity streptavidin-poly-HRP amplification. |
| Streptavidin-Poly-HRP Conjugate | Signal amplification reagent for enhanced sensitivity. |
| High-Sensitivity Chemiluminescent Substrate | Generates light signal upon HRP catalysis; read on a luminometer. |
| Plate Sealers & Plate Washer | Ensures consistent incubation and efficient, reproducible washing steps. |
6. Comparative Data: ELISA vs. Luminex The following table summarizes key performance metrics relevant to the thesis comparison, based on optimized protocols.
| Parameter | Optimized Sandwich ELISA | Luminex/xMAP Bead-Based Assay |
|---|---|---|
| Sample Volume | 50-100 µL | 25-50 µL |
| Multiplexing Capacity | Singleplex (typically) | High-plex (up to 50+ analytes) |
| Time to Result | 4-8 hours (manual) | 3-4 hours (hands-off incubation) |
| Dynamic Range | 3-4 logs | 3-5 logs |
| Sensitivity (LOD) | Very High (fg-pg/mL)* | High (pg/mL) |
| Throughput (Samples/Day) | Medium (10s-100s) | High (100s) |
| Cost per Data Point | Low | High |
*With poly-HRP/chemiluminescence.
7. Experimental Workflow Diagram
Title: Optimized Sandwich ELISA Protocol Workflow
8. Antibody Pair Selection Logic Diagram
Title: Logic Flow for ELISA Antibody Pair Selection
Within the broader thesis comparing ELISA and Luminex xMAP technology for cytokine quantification, this document addresses three critical, platform-specific challenges inherent to bead-based multiplex immunoassays: bead aggregation, spectral overlap, and matrix effects. Understanding and mitigating these issues is paramount for generating robust, reproducible data in drug development and translational research.
Issue 1: Bead Aggregation
Bead aggregation, the non-specific clumping of magnetic or polystyrene microspheres, reduces assay precision by distorting fluorescence readings and causing bead counting errors.
Preventative Protocol:
- Bead Resuspension: Prior to use, vortex bead stock for 60 seconds, then sonicate in a water bath sonicator for 30 seconds.
- Assay Buffer: Use a buffer containing 0.05% Tween-20 and 0.1% Bovine Serum Albumin (BSA) to minimize hydrophobic interactions.
- Wash Steps: Perform all wash steps using a magnetic plate separator. Ensure the plate is positioned on the magnet for 90 seconds before decanting. Add wash buffer (PBS + 0.05% Tween-20) along the side of the well to avoid disturbing the pellet.
- Post-Wash: After the final wash and before reading, resuspend beads in 100 µL of Sheath Fluid by pipetting up and down 10 times or plate shaking for 60 seconds at 1100 rpm.
Issue 2: Spectral Overlap
Spectral overlap (also called fluorescence spillover) occurs because the emission spectra of the fluorophores embedded in the beads (e.g., at 528 nm and 597 nm) are broad and can be detected by adjacent detectors, leading to cross-talk and inflated results for neighboring analytes.
Compensation Protocol:
- Single-Bead Controls: For each bead region in the panel, run a set of wells containing only that single bead population with its corresponding detection antibody.
- Instrument Calibration: Using the Luminex xPONENT or FLEXMAP 3D software, run the "CAL2" and "CAL3" calibration routines with appropriate performance verification kits.
- Software Compensation: Analyze single-bead control data using algorithm-based compensation tools in analysis software (e.g., Bio-Plex Manager, xPONENT, or third-party tools like FlowJo). The software generates a spectral compensation matrix which is automatically applied to correct MFI values in experimental samples.
- Validation: Post-compensation, re-analyze single-bead controls to verify effective correction (target: <3% residual spillover).
Table 1: Impact of Spectral Overlap Correction on Measured MFI
| Bead Region | Target Cytokine | MFI (Uncompensated) | MFI (Compensated) | % Change |
|---|---|---|---|---|
| 35 | IL-6 | 15,250 | 14,800 | -3.0% |
| 36 | IL-1β | 22,400 | 18,150 | -19.0% |
| 37 | TNF-α | 8,950 | 9,120 | +1.9% |
| 38 | IL-10 | 12,300 | 11,990 | -2.5% |
Issue 3: Matrix Effects
Matrix effects arise when components of the sample (e.g., lipids, heterophilic antibodies, complement, or other proteins) interfere with antibody binding, leading to suppression or enhancement of the signal.
Assessment and Mitigation Protocol:
- Spike-and-Recovery Experiment:
- Prepare a standard curve in a clean, protein-based assay diluent.
- Spike a known concentration (preferably near the mid-point of the standard curve) of each recombinant cytokine into both the clean diluent and a representative set of undiluted biological matrices (e.g., serum, plasma, tissue homogenate supernatant).
- Run the assay and calculate the measured concentration in the spiked samples.
- Recovery (%) = (Measured conc. in matrix / Measured conc. in diluent) x 100.
- Acceptable recovery is typically 80-120%.
- Mitigation Strategies:
- Sample Dilution: Dilute samples (e.g., 1:2, 1:4) in assay diluent. This often dilutes out interfering substances.
- Alternative Matrix: Use a specialized diluent designed to block heterophilic antibodies (e.g., containing polyvinylalcohol, polyvinylpyrrolidone, or commercial blockers).
- Sample Pre-treatment: For lipemic or hemolyzed samples, clarify by ultracentrifugation (100,000 x g, 30 min) or filtration.
Table 2: Results of Spike-and-Recovery in Different Matrices
| Cytokine | Spiked Conc. (pg/mL) | Recovery in Serum (%) | Recovery in Plasma (EDTA) (%) | Recovery after 1:4 Dilution (%) |
|---|---|---|---|---|
| IL-2 | 100 | 65 | 72 | 98 |
| IL-6 | 200 | 112 | 105 | 102 |
| IL-8 | 250 | 45 | 58 | 95 |
| TNF-α | 150 | 135 | 125 | 106 |
Visualizations
The Scientist's Toolkit: Essential Research Reagent Solutions
| Item | Function in Luminex Assays |
|---|---|
| Magnetic Microspheres | Antibody-conjugated, spectrally distinct beads that capture specific analytes. The core reagent for multiplexing. |
| Bio-Plex or xMAP Assay Buffer | Optimized buffer containing blockers to reduce non-specific binding and bead aggregation. |
| PBS-Tween Wash Buffer (0.05%) | Standard wash solution for removing unbound protein while minimizing bead loss. |
| Sheath Fluid | Specific fluid for suspending beads during hydrodynamic focusing in the analyzer. Essential for stable reading. |
| Spectrally-Matched PE-Conjugate | Streptavidin-Phycoerythrin (PE) is the universal fluorescent reporter. Must be titrated for optimal signal. |
| Commercial Heterophilic Blocking Reagent | Contains inert immunoglobulins to minimize interference from human anti-mouse antibodies (HAMA) or other heterophiles. |
| Multiplex-Compatible Calibration Beads | Beads with known quantities of fluorophore for daily instrument performance verification and calibration. |
| Plate Sealer, Foil | Prevents evaporation and contamination during incubation steps, which is critical for consistency. |
This application note provides detailed protocols for optimizing key parameters in Luminex xMAP bead-based multiplex immunoassays. The content is framed within a broader comparative research thesis evaluating the performance characteristics of Enzyme-Linked Immunosorbent Assay (ELISA) versus Luminex technology for cytokine quantification. While ELISA offers robust single-plex data, Luminex multiplexing provides superior throughput for complex biological studies and drug development, albeit with optimization challenges in bead count, sample dilution, and instrument settings to ensure data accuracy and precision.
Table 1: Recommended Bead Count and Sample Dilution Ranges for Cytokine Assays
| Parameter | Recommended Range | Impact on Assay Performance | Rationale |
|---|---|---|---|
| Beads per Well | 50 - 100 beads per region | CV < 10%, robust median fluorescence intensity (MFI) | Higher counts improve statistical reliability; >100 can cause bead aggregation. |
| Sample Volume | 50 µL (standard) | Optimal signal-to-noise ratio | Compatible with most commercial kits; ensures sufficient analyte capture. |
| Serum/Plasma Dilution | 1:2 to 1:4 (initial) | Minimizes matrix interference | Reduces heterophilic antibody and protein effects. For specific high-abundance analytes, further dilution may be required (e.g., IL-6: 1:10). |
| Cell Culture Supernatant Dilution | Neat to 1:2 | Avoids signal saturation | Cytokine levels are often lower; dilution may be needed for activated cells. |
| Assay Buffer | Kit-specific diluent | Maintains consistent pH and ionic strength | Prevents non-specific binding. |
Table 2: Data Acquisition Settings on Luminex Analyzers (e.g., MAGPIX, FLEXMAP 3D)
| Setting | Typical Value | Optimization Goal |
|---|---|---|
| Sample Size | 50 - 100 µL | To identify a minimum of 50 beads per region. |
| Timeout | 60 seconds | Ensures all beads are counted without excessive run time. |
| Gate Settings | 7,000 - 15,000 (side scatter) | Excludes doublets, aggregates, and debris. |
| DD Gate | 5,000 - 25,000 | Identifies valid bead events based on fluorescence. |
| Bead Event Goal | Minimum 50 events per bead region | Achieves statistical significance for MFI calculation. |
Experimental Protocols
Protocol 1: Determining Optimal Bead Count
Objective: To establish the minimum bead count per analyte that yields reproducible Median Fluorescence Intensity (MFI) with a coefficient of variation (CV) < 10%.
Materials:
- Luminex magnetic bead kit (e.g., 25-plex human cytokine panel).
- Assay buffer, wash buffer, detection antibodies, streptavidin-PE.
- Pre-diluted cytokine standard cocktail.
- Luminex-compatible 96-well plate, plate sealer, plate washer (magnetic).
- Luminex analyzer (MAGPIX or equivalent).
Method:
- Bead Preparation: Vortex bead stock for 60 seconds. Sonicate for 30 seconds if aggregation is visible.
- Bead Titration: Prepare a bead master mix according to the kit protocol. Create a dilution series of the bead mix (1:1, 1:2, 1:4) in assay buffer.
- Assay Setup: a. Add 50 µL of each bead dilution to separate wells (n=4 per dilution). b. Add 50 µL of assay buffer to background wells and 50 µL of mid-range standard to sample wells. c. Follow the kit protocol for incubation with sample, detection antibody, and streptavidin-PE.
- Data Acquisition: Analyze the plate using standard instrument settings. Record the "Events" count for each bead region (analyte) from the analyzer software.
- Analysis: Calculate the mean and CV of the MFI for each analyte across the four replicates at each bead density. Plot bead events vs. MFI CV. The optimal bead count is the lowest density that maintains a CV < 10% for all analytes of interest.
Protocol 2: Optimizing Sample Dilution to Overcome Matrix Effects
Objective: To identify the appropriate sample dilution factor that falls within the linear range of the standard curve and minimizes matrix interference.
Materials:
- Test samples (human serum or plasma pools).
- Assay buffer (kit-specific).
- Standard curve diluent (matrix-matched if possible).
Method:
- Dilution Series: Prepare a serial dilution of the test sample (e.g., Neat, 1:2, 1:4, 1:8, 1:16) in the recommended assay buffer.
- Assay Run: Process the diluted samples alongside a standard curve in the same Luminex assay run, following Protocol 1 for the assay steps.
- Data Interpretation: a. Generate standard curves for each analyte (5-parameter logistic fit). b. Interpolate the concentration of each analyte in every sample dilution. c. For each analyte, identify the dilution factor where the measured concentration, when multiplied by the dilution factor, becomes consistent (parallels the ideal dilution line). This is the "optimal dilution zone." d. Samples with analyte concentrations above the assay's upper limit of quantification (ULOQ) must be diluted further. Samples with concentrations below the lower limit of quantification (LLOQ) should be reported as below detection or run at a lower dilution.
Protocol 3: Validating Data Acquisition Settings
Objective: To confirm that instrument settings (Gate, DD Gate, Timeout) are correctly configured to capture single-bead events and generate high-quality data.
Materials:
- Validation bead mix (e.g., Luminex Performance Validation Kit).
- Optimized bead master mix from Protocol 1.
Method:
- Run Validation Beads: Following manufacturer instructions, run the validation beads. Adjust the instrument's gate settings so that >95% of events from the validation beads fall within the designated gate, excluding debris.
- Optimize DD Gate: Using your optimized bead master mix, run a test well. Analyze the bead map (plot of bead region vs. fluorescence). Set the DD Gate to encompass the tight cluster of events for each bead region, excluding low-signal noise.
- Set Timeout: Run a sample with the target bead count. The Timeout should be long enough to count at least 50 beads per region but not excessively long. Typically, 45-90 seconds is sufficient for a 50µL sample draw.
- Document Settings: Once optimized, save these settings as a protocol file for consistent use in future experiments.
Visualizations
Diagram 1: Luminex vs ELISA Workflow Comparison
Title: ELISA vs Luminex Assay Workflow
Diagram 2: Key Parameters for Luminex Assay Optimization
Title: Three Pillars of Luminex Optimization
The Scientist's Toolkit: Essential Research Reagents and Materials
Table 3: Key Reagent Solutions for Luminex Assay Optimization
| Item | Function in Optimization | Example/Note |
|---|---|---|
| Magnetic Bead Kit | Contains analyte-specific antibody-coated beads. | Choose panels aligned with research goals (e.g., Human Cytokine 30-plex). |
| Assay Buffer | Diluent for samples/standards; reduces non-specific binding. | Often kit-specific; critical for maintaining consistent background. |
| Matrix-Matched Standard Diluent | Diluent for standard curve that mimics sample matrix. | Essential for accurate quantification in complex matrices like serum. |
| Wash Buffer | Removes unbound material during plate washing. | Use high-quality, filtered buffers to prevent bead clogging in analyzer. |
| Detection Antibody Cocktail | Biotinylated antibody mix for signal generation. | Must be validated for multiplex compatibility (no cross-reactivity). |
| Streptavidin-Phycoerythrin (SAPE) | Fluorescent reporter molecule. | Quality affects signal intensity; avoid prolonged exposure to light. |
| Validation Bead Kit | Verifies instrument performance and laser alignment. | Run periodically (e.g., weekly) to ensure data integrity. |
| Plate Sealer | Prevents evaporation and contamination during incubations. | Use adhesive seals compatible with shaking incubators. |
| Magnetic Plate Washer | Provides consistent and efficient bead washing. | Manual washing is possible but increases variability. |
| Quality Control Samples | (High, Mid, Low) analyte concentration. | Monitor inter-assay precision and kit performance over time. |
Data Analysis Software and Normalization Strategies for Both Platforms.
Application Notes and Protocols
Thesis Context: This protocol supports a comparative research thesis evaluating ELISA and Luminex xMAP bead-based assays for cytokine quantification, focusing on data acquisition, analysis, and critical normalization strategies to ensure robust, comparable data.
1. Data Analysis Software Overview Quantitative data from ELISA and Luminex require platform-specific software for reduction and initial analysis.
Table 1: Core Data Analysis Software for ELISA and Luminex
| Platform | Primary Analysis Software | Key Function | Output Format |
|---|---|---|---|
| ELISA | Spectrophotometer Software (e.g., SoftMax Pro, Gen5) | Fits standard curve (4/5-PL, linear), calculates sample concentration from mean absorbance. | .csv, .xls |
| Luminex | Instrument Software (xPONENT) | Acquires raw Median Fluorescence Intensity (MFI) for each bead region and analyte. | .csv, .xml |
| Luminex | Dedicated Analysis Suites (Milliplex Analyst, Bio-Plex Manager, Luminex xPONENT) | Performs bead verification, standard curve fitting (5-PL), and calculates sample concentration. | .csv, .pdf |
| Both | Statistical & Graphing Software (Prism, R, Python) | Advanced statistical analysis, cross-platform data merging, and visualization. | Various |
2. Normalization Strategies Protocol Normalization corrects for technical variability (pipetting, instrument drift) to enable accurate cross-plate and cross-platform comparisons.
Protocol 2.1: Inter-Plate Normalization for ELISA Objective: Correct for assay-to-assay variation when samples are run across multiple 96-well plates. Materials: Recombinant cytokine standard, Assay Diluent, Control Samples (pooled experimental sample or commercial control). Procedure:
- Include a full standard curve and at least 2-3 control samples (in duplicate) on every assay plate.
- Run samples and standards according to optimized ELISA protocol.
- For each plate, generate a standard curve and calculate the concentration of the control samples.
- Determine a Plate Correction Factor (PCF): PCF = [Mean Expected Control Conc.] / [Mean Observed Control Conc. for Plate X].
- Multiply all calculated sample concentrations from Plate X by its PCF.
Protocol 2.2: Intra- and Inter-Assay Normalization for Luminex Objective: Account for bead count variability and plate-to-plate variation. Materials: Luminex bead kit, validation reagents. Procedure: A. Bead Count Normalization (Fundamental): The instrument software automatically reports events/bead count. Accept only data where bead count >50 beads per region. Low counts require re-analysis. B. Control-Based Normalization (Similar to ELISA):
- Include identical standard curves and control samples on every plate.
- Calculate control sample concentrations per plate via the software's curve fit.
- Apply a Plate Correction Factor (as in 2.1) to all sample results from that plate. C. Sample Volume/Matrix Normalization (Advanced): For complex matrices (e.g., serum, tissue lysate), normalize to total protein concentration (via BCA assay) and report results as pg/mg protein.
Protocol 2.3: Cross-Platform Data Harmonization for Thesis Comparison Objective: Enable direct statistical comparison of cytokine concentrations derived from ELISA and Luminex. Materials: Final normalized concentration datasets from both platforms. Procedure:
- Data Compilation: Export all normalized concentration data into a single statistical software file (e.g., Prism, R dataframe).
- Unit Alignment: Ensure all data are in identical units (e.g., pg/mL).
- Log Transformation: Apply a log10 transformation to the concentration data to stabilize variance and normalize distributions for parametric testing.
- Statistical Comparison: Perform paired statistical analyses (e.g., Bland-Altman analysis, Passing-Bablok regression, paired t-test) on the log-transformed data from matched samples.
The Scientist's Toolkit: Research Reagent Solutions
| Item | Function in Context |
|---|---|
| Recombinant Cytokine Standard | Provides the known quantities for generating the standard curve, essential for quantifying unknowns. |
| Assay Diluent (Matrix-Matched) | Used to reconstitute standards and dilute samples; matches sample matrix to minimize interference. |
| Pooled Experimental Sample Control | A pool of study samples aliquoted and frozen; serves as a longitudinal control for inter-plate normalization. |
| Commercial Quality Control Serum | Pre-characterized control sample with known analyte ranges to monitor assay performance. |
| Microsphere Bead Regions (Luminex) | Uniquely fluorescent-coded beads, each conjugated to a capture antibody for a specific cytokine. |
| Sheath Fluid (Luminex) | Fluidics system medium that hydrodynamically focuses beads for single-file laser interrogation. |
| Total Protein Assay Kit (e.g., BCA) | For normalizing cytokine levels in tissue homogenates or cell lysates to total protein content. |
Visualizations
Head-to-Head Comparison: Validation, Sensitivity, Throughput, and Cost-Benefit Analysis
Introduction Within the broader thesis comparing ELISA and Luminex xMAP technologies for cytokine quantification, a direct, experimental comparison of core analytical performance metrics is critical. This application note provides detailed protocols and data for head-to-head evaluation of sensitivity, dynamic range, and precision for both platforms, guiding researchers in selecting the optimal method for their specific drug development or research needs.
Research Reagent Solutions (The Scientist's Toolkit)
| Item | Function | Example (Cytokine Panel) |
|---|---|---|
| Matched Antibody Pair (ELISA) | Capture and detection antibodies specifically validated for sandwich immunoassay. | IFN-γ, IL-6, TNF-α antibody pairs. |
| Quantikine ELISA Kit | A complete, optimized kit containing pre-coated plates, standards, antibodies, and buffers. | R&D Systems DuoSet ELISA. |
| Luminex Magnetic Bead Panel | MagPlex beads dyed with precise ratios of two fluorophores, each conjugated to a unique capture antibody. | Bio-Plex Pro Human Cytokine 8-plex. |
| Bio-Plex Array Reader | A Luminex instrument with a dual laser system to identify beads (classification) and quantify analyte (reporter fluorescence). | Bio-Plex 200 or MAGPIX. |
| Calibration & Validation Bead Kit | Microspheres for verifying instrument performance, ensuring accurate bead classification and fluorescence quantification. | Luminex CAL2 & VAL3 beads. |
| Assay Buffer (for Beads) | Matrix-optimized buffer to reduce non-specific binding and matrix effects in complex samples. | Bio-Plex Cell Lysis Kit / Serum Matrix. |
| Plate Shaker with Heated Lid | Ensures consistent bead suspension during incubation and prevents evaporation. | ThermoMixer C with 96-well block. |
| Multichannel Pipette & Plate Washer | Essential for reproducible liquid handling and efficient washing steps in both protocols. | 8- or 12-channel pipette; magnetic plate washer for beads. |
Experimental Protocol 1: Sandwich ELISA for Cytokine Quantification
Objective: Quantify a single cytokine (e.g., IL-6) in cell culture supernatant with high precision.
Methodology:
- Coating: Dilute capture antibody in carbonate coating buffer. Add 100 µL/well to a 96-well microplate. Seal and incubate overnight at 4°C.
- Washing & Blocking: Aspirate and wash plate 3x with PBS + 0.05% Tween-20 (Wash Buffer). Add 300 µL/well of blocking buffer (e.g., PBS + 1% BSA + 5% sucrose). Incubate 1 hour at room temperature (RT). Wash 3x.
- Sample & Standard Incubation: Add 100 µL/well of sample or serially diluted recombinant cytokine standard (in sample diluent). Incubate 2 hours at RT. Wash 3x.
- Detection Antibody Incubation: Add 100 µL/well of biotinylated detection antibody (diluted in diluent). Incubate 2 hours at RT. Wash 3x.
- Streptavidin-Enzyme Conjugate: Add 100 µL/well of streptavidin-HRP (diluted per manufacturer). Incubate 20 minutes at RT (in dark). Wash 3x.
- Substrate & Stop: Add 100 µL/well of TMB substrate. Incubate 5-20 minutes for color development. Add 50 µL/well of stop solution (e.g., 2N H₂SO₄).
- Readout: Immediately measure absorbance at 450 nm (with 570 nm or 540 nm correction) on a plate reader.
Experimental Protocol 2: Luminex Multiplex Assay for Cytokine Quantification
Objective: Simultaneously quantify a panel of cytokines (e.g., IL-1β, IL-6, IL-10, TNF-α) in the same sample.
Methodology:
- Bead Preparation: Vortex and sonicate magnetic bead cocktail. Add 50 µL of beads/well to a 96-well plate. Wash 2x with Wash Buffer using a magnetic plate separator.
- Sample & Standard Incubation: Add 50 µL of sample or serially diluted multiplex standard (in assay buffer) to beads. Seal plate and incubate for 1-2 hours at RT on a plate shaker (~800 rpm). Wash 2x.
- Detection Antibody Incubation: Add 50 µL of biotinylated detection antibody cocktail. Incubate for 30-60 minutes at RT on shaker. Wash 2x.
- Streptavidin-Phycoerythrin (SAPE): Add 50 µL of SAPE (diluted in assay buffer). Incubate for 10-30 minutes at RT on shaker (in dark). Wash 2x.
- Resuspension: Add 100-125 µL of Sheath Fluid or Drive Fluid to resuspend beads.
- Readout: Analyze on a Luminex analyzer (e.g., MAGPIX, Bio-Plex 200). A minimum of 50 events per bead region are collected. The instrument identifies each bead by its internal fluorescence and reports the median fluorescence intensity (MFI) of the SAPE signal for each analyte.
Data Presentation: Comparative Metrics for IL-6 Quantification
Table 1: Direct Comparison of Key Performance Metrics (Representative Data)
| Metric | Sandwich ELISA | Luminex xMAP (from an 8-plex) |
|---|---|---|
| Assay Type | Singleplex | Multiplex |
| Sample Volume | 50-100 µL | 25-50 µL |
| Hands-on Time | High | Medium |
| Time to Result | ~6-8 hours | ~4 hours |
| Sensitivity (LoD) | 0.5 - 2.0 pg/mL | 1.0 - 5.0 pg/mL |
| Dynamic Range | 3 - 4 logs (e.g., 3.9 - 250 pg/mL) | 3 - 4 logs (e.g., 3.2 - 10,000 pg/mL) |
| Inter-Assay Precision (%CV) | 5 - 10% | 8 - 15% |
| Intra-Assay Precision (%CV) | 3 - 7% | 5 - 10% |
| Multiplexing Capacity | 1 | Up to 50+ |
Visualization of Experimental Workflows
ELISA Protocol Step-by-Step Workflow
Luminex Multiplex Protocol Workflow
Side-by-Side Comparison of Key Performance Metrics
Within a comprehensive thesis comparing ELISA and Luminex xMAP technology for cytokine quantification, this note details the critical throughput advantage of multiplexed immunoassays. While traditional ELISA remains a robust single-analyte workhorse, Luminex's bead-based platform enables the simultaneous measurement of up to 500 analytes in a single microplate well, dramatically increasing data density, conserving precious sample, and reducing labor and reagent costs. This application note provides protocols and data highlighting this fundamental advantage for researchers and drug development professionals.
Quantitative Comparison: ELISA vs. Luminex Throughput
Table 1: Core Throughput and Efficiency Metrics
| Parameter | Standard Sandwich ELISA | Luminex xMAP Assay |
|---|---|---|
| Analytes per Sample Well | 1 | 50-500 (typically 20-50 for cytokine panels) |
| Sample Volume per Analyte | 50-100 µL | 1-5 µL (shared across all analytes in panel) |
| Hands-on Time (for 10-plex) | ~10-12 hours (sequential) | ~4-5 hours (parallel) |
| Time to Data (for 10-plex) | 2-3 days | 1 day |
| Calibrators Required | Separate curve per analyte | Single shared curve per plate per analyte |
| Throughput (Data points/day) | ~40-80 (manual) | ~500-10,000+ |
Table 2: Representative Data from a 12-Plex Cytokine Study
| Cytokine | ELISA Mean Conc. (pg/mL) | Luminex Mean Conc. (pg/mL) | Correlation (R²) | Sample Vol. Used (ELISA vs Luminex) |
|---|---|---|---|---|
| IL-1β | 25.4 | 28.1 | 0.98 | 50 µL vs 4.2 µL* |
| IL-6 | 120.5 | 115.8 | 0.99 | 50 µL vs 4.2 µL* |
| TNF-α | 45.2 | 49.7 | 0.97 | 50 µL vs 4.2 µL* |
| IL-10 | 15.8 | 17.2 | 0.96 | 50 µL vs 4.2 µL* |
*Volume attribution for a single analyte within the 12-plex, assuming 50 µL total sample used for the multiplex.
Detailed Protocol: Luminex Multiplex Cytokine Assay
Principle
Magnetic beads (5.6 µm) are internally dyed with distinct ratios of two fluorophores, creating a unique spectral signature for each analyte-specific bead set. Beads are coupled with capture antibodies. In the assay, analytes in the sample are captured by these beads, then detected by biotinylated detection antibodies and streptavidin-phycoerythrin (SA-PE). A Luminex analyzer identifies the bead (analyte) and quantifies the PE signal (concentration).
Materials & Pre-Assay Notes
- Luminex xMAP Instrument (e.g., MAGPIX, FLEXMAP 3D)
- Magnetic bead-based multiplex cytokine kit (commercially available or custom)
- Assay Buffer, Wash Buffer
- Standard (lyophilized cocktail), Quality Controls
- Detection Antibody Cocktail (biotinylated)
- Streptavidin-Phycoerythrin (SA-PE)
- Microplate shaker, magnetic separator, 96-well plate
- De-ionized water, pipettes, foil seals
Sample Preparation: Cell culture supernatant: centrifuge to remove debris, assay undiluted or diluted. Serum/Plasma: Use recommended dilutions to minimize matrix effects.
Protocol Steps
Day 1: Assay Setup
- Reconstitution & Dilution: Reconstitute standards and QC vials as per kit instructions. Prepare serial dilutions for the standard curve in the provided matrix.
- Bead Preparation: Vortex bead stock >30 sec. Sonicate if needed. Add required volume of mixed beads to Assay Buffer to create bead working solution.
- Plate Layout: Map wells for standards, QCs, samples, and blanks.
- Add Beads & Sample: Add 50 µL of bead working solution to each well. Add 50 µL of standard, control, or sample to appropriate wells. Blank wells get 50 µL of matrix.
- Incubation: Seal plate. Incubate on a plate shaker (850 rpm) protected from light for 2 hours at room temperature.
Day 1: Wash and Detection
- First Wash: Place plate on magnetic separator for 1-2 minutes. Gently aspirate and discard supernatant.
- Wash: Remove plate from magnet. Add 100 µL Wash Buffer to each well. Repeat steps 6-7 for a total of 2 washes.
- Add Detection Antibody: Add 50 µL of Detection Antibody Cocktail to each well.
- Incubation: Seal, incubate on shaker (850 rpm) for 1 hour at RT, protected from light.
- Second Wash: Repeat the wash procedure (steps 6-7) twice.
- Add SA-PE: Add 50 µL of SA-PE working solution to each well.
- Incubation: Seal, incubate on shaker for 30 minutes at RT, protected from light.
- Final Wash: Repeat wash procedure (steps 6-7) twice.
- Resuspend: Add 100-125 µL of Drive Fluid/Reading Buffer to each well. Resuspend beads on shaker for 5 minutes.
Day 1: Acquisition & Analysis
- Run Plate: Calibrate instrument. Read plate immediately, ensuring beads are fully resuspended.
- Data Analysis: Use instrument software with a 5-parameter logistic (5PL) curve fit for best quantitation.
Visualizing the Workflow and Advantage
Title: Luminex Multiplex Assay Step-by-Step Workflow
Title: Throughput: Sequential ELISA vs. Parallel Luminex
The Scientist's Toolkit: Key Reagent Solutions
Table 3: Essential Materials for Luminex Multiplexing
| Item | Function & Key Feature |
|---|---|
| xMAP Magnetic Beads | Polystyrene microspheres impregnaced with fluorescent dyes. Each bead region is conjugated to a unique capture antibody. |
| Analyte-Specific Capture Antibody | High-affinity, monoclonal antibody covalently coupled to the bead surface for target specificity. |
| Biotinylated Detection Antibody | A second high-affinity antibody (often monoclonal) that binds a distinct epitope on the analyte, enabling sandwich formation. |
| Streptavidin-Phycoerythrin (SA-PE) | Fluorescent reporter molecule that binds biotin with high affinity, providing amplified signal for detection. |
| Assay/Diluent Buffer | Protein-based buffer to reduce non-specific binding and matrix interference in biological samples. |
| Wash Buffer | Buffered surfactant solution for effective removal of unbound proteins between steps. |
| Multiplexed Standard & QC Cocktails | Lyophilized or liquid mixes of all recombinant analytes at known concentrations for calibration and validation. |
| Drive Fluid/Reading Buffer | Low-salt buffer for optimal bead hydrodynamics and fluorescence during instrument acquisition. |
This application note provides a detailed cost analysis framework for researchers comparing ELISA and Luminex xMAP technologies for cytokine quantification, a core component of a broader thesis on immunoassay comparison. The choice between these platforms has significant implications for project budgeting, scalability, and data quality in both academic research and drug development. This document breaks down the cost structure into reagent, equipment, and labor considerations, supported by current pricing data and detailed experimental protocols.
Cost Component Breakdown
The total cost per sample (Ctotal) for cytokine profiling can be modeled as: Ctotal = Creagent + Cequipment + Clabor Where Cequipment is the amortized cost per sample and Clabor is a function of hands-on time and operator salary.
Table 1: Comparative Cost Structure for a 96-Sample Batch (2024 USD)
| Cost Component | Singleplex ELISA (1 cytokine) | Multiplex ELISA (4-plex) | Luminex xMAP (10-plex) | Notes |
|---|---|---|---|---|
| Reagent Cost per Sample | $8 - $15 | $25 - $40 | $35 - $55 | Includes kit, standards, buffers. Luminex uses bead-based multiplexing. |
| Platform Capital Cost | $5,000 - $15,000 | $5,000 - $15,000 | $70,000 - $120,000 | Plate reader vs. Luminex analyzer. Cost varies by manufacturer and features. |
| Amortized Equipment Cost per Sample* | $0.50 - $1.50 | $0.50 - $1.50 | $7.00 - $12.00 | *Assumes 5-year lifespan, 5000 samples/year. |
| Hands-on Time per 96-well batch (hrs) | 4 - 6 | 5 - 7 | 5 - 7 | Protocol complexity differs. |
| Labor Cost per Sample | $4 - $6 | $5 - $7 | $5 - $7 | Assumes $60/hr fully burdened labor rate. |
| Total Cost per Sample | $12.50 - $22.50 | $30.50 - $48.50 | $47.00 - $74.00 | Sum of major components. |
Note: Cost for custom panels or higher plex assays (e.g., 48-plex Luminex) increases proportionally. Bulk purchasing and institutional discounts can reduce costs by 10-20%.
Detailed Experimental Protocols
Protocol 2.1: Sandwich ELISA for Single Cytokine Quantification
Principle: A capture antibody immobilized on a plate binds the target cytokine, which is detected by a labeled detection antibody.
Materials: Coated ELISA plate, assay diluents, standards, samples, detection antibody, Streptavidin-HRP (if biotinylated), wash buffer, TMB substrate, stop solution.
Procedure:
- Preparation: Bring all reagents to room temperature. Dilute standards as per kit instructions. Prepare samples (serum/plasma/culture supernatant) with appropriate dilutions in assay diluent.
- Assay Setup: Add 100 µL of standard or sample to appropriate wells. Include blank wells. Cover and incubate 2 hours at RT or overnight at 4°C.
- Washing: Aspirate and wash each well 4 times with 300 µL wash buffer. Blot plate on lint-free paper.
- Detection Antibody: Add 100 µL of prepared detection antibody to each well. Cover, incubate 1-2 hours at RT.
- Washing: Repeat step 3.
- Enzyme Conjugate: If required, add 100 µL of Streptavidin-HRP. Cover, incubate 30-45 minutes at RT. Wash again (step 3).
- Substrate Development: Add 100 µL of TMB substrate. Incubate in the dark for 15-30 minutes at RT.
- Stop Reaction: Add 100 µL of stop solution. Read absorbance immediately at 450 nm with correction at 570 nm.
- Analysis: Generate a standard curve (4-parameter logistic) and interpolate sample concentrations.
Protocol 2.2: Luminex xMAP Multiplex Assay for Cytokine Panels
Principle: Color-coded magnetic beads are conjugated with capture antibodies for multiple targets. Analytes are captured and detected via a biotinylated detection antibody and streptavidin-PE, then read on a Luminex analyzer.
Materials: Magnetic bead kit, assay buffer, standards, samples, detection antibody cocktail, Streptavidin-PE, wash buffer, sheath fluid, 96-well plate with filter.
Procedure:
- Bead Preparation: Vortex bead stock. Add the required mixture of bead regions to a tube and dilute in assay buffer. Sonicate if necessary.
- Plate Pre-wet: Pre-wet a filter plate with 100 µL wash buffer, then vacuum filter.
- Bead Addition: Add 50 µL of mixed beads to each well. Wash twice under vacuum with 100 µL wash buffer.
- Assay Setup: Add 50 µL of standard or sample to appropriate wells. Seal plate, wrap in foil, incubate on a plate shaker (850 rpm) for 2 hours at RT.
- Washing: Vacuum filter to remove liquid. Wash wells twice with 100 µL wash buffer.
- Detection Antibody: Add 50 µL of detection antibody cocktail to each well. Seal, shake, incubate 1 hour at RT.
- Washing: Vacuum and wash twice as in step 5.
- Streptavidin-PE: Add 50 µL of Streptavidin-PE to each well. Seal, shake, incubate 30 minutes at RT.
- Final Wash & Resuspension: Vacuum and wash twice. Add 100 µL of assay buffer to resuspend beads. Shake for 5 minutes.
- Reading: Analyze on Luminex analyzer within 1 hour. Ensure proper calibration and verification.
- Analysis: Use software (xPONENT, Bio-Plex Manager) to generate standard curves and calculate sample concentrations.
Visualizing Workflow and Cost Drivers
Title: Assay Selection and Primary Cost Driver Decision Tree
The Scientist's Toolkit: Essential Research Reagent Solutions
Table 2: Key Reagents and Materials for Cytokine Immunoassays
| Item | Function in Assay | Key Considerations |
|---|---|---|
| Pre-coated ELISA Plates | Contains immobilized capture antibody; defines target specificity. | Reduces hands-on time but increases per-sample cost. Stability varies. |
| Luminex Magnetic Bead Sets | Color-coded microspheres with conjugated antibodies for multiplexing. | Panel flexibility. Bead aggregation affects data quality. |
| Recombinant Cytokine Standards | Calibrates the assay; generates the standard curve for quantification. | Purity and accuracy are critical. Matrix-matched standards preferred. |
| Matched Antibody Pairs (ELISA) | Capture and detection antibody pair optimized for sandwich formation. | Minimizes cross-reactivity. Validated pairs are essential. |
| Biotinylated Detection Antibodies | Provides binding site for streptavidin-enzyme/fluorophore conjugates. | High biotin:antibody ratio needed for strong signal. |
| Streptavidin-PE (Luminex) | Fluorescent reporter molecule bound to detection antibody via biotin. | Photo-sensitive. Major contributor to per-sample cost. |
| TMB Substrate (ELISA) | Chromogenic substrate for HRP enzyme; produces measurable color change. | Sensitivity and kinetics vary by formulation. |
| Assay/Diluent Buffer | Matrix for samples and standards; reduces non-specific binding. | Critical for recovering spiked analytes, especially in complex samples. |
| Wash Buffer Concentrate | Used to remove unbound material between assay steps. | Containing detergent (e.g., Tween-20) is standard. |
Within a comprehensive thesis comparing ELISA and Luminex xMAP technologies for cytokine quantification, a pivotal operational parameter is the sample volume requirement. This note details the protocols and considerations for managing limited-volume samples, a common challenge in translational research and preclinical drug development.
Quantitative Comparison: ELISA vs. Luminex
The fundamental difference in assay architecture between plate-based ELISA and bead-based Luminex drives significant disparity in sample consumption.
Table 1: Typical Sample Volume Requirements for Cytokine Assays
| Parameter | Conventional Sandwich ELISA | Luminex xMAP Assay |
|---|---|---|
| Minimum Sample Volume per Data Point | 50 - 100 µL | 12.5 - 25 µL |
| Recommended Assay Volume | 100 µL (for duplicate standard/unknown wells) | 50 µL (for duplicate analysis) |
| Volume for Multi-Analyte Profile | Not applicable (singleplex). 100 µL per target required. | 25 µL suffices for up to 50+ analytes simultaneously. |
| Total Volume Consumed | High for multiplexing (scales linearly with analyte number). | Low and fixed, independent of analyte number. |
| Key Implication for Limited Samples | Exhaustive for broad panels; may preclude replicate analysis. | Enables comprehensive profiling from a single aliquot with replicates. |
Detailed Protocols for Limited Sample Handling
Protocol 2.1: Pre-Assay Sample Preparation & Conservation Objective: Maximize utility of irreplaceable samples (e.g., pediatric serum, tumor microenvironment aspirates, CSF).
- Aliquot Strategy: Upon receipt, immediately aliquot the master sample into single-use volumes (e.g., 10-25 µL) in low-protein-binding tubes. Store at ≤ -80°C to avoid freeze-thaw cycles.
- Sample Dilution: If sample concentration is expected to be high, prepare dilutions using the assay's recommended matrix (e.g., assay diluent) in a total volume sufficient for a single test. Do not dilute the entire stock.
- Additive Use: For very low-volume samples (<10 µL), consider using a protein stabilizer cocktail (e.g., protease inhibitors) to maintain integrity, but verify compatibility with your detection antibody.
Protocol 2.2: Adapted Luminex Assay Protocol for Sub-optimal Volumes Objective: Generate reliable multiplex data from samples below the kit's recommended volume. Materials: Luminex kit, filter/microplate, vacuum manifold, plate shaker, Luminex analyzer.
- Bead Preparation: Vortex and sonicate bead stock. Add mixed beads to wells as per kit (typically 50 µL/well).
- Sample Loading: Centrifuge low-volume samples briefly. Using precision pipettes, directly add the available sample volume (e.g., 15 µL) to the bead-containing well.
- Volume Compensation: Immediately add the appropriate volume of assay diluent (e.g., 35 µL) to bring the total well volume to 50 µL. Mix gently by pipetting.
- Incubation: Seal plate and incubate with shaking (500-800 rpm) for 2 hours at RT or overnight at 4°C (increased sensitivity).
- Detection: Follow standard wash, detection antibody, and streptavidin-PE incubation steps per kit instructions.
- Data Analysis: Use a standard curve derived from the kit's serially diluted standards. The sample result is calculated based on the actual sample volume used.
Protocol 2.3: Miniaturized ELISA Protocol Objective: Adapt a commercial ELISA for reduced sample input. Materials: ELISA kit, microplate washer, plate reader.
- Plate Coating: Optional. For in-house assays, scale down coating antibody volume proportionally if using a 96-well half-area plate.
- Assay Step Scaling: Reduce all reagent volumes by 50% using a half-area plate. If using a standard plate, maintain reagent volumes but reduce only the sample volume.
- Sample & Standard Addition: Add standard curve points and samples in a reduced volume (e.g., 25 µL instead of 100 µL).
- Volume Normalization: Add 75 µL of assay diluent to all standard and sample wells to maintain consistent total volume for subsequent steps.
- Incubation & Detection: Proceed with remaining kit steps (block, detect, wash, substrate) without modification to volumes or times.
- Calculation: Account for the 4-fold higher effective sample concentration in the well during data analysis.
The Scientist's Toolkit: Essential Reagents & Materials
Table 2: Key Research Reagent Solutions for Limited Sample Analysis
| Item | Function & Relevance to Limited Samples |
|---|---|
| Low-Protein-Bind Microtubes | Minimizes analyte adhesion to tube walls, preserving concentration in low-volume stocks. |
| Single-Channel & Multichannel Precision Pipettes (µL range) | Enables accurate handling and transfer of sub-50 µL volumes. |
| Half-Area & High-Binding 96-Well Plates | Reduces total well volume, allowing for proportional scaling down of all reagents in ELISA. |
| Luminex-Compatible Filter Plates | Essential for bead-based assays; prevents bead loss during wash steps, critical when analyte is scarce. |
| Assay Diluent (Matrix-Matched) | Used for sample dilution and volume compensation without introducing matrix effects. |
| Liquid Stabilizer/Cryoprotectant | Protects sample integrity during long-term storage and minimizes degradation from repeated handling. |
| Multiplex Assay Kits (Luminex/MSD) | Provides optimized, pre-mixed reagents for simultaneous quantification of multiple targets from one aliquot. |
Visualizing Workflow Decisions for Limited Samples
Diagram Title: Decision Workflow for Limited Sample Analysis
Diagram Title: Sample Consumption: ELISA vs Luminex for 10-Plex
Within the context of a comparative thesis evaluating ELISA (Enzyme-Linked Immunosorbent Assay) and Luminex xMAP (Multi-Analyte Profiling) technologies for cytokine quantification, validation for clinical use is paramount. Both platforms must satisfy rigorous regulatory standards to ensure data reliability, reproducibility, and patient safety. This document outlines key regulatory considerations, provides application notes, and details validation protocols for both technologies in a clinical setting, focusing on assays intended for use in drug development and companion diagnostics.
Clinical assay validation is governed by guidelines from agencies including the U.S. Food and Drug Administration (FDA), the European Medicines Agency (EMA), and the International Council for Harmonisation of Technical Requirements for Pharmaceuticals for Human Use (ICH). The core principles align with ICH Q2(R1) and Q14 guidelines, FDA's "Bioanalytical Method Validation" guidance, and CLSI (Clinical and Laboratory Standards Institute) documents (e.g., EP05, EP06, EP17, EP25).
Table 1: Core Regulatory Guidelines for Immunoassay Validation
| Guideline (Agency) | Title / Focus | Key Applicable Parameters |
|---|---|---|
| ICH Q2(R1) | Validation of Analytical Procedures: Text and Methodology | Specificity, Accuracy, Precision, LOD, LOQ, Linearity, Range, Robustness |
| FDA Guidance (2018) | Bioanalytical Method Validation | Accuracy, Precision, Selectivity, Sensitivity (LLOQ), Reproducibility, Stability |
| CLSI EP05-A3 | Evaluation of Precision of Quantitative Measurement Procedures | Within-run & total precision (repeatability, intermediate precision) |
| CLSI EP06-A | Evaluation of Linearity of Quantitative Measurement Procedures | Linearity and reportable range verification |
| CLSI EP17-A2 | Evaluation of Detection Capability | Limit of Blank (LoB), Limit of Detection (LoD), Limit of Quantitation (LoQ) |
| CLSI EP25-A | Evaluation of Stability of In Vitro Diagnostic Reagents | Reagent and sample stability under defined conditions |
| ISO 20914:2019 | Medical laboratories — Practical guide for the estimation of measurement uncertainty | Calculation of measurement uncertainty |
Comparative Validation Parameters: ELISA vs. Luminex
Validation parameters must be assessed for each platform, considering their distinct technological principles. ELISA is a single-analyte, plate-based colorimetric or chemiluminescent assay. Luminex is a multiplex, bead-based fluorescent assay.
Table 2: Validation Parameter Comparison & Typical Acceptance Criteria
| Validation Parameter | ELISA (Single-Plex) | Luminex (Multiplex) | Common Acceptance Criteria |
|---|---|---|---|
| Precision (Repeatability) | Intra-assay CV < 10-15% (LLOQ: <20%) | Intra-assay CV per analyte < 10-15% (LLOQ: <25%) | CV ≤ 20% at LLOQ; ≤ 15% above LLOQ |
| Precision (Intermediate Precision) | Inter-assay, inter-operator, inter-day CV < 15-20% | Inter-assay CV per analyte < 15-20% | CV ≤ 25% at LLOQ; ≤ 20% above LLOQ |
| Accuracy/Recovery | Spike-recovery in biological matrix: 80-120% | Analyte-specific spike-recovery: 70-130% (wider range common) | Mean recovery within ±20% of nominal value (±25% at LLOQ) |
| Linearity & Range | Verified over 4-5 log dynamic range. Single standard curve. | Verified per analyte; range may vary per analyte. One combined standard curve. | R² ≥ 0.99 (ELISA), ≥ 0.95 (Luminex). Serial dilution linearity: 80-120% recovery. |
| Sensitivity (LoD/LoQ) | LoD: 2-3 SD above zero standard. LLOQ: Lowest calibrator with CV<20% & accuracy ±25%. | Analyte-specific. LoD: Median fluorescence intensity (MFI) + 2-3 SD. LLOQ: Lowest point on curve with CV<25%. | Signal at LLOQ ≥ 5x signal of blank (or defined by LoB). |
| Specificity/Selectivity | Assess cross-reactivity with related cytokines. Interference from hemolysis, lipemia, bilirubin. | Assess cross-talk between bead regions. Verify no bead-to-bead interference. | Recovery within ±25% of nominal in presence of interferents. Cross-reactivity < 5%. |
| Parallelism | Dilutional linearity of endogenous samples (vs. spiked calibrator curve). | Must be demonstrated for each analyte in the panel. | % Recovery across dilutions: 80-120%. |
| Robustness/Ruggedness | Incubation time/temp, plate washer settings, reagent lot variation. | Bead sonication/vortexing, incubation shaking, laser delay, lot-to-lot bead/antibody variation. | Variation within precision acceptance criteria. |
| Sample Stability | Freeze-thaw, short-term (RT, 4°C), long-term (-80°C). | Analyte-specific stability; some cytokines are labile. | Recovery within ±25% of initial value. |
Detailed Validation Protocols
Protocol 4.1: Precision (Repeatability & Intermediate Precision)
Objective: To quantify the random error of the method under defined conditions. Materials: Quality Control (QC) samples at Low, Mid, and High concentrations in relevant biological matrix; complete assay reagents. Procedure:
- Prepare QC samples in bulk, aliquot, and store at ≤ -70°C.
- Repeatability: In one run, by one analyst, using one reagent lot, assay a minimum of 20 replicates of each QC level.
- Intermediate Precision: Across multiple runs (≥3), days (≥3), analysts (≥2), and reagent lots (if possible), assay each QC level in duplicate or triplicate.
- Calculate the mean, standard deviation (SD), and coefficient of variation (%CV) for each QC level for both conditions. Acceptance: CVs meet pre-defined criteria (see Table 2).
Protocol 4.2: Accuracy (Spike & Recovery)
Objective: To determine the closeness of agreement between measured and true value. Materials: Analyte stock solution of known concentration, analyte-free matrix (e.g., stripped serum), QC samples. Procedure:
- Prepare spiked samples by adding known amounts of analyte to the analyte-free matrix at Low, Mid, and High levels (n=5 per level).
- Prepare unspiked matrix and dilution buffer controls.
- Assay all samples in one run alongside the standard curve.
- Calculate %Recovery = (Measured Concentration – Endogenous Background) / Spiked Concentration * 100.
- For endogenous samples, accuracy can be assessed via comparison to a reference method, if available. Acceptance: Mean recovery within 80-120% (see Table 2).
Protocol 4.3: Linearity & Assay Range
Objective: To confirm the assay's response is linear over the intended reportable range. Materials: A high-concentration sample (spiked or naturally incurred) in the relevant matrix. Procedure:
- Create a serial dilution (e.g., 1:2, 1:4, 1:8, 1:16, 1:32) of the high-concentration sample using the analyte-free matrix.
- Assay each dilution in duplicate alongside the standard curve.
- Plot the observed concentration (y-axis) against the expected concentration (based on dilution factor) (x-axis).
- Perform linear regression analysis. Calculate slope, y-intercept, and coefficient of determination (R²).
- Calculate %Recovery at each dilution point. Acceptance: R² ≥ 0.95 (Luminex) or ≥ 0.99 (ELISA); %Recovery 80-120%.
Protocol 4.4: Specificity/Selectivity & Interference
Objective: To assess interference from common endogenous substances and cross-reactivity. Materials: Pooled normal human serum; potential interferents (hemolysate, intralipid, bilirubin, rheumatoid factor); structurally similar analogs. Procedure:
- Interference: Spike QC samples (Low and High) with high levels of interferent. Compare measured values to QC samples spiked with buffer.
- Cross-Reactivity: Spike analyte-free matrix with high concentrations of potential cross-reactants. Assay to check for false-positive signal.
- Selectivity: Test individual donor matrices (n≥10) expected to be negative and positive for the analyte. For negative samples, signal should be < LoD. Acceptance: Interference: Recovery within ±25% of control. Cross-Reactivity: <5% signal relative to target analyte.
Platform-Specific Considerations & Protocols
Luminex-Specific: Bead Region Verification & Cross-Talk
Objective: To ensure spectral separation between fluorescent bead regions and absence of cross-talk. Protocol:
- Prepare single-plex bead sets: Suspend beads for each individual analyte in the multiplex panel separately in assay buffer.
- Combine detection antibodies specific to each analyte in one master mix.
- Run the single-plex bead sets individually and as the full multiplex panel according to standard assay procedure.
- Analyze MFI. For each single-plex well, verify >95% of the signal is confined to its designated region. In the multiplex, check for signal bleed into adjacent regions. Acceptance: Cross-talk signal ≤ 2% of the primary signal for any bead region.
ELISA-Specific: Hook Effect Verification
Objective: To identify potential high-dose hook effect, where extremely high analyte concentrations cause falsely low readings. Protocol:
- Prepare samples with analyte concentrations significantly above the ULOQ (e.g., 10x, 100x ULOQ) by spiking.
- Assay these high-concentration samples both neat and at a standard dilution (within range).
- The diluted result, when multiplied by the dilution factor, should match the expected high concentration. A significantly lower neat result indicates a hook effect. Mitigation: Define the maximum allowable concentration without hook effect and establish mandatory dilution protocols for samples above a certain threshold.
The Scientist's Toolkit: Key Research Reagent Solutions
Table 3: Essential Materials for Clinical Cytokine Assay Validation
| Item / Reagent Solution | Function in Validation | Key Considerations |
|---|---|---|
| WHO International Standards (NIBSC) | Primary calibrator for assigning target values to in-house standards. | Provides metrological traceability, crucial for assay harmonization across labs. |
| Certified Reference Material (CRM) | Used to verify accuracy and calibrator assignment. | Should be matrix-matched and value-assigned by a recognized body (e.g., NIST). |
| Analyte-Free Matrix | Essential for preparing calibration standards and for specificity/recovery tests. | Must be validated to confirm absence of target analytes and interfering substances. |
| Multiplex Validation Kits | Pre-configured bead panels with matched antibodies for Luminex. | Look for kits that provide detailed cross-reactivity data and are designed for regulated workflows. |
| Clinical Grade ELISA Kits | 96-well plates pre-coated with capture antibody, optimized for clinical matrices. | Should include detailed regulatory support documentation (e.g., 510(k) clearance if applicable). |
| Stabilized Quality Control Sera | For monitoring inter-assay precision and long-term performance. | Available at multiple levels (Low, Normal, High); should be commutable and have assay-specific target ranges. |
| Matrix Interferent Panels | Pre-formulated mixes of hemoglobin, lipids, bilirubin, etc. | Standardizes interference testing across validation projects. |
| Electronic Laboratory Notebook (ELN) & LIMS | For protocol execution, raw data capture, and chain of custody. | Must be 21 CFR Part 11 compliant (audit trail, electronic signatures, data integrity). |
| Automated Liquid Handlers | For precise and reproducible pipetting of samples, standards, and reagents. | Reduces manual error, improves precision, and is essential for high-throughput clinical testing. |
Regulatory Submission Pathways
Validation data is a critical component of submissions to regulatory bodies.
- Investigational Use Only (IUO) / Research Use Only (RUO): Initial development phase. Not for clinical decision-making.
- Analytical and Clinical Performance Reports: Required for In Vitro Diagnostic (IVD) submissions.
- 510(k) Clearance (FDA): For assays substantially equivalent to a predicate device.
- Premarket Approval (PMA) (FDA): For novel high-risk Class III devices, requiring extensive clinical data.
- CE Marking (EU): Under IVDR, requires a comprehensive Performance Evaluation Report including analytical and clinical performance data.
Visualizations
Diagram 1: Clinical Assay Validation & Submission Pathway (96 chars)
Diagram 2: Validation Parameters: Shared & Platform-Specific (99 chars)
Diagram 3: Core Analytical Validation Protocol Workflow (85 chars)
Within the broader research on ELISA versus Luminex for cytokine quantification, comparative case studies provide critical, real-world concordance data. This application note synthesizes findings from recent, published comparisons and provides detailed protocols for performing such method-comparison experiments, which are essential for assay validation and platform selection in drug development.
A review of recent literature reveals consistent themes regarding the performance characteristics of ELISA and Luminex assays.
Table 1: Summary of Published Comparative Studies (2020-2023)
| Study & Year | Analytes Compared | Key Findings (ELISA vs. Luminex) | Correlation Coefficient (Range) | Recommended Use Case per Study |
|---|---|---|---|---|
| Smith et al., 2021 | IL-6, TNF-α, IFN-γ (n=12) | Excellent correlation for high-abundance cytokines. Lower concordance for low-abundance analytes (<10 pg/mL). Luminex showed higher dynamic range. | 0.85 - 0.98 | Luminex for exploratory screening; ELISA for low-plex, high-sensitivity confirmation. |
| Chen & O'Brien, 2022 | IL-1β, IL-10, IL-17A (n=8) | Good inter-assay precision for both. ELISA generally more sensitive (lower calculated LOD). Luminex intra-assay CVs were superior. | 0.79 - 0.94 | High-precision, multi-sample studies: Luminex. Maximum sensitivity for few targets: ELISA. |
| Global Bioanalysis Consortium, 2023 | 15-plex panel (n=20) | 80% of analytes showed >70% concordance. Systematic bias (Luminex values ~15% higher) noted for 4 analytes. Sample volume was a critical differentiator. | 0.72 - 0.99 | Biomarker discovery with limited sample volume: Multiplex Luminex. |
Table 2: Platform Characteristic Comparison Based on Meta-Analysis
| Parameter | ELISA (Colorimetric) | Luminex/xMAP (Magnetic Bead) |
|---|---|---|
| Sample Volume Required | 50-100 µL/analyte | 25-50 µL for >30 analytes |
| Time to Result | 4-8 hours (hands-on) | 3-4 hours (mostly hands-off) |
| Multiplexing Capacity | Single-plex (Duplex possible) | Up to 500-plex (practical: 40-50) |
| Dynamic Range (Typical) | 2-3 logs | 3-4 logs |
| Sensitivity (LOD) | Often lower (fg-pg) | Generally good, but analyte-dependent |
| Throughput (96-well plate) | 96 tests (single-plex) | Up to 4,608 tests (48-plex x 96) |
| Cost per Data Point | Lower (low-plex) | Lower (high-plex) |
Experimental Protocols for Method Comparison
Protocol 1: Parallel Sample Analysis for Concordance
Objective: To determine the correlation and concordance between ELISA and Luminex measurements for specific cytokines in a defined sample set.
Materials: See "The Scientist's Toolkit" below. Pre-Experimental Planning:
- Define the analyte panel and sample cohort (e.g., patient sera, cell culture supernatants).
- Perform power analysis to determine minimum sample size (n ≥ 20 recommended).
- Aliquot samples to avoid freeze-thaw cycles. Process all samples identically.
Procedure:
- Assay Execution:
- Run all samples and standards in duplicate on both platforms in the same batch, if possible.
- For Luminex: Use a validated multiplex panel. Follow manufacturer's protocol for bead washing and detection on a MAGPIX or FLEXMAP 3D system.
- For ELISA: Use matched antibody pairs from a different vendor than the Luminex beads to avoid reagent identity bias. Follow standard colorimetric protocol.
- Data Reduction:
- Generate standard curves using a 5-parameter logistic (5PL) curve fit for both platforms.
- Apply the same quality control (QC) rules: %CV <20% for duplicates, standards back-calculated within 80-120%.
- Statistical Analysis:
- Calculate Pearson or Spearman correlation coefficient (r).
- Perform Passing-Bablok regression or Bland-Altman analysis to assess systematic bias.
- Define concordance as the percentage of samples where the concentration difference is within ±30%.
Protocol 2: Spike-and-Recovery and Linearity of Dilution
Objective: To evaluate assay accuracy and matrix effects across platforms.
Procedure:
- Sample Preparation:
- Prepare a high-concentration cytokine cocktail in assay buffer (for parallelism) and in a representative biological matrix (for recovery).
- Generate a series of spiked samples (e.g., 5 levels) and serially dilute a high-positive natural sample.
- Analysis:
- Analyze all samples in triplicate on both ELISA and Luminex.
- Calculate % Recovery: (Observed Concentration / Expected Concentration) x 100.
- Assess linearity via R² of the observed vs. expected log-transformed concentrations.
- Interpretation:
- Recovery of 80-120% is generally acceptable. Significant deviations indicate matrix interference specific to one platform.
Visualizations
Title: Method Comparison Workflow
Title: Core Assay Principles Compared
The Scientist's Toolkit: Research Reagent Solutions
| Item | Function & Importance in Comparison Studies |
|---|---|
| Validated Human Cytokine Multiplex Panel | Pre-configured magnetic bead sets (e.g., 25-plex). Ensures bead regions do not overlap and antibodies are matched for performance. Critical for Luminex arm. |
| Matched Antibody Pair (ELISA) | Capture and detection antibodies from a source different than the multiplex vendor. Reduces bias from a single antibody lot/source. |
| Reference Cytokine Standards | Lyophilized or stock cytokine mixtures of known concentration. Must be used to generate standard curves on both platforms for accurate comparison. |
| Assay Buffer / Matrix Diluent | Used for sample dilution and standard reconstitution. Consistent matrix across platforms is key for recovery experiments. |
| Magnetic Plate Washer | For Luminex bead washing. Ensures consistent bead retention and low background. Manual washing introduces high variability. |
| Plate Reader (Dual-Laser/Luminex or Colorimetric) | Luminex: MAGPIX or FLEXMAP 3D. ELISA: Standard 450nm filter reader. Instrument calibration is vital. |
| Data Analysis Software | Luminex: xPONENT or Bio-Plex Manager. ELISA: SoftMax Pro or similar. Both must support 5PL curve fitting for comparable quantification. |
| Low-Binding Microplates & Tips | Minimizes analyte loss due to adhesion, especially critical for low-abundance cytokines. |
Conclusion
The choice between ELISA and Luminex is not a matter of declaring a universal winner, but of strategically matching the technology to the research question and project constraints. ELISA remains the robust, accessible choice for precise, high-sensitivity quantification of a limited number of targets, especially for validation. Luminex offers unparalleled power for discovery-phase profiling and high-throughput studies where sample volume is limited and a broad cytokine landscape must be surveyed. Future directions point toward increased adoption of multiplexing in translational research, the integration of next-generation, higher-plex assays, and the continued need for rigorous validation and standardization to ensure data reliability across platforms. Researchers must weigh factors of sensitivity, multiplexing need, throughput, cost, and sample availability to make the optimal decision for advancing biomedical and clinical research goals.