HDX-MS Epitope Mapping: A Comprehensive Guide to Structural Antibody Characterization
This article provides a detailed overview of Hydrogen-Deuterium Exchange Mass Spectrometry (HDX-MS) for mapping conformational epitopes, crucial for therapeutic antibody and vaccine development.
HDX-MS Epitope Mapping: A Comprehensive Guide to Structural Antibody Characterization
Abstract
This article provides a detailed overview of Hydrogen-Deuterium Exchange Mass Spectrometry (HDX-MS) for mapping conformational epitopes, crucial for therapeutic antibody and vaccine development. We explore the fundamental principles of HDX-MS, including the biophysical basis of deuterium exchange and epitope masking. A step-by-step protocol is presented, covering sample preparation, controlled exchange, quenching, digestion, and LC-MS/MS analysis. We address common experimental challenges such as back-exchange, data interpretation, and reproducibility, offering troubleshooting and optimization strategies. The guide compares HDX-MS with orthogonal techniques like cryo-EM, X-ray crystallography, and mutagenesis, evaluating their complementary roles in validation. Aimed at researchers and biopharma professionals, this resource serves as a practical roadmap for implementing HDX-MS to elucidate antibody-antigen interactions at the molecular level.
Understanding Conformational Epitopes: The Why and How of HDX-MS Analysis
An epitope is the specific region on an antigen to which an antibody or B-cell receptor binds. The structural nature of this region is critical for antibody function and therapeutic design.
- Conformational Epitopes: Also known as discontinuous epitopes, they are formed by amino acid residues that are not contiguous in the primary sequence but are brought together in spatial proximity due to protein folding. Binding is dependent on the native three-dimensional structure of the antigen.
- Linear Epitopes: Also known as continuous or sequential epitopes, they consist of a continuous sequence of amino acids in the primary protein structure. Binding is often independent of the protein's folded conformation.
Table 1: Core Characteristics of Epitope Types
| Feature | Conformational Epitope | Linear Epitope |
|---|---|---|
| Composition | Discontinuous residues brought together by folding. | Continuous sequence of amino acids. |
| Dependence on 3D Structure | High; denaturation destroys the epitope. | Low; often survives denaturation. |
| Primary Mapping Techniques | HDX-MS, X-ray crystallography, Cryo-EM, mutagenesis. | Peptide microarray, ELISA with synthetic peptides, SPOT synthesis. |
| Prevalence in Native Proteins | Highly prevalent (~90% of B-cell epitopes). | Less common. |
| Implication for Biologic Drugs | Critical for mAbs targeting native proteins; biosimilarity hinges on identical recognition. | Relevant for anti-peptide antibodies, some diagnostics, and denatured antigen targets. |
Implications for Biologic Drug Discovery and Development
The distinction between conformational and linear epitopes has profound implications:
- Therapeutic Antibody Development: Most monoclonal antibodies (mAbs) target conformational epitopes on native cell-surface or soluble proteins (e.g., anti-PD-1, anti-TNFα). Confirming the conformational nature of the epitope is essential for predicting in vivo efficacy and potential off-target effects.
- Biosimilarity and Interchangeability: Regulatory approval of biosimilars requires demonstration that the biosimilar binds to the same conformational epitope as the reference product, ensuring identical pharmacological activity.
- Vaccine Design: For pathogens, identifying immunodominant conformational epitopes can guide the design of structure-based vaccines that elicit neutralizing antibodies.
- Assay Development: Diagnostic and pharmacokinetic assays must use antigens in their native conformation to accurately detect conformation-specific therapeutic antibodies.
Application Note: Integrating HDX-MS for Conformational Epitope Mapping
Within the thesis framework of optimizing Hydrogen-Deuterium Exchange Mass Spectrometry (HDX-MS) protocols for epitope mapping, this application note details the comparative workflow for defining epitope character.
Core Thesis Context: The hypothesis that a robust, optimized HDX-MS protocol can reliably distinguish between conformational and linear epitope binding events by analyzing the protection patterns upon antibody-antigen complex formation.
Table 2: Expected HDX-MS Protection Signatures for Different Epitope Types
| Epitope Type | Expected HDX Protection Pattern Upon mAb Binding | Interpretation in Thesis Context |
|---|---|---|
| Conformational (Discontinuous) | Multiple, non-adjacent peptide segments show significant deuterium uptake reduction. | Protection map directly visualizes the disparate regions folded together to form the epitope. Validates protocol sensitivity. |
| Linear (Continuous) | A single, continuous peptide segment shows strong deuterium uptake reduction. | Protection is confined to the primary sequence. Serves as a control for the protocol. |
| Allosteric/Indirect Effect | Protection or deprotection observed at a distant site from the binding interface. | Protocol must differentiate direct binding (early time points) from long-range effects (longer time points). |
HDX-MS Workflow for Epitope Mapping
Detailed Protocol: Conformational Epitope Mapping via HDX-MS
Title: Optimized HDX-MS Protocol for Distinguishing Conformational vs. Linear Epitope Binding.
Principle: Upon binding, epitope residues typically show reduced deuterium uptake due to protection from solvent exchange. The pattern of protection reveals the epitope's structural nature.
Materials & Reagents:
- Purified antigen and monoclonal antibody (mAb) in stable buffer (e.g., PBS).
- Deuterium Oxide (D₂O, 99.9%).
- HDX Buffer (PBS, pD 7.0, prepared from D₂O and lyophilized PBS salts).
- Quench Buffer: 4 M Guanidine HCl, 0.5 M TCEP, 0.5% Formic Acid (FA), pH ~2.3, pre-chilled to 0°C.
- Immobilized Pepsin column or pepsin beads.
- UPLC system with C18 trap and column housed in a refrigerated chamber (0-2°C).
- High-Resolution Mass Spectrometer (e.g., Q-TOF, Orbitrap).
Procedure:
- Complex Formation: Incubate antigen with mAb at optimal molar ratio (typically 1:1.2 antigen:mAb) for 30 min at 25°C. Include antigen-only control.
- Deuterium Labeling:
- Dilute 5 µL of complex or control into 55 µL of pre-chilled HDX Buffer (D₂O).
- Incubate at 25°C for ten time points (e.g., 10s, 30s, 1, 5, 10, 30, 60, 900, 3600s).
- Quenching & Digestion:
- At each time point, add 60 µL of aliquot to 60 µL of ice-cold Quench Buffer.
- Immediately pass over immobilized pepsin column (2°C) at 200 µL/min for ~1 min.
- LC-MS Analysis:
- Trap and separate peptides on a C18 UPLC column at 0°C with a gradient of water/acetonitrile/0.1% FA.
- Analyze eluting peptides with a high-resolution MS. Use data-dependent MS/MS for peptide identification in separate non-deuterated samples.
- Data Processing:
- Process data using dedicated HDX software (e.g., HDExaminer, DynamX).
- Calculate deuterium uptake for each peptide across all time points for bound and unbound states.
- Identify peptides with statistically significant reduction in deuterium uptake (≥0.5 Da, ≥5% change) in the complex.
Interpretation: Map protected peptides onto the antigen structure. A single continuous sequence suggests a linear epitope. Multiple, disparate sequence segments that cluster in 3D space confirm a conformational epitope.
The Scientist's Toolkit: Key Research Reagent Solutions
Table 3: Essential Materials for HDX-MS Epitope Mapping Studies
| Item | Function & Relevance |
|---|---|
| High-Purity D₂O (99.9%) | Essential labeling reagent; purity minimizes back-exchange. |
| Immobilized Pepsin | Enables rapid, reproducible digestion at low pH and temperature (0°C), crucial for minimizing back-exchange. |
| Refrigerated UPLC Chamber | Maintains separation at ~0°C to preserve deuterium label on peptides prior to MS injection. |
| Quench Buffer (GdnHCl, TCEP, FA) | Denatures proteins, reduces disulfides, and lowers pH to ~2.5, effectively stopping HDX. |
| High-Res Mass Spectrometer (Q-TOF/Orbitrap) | Provides the mass accuracy and resolution needed to resolve closely spaced isotopic envelopes from deuterated peptides. |
| HDX Data Processing Software | Specialized software is mandatory for automated peptide identification, uptake calculation, and statistical comparison between states. |
| Structural Biology Software (PyMOL) | Used to visualize protected peptide segments mapped onto antigen 3D models, confirming conformational clustering. |
Epitope Definition Drives Biologics Development
Core Principles of Hydrogen-Deuterium Exchange (HDX) Biophysics
Within the framework of a thesis on HDX-MS for conformational epitope mapping, understanding the core biophysical principles is paramount. HDX-MS is a powerful technique for probing protein structure, dynamics, and interactions by measuring the exchange of amide hydrogen atoms with deuterium in solution. The rate of exchange is exquisitely sensitive to solvent accessibility and hydrogen bonding, making it an ideal tool for mapping regions of a protein that become protected upon binding to an antibody (the epitope), without requiring crystallization.
Core Biophysical Principles
Chemical Basis of Exchange
The exchange reaction is acid/base-catalyzed:
>NH + D₂O ⇌ >ND + HOD
The intrinsic exchange rate (k_int) depends on pH, temperature, and the amino acid sequence. It is minimal at pH ~2.6 (the "pH minimum") and increases exponentially with pH on the basic side.
Structural Determinants of Exchange Rates
The observed exchange rate (k_obs) for any amide hydrogen is modulated by protein structure:
- Protection Factor (PF):
PF = k_int / k_obs. A high PF indicates strong protection from exchange due to factors below. - Hydrogen Bonding: Amide hydrogens involved in secondary (α-helix, β-sheet) or tertiary structure hydrogen bonds exchange orders of magnitude slower.
- Solvent Accessibility: Buried amides have reduced access to solvent deuterium.
Exchange Regimes
The relationship between the intrinsic rate (k_int) and the structural opening/closing rates (k_op, k_cl) defines two key regimes critical for data interpretation in epitope mapping:
- EX2:
k_cl >> k_int. Exchange occurs from transiently open states. The measured deuterium uptake is the weighted average of all protein conformations. This is the most common regime and provides population-weighted structural information. - EX1:
k_cl << k_int. Exchange is cooperative and occurs in a concerted manner from a fully open state. This regime reveals distinct conformational states or global unfolding events.
Table 1: Key Quantitative Parameters in HDX Biophysics
| Parameter | Symbol | Typical Range/Value | Significance for Epitope Mapping |
|---|---|---|---|
| Intrinsic Exchange Rate | k_int |
10⁻¹ to 10³ min⁻¹ at pH 7, 25°C | Baseline for calculating protection; sequence-dependent. |
| Protection Factor | PF | 1 (unfolded) to 10⁸+ (core) | Direct measure of structural protection. A change (ΔPF) upon binding indicates involvement in interaction. |
| EX2 Regime Condition | k_cl >> k_int |
Predominant at neutral pH, native conditions | Results in a unimodal isotopic envelope; uptake reflects average solvent exposure. |
| EX1 Regime Condition | k_cl << k_int |
Seen at elevated pH, denaturing conditions, or during unfolding | Results in a bimodal isotopic envelope; indicates cooperative unfolding or multiple states. |
| Deuterium Uptake (D) | D | 0 - Max # of exchangeable amides | Measured quantity; difference (ΔD) between free and bound states identifies protected epitope regions. |
Application Notes for Conformational Epitope Mapping
Key Experimental Design Considerations
- Control of Exchange Conditions: Quench buffer (low pH/pH 2.5, low temperature 0°C) is critical to minimize back-exchange (<10%) during analysis.
- Comparison of States: Always compare deuterium uptake for the antigen alone vs. the antigen-antibody complex under identical exchange conditions.
- Time Course: Use multiple exchange times (e.g., 10s, 1min, 10min, 1h, 4h) to capture kinetics of protection, distinguishing direct binding effects from allosteric changes.
- Redundancy: Perform biological and technical replicates to ensure statistical significance of identified protected peptides.
Detailed Protocol: HDX-MS for Epitope Mapping
Stage 1: Sample Preparation
Objective: Prepare pure, stable antigen and antigen-antibody complex. Procedure:
- Buffer exchange antigen and antibody into HDX-MS compatible buffer (e.g., 20 mM phosphate, 150 mM NaCl, pH 7.4) using desalting columns.
- Form complex by incubating antigen with a 1.2-1.5 molar excess of antibody for 30-60 minutes at room temperature.
- Use size-exclusion chromatography (SEC) to isolate the purified complex from free components. Collect in low-protein-binding tubes.
- Confirm complex integrity and purity via native MS or analytical SEC.
Stage 2: Hydrogen-Deuterium Exchange
Objective: Initiate labeling by diluting protein into D₂O buffer. Procedure:
- Prepare deuterated labeling buffer (identical composition to Stage 1 buffer, but prepared in D₂O, pDread = pHread + 0.4).
- For each time point, mix 5 µL of protein sample (antigen or complex at ~10-20 µM) with 45 µL of labeling buffer to initiate exchange (90% D₂O final). Perform in triplicate.
- Incubate at 25°C for predetermined times (e.g., 0.5, 1, 5, 30, 120, 240 minutes).
- Quench exchange by adding 50 µL of quench buffer (pre-chilled to 0°C) to yield final pH ~2.5 (e.g., 400 mM Glycine-HCl, 4 M Guanidine-HCl, 0°C). Immediately place on ice.
Stage 3: Processing and LC-MS/MS Analysis
Objective: Digest protein into peptides, separate, and measure deuterium incorporation. Procedure:
- Digestion & Separation: Pass quenched sample through an immobilized pepsin column (2 mm x 20 mm, 0°C) at 100 µL/min for 2 minutes. Trap peptides on a C8 or C18 trap column.
- Chromatography: Elute peptides onto a reverse-phase C18 analytical column (1.0 mm x 50 mm) with a 5-35% acetonitrile gradient (in 0.1% formic acid) over 8 minutes at 40 µL/min (0°C).
- Mass Spectrometry: Analyze eluting peptides using a high-resolution mass spectrometer (e.g., Q-TOF, Orbitrap). Use ESI-positive mode. Data-dependent MS/MS acquisition for peptide identification in separate undeuterated samples.
Stage 4: Data Processing and Analysis
Objective: Calculate deuterium uptake for each peptide in both states. Procedure:
- Process raw files with HDX-MS software (e.g., HDExaminer, DynamX, Mass Spec Studio).
- Identify peptides from undeuterated MS/MS data.
- For each peptide at each time point, calculate centroid mass of the isotopic envelope.
- Subtract the centroid mass of the undeuterated control to obtain deuterium uptake (Da).
- Correct for back-exchange using a fully deuterated control sample.
- Calculate difference in uptake (ΔD) between antigen and complex for each peptide at each time point. Peptides showing significant protection (ΔD > 0.3 Da and statistically significant) constitute the conformational epitope.
Diagram Title: HDX-MS Epitope Mapping Experimental Workflow
Diagram Title: HDX Exchange Regimes: EX2 vs EX1 Kinetics
The Scientist's Toolkit: Essential Research Reagents & Materials
Table 2: Key Reagents and Solutions for HDX-MS Epitope Mapping
| Item | Function & Critical Specification |
|---|---|
| D₂O (99.9% Deuterium) | Provides the deuterium label for exchange. Purity is critical to minimize H₂O contamination. |
| HDX-Compatible Buffer Salts (e.g., Phosphates, HEPES) | Maintains protein stability and pH/pD during exchange. Must be non-amine, non-exchangeable. |
| Quench Buffer (e.g., Glycine/HCl, TFA, pH 2.0-2.5) | Lowers pH and temperature to minimize back-exchange (<10%). Often contains denaturant (GdnHCl) to unfold protein for digestion. |
| Immobilized Pepsin Column | Provides rapid, reproducible digestion at quench conditions (pH 2.5, 0°C) in-line with LC system. |
| Reverse-Phase LC Columns (Trap & Analytical) | Desalts (trap) and separates peptides (analytical C18) under low pH, low temperature conditions to minimize back-exchange. |
| Mass Spectrometer (High-resolution, e.g., Q-TOF, Orbitrap) | Accurately measures the mass increase of peptides due to deuterium incorporation. High resolution is needed to resolve isotopic envelopes. |
| HDX Data Processing Software (e.g., HDExaminer, PLGS, DynamX) | Automates peptide identification, centroid mass calculation, deuterium uptake determination, and statistical comparison between states. |
| Size-Exclusion Chromatography (SEC) Columns | Purifies the antigen-antibody complex from excess components prior to HDX labeling to ensure a homogeneous population. |
This Application Note details a comprehensive Hydrogen-Deuterium Exchange Mass Spectrometry (HDX-MS) protocol for conformational epitope mapping, a critical technique in structural biology and therapeutic antibody discovery. The protocol is framed within a broader thesis investigating the optimization of HDX-MS for characterizing transient protein-protein interactions, with a focus on achieving high spatial resolution and reproducibility for accurate epitope delineation.
Key Research Reagent Solutions
The following table lists essential materials and reagents for a standard HDX-MS epitope mapping experiment.
| Item | Function | Example/Notes |
|---|---|---|
| Deuterated Buffer | Provides deuterium source for exchange reaction. Typically pD 7.4 (pD = pH + 0.4). | 10-100 mM phosphate or Tris buffer in D₂O. |
| Quench Buffer | Rapidly lowers pH and temperature to minimize back-exchange. | 0.1-1.0% formic acid, pH ~2.5, 0°C. |
| Immobilized Pepsin | Provides rapid, reproducible digestion under quench conditions. | Poroszyme immobilized pepsin cartridge. |
| Ultra-Performance LC System | Desalting and separation of peptides pre-MS analysis. | Vanquish or Acquity UPLC with C18 column, 0°C. |
| High-Resolution Mass Spectrometer | Measures mass shift of peptides due to deuterium uptake. | Time-of-Flight (e.g., Bruker timsTOF, Waters Synapt) or Orbitrap. |
| Software for HDX Analysis | Processes raw MS data, calculates deuteration levels. | HDExaminer, DynamX, Deuteros. |
| Control (Non-deuterated) Samples | Essential for establishing peptide reference masses. | Identical protocol using H₂O-based buffer. |
Table 1: Representative Deuteration Uptake Data for an Antigen Peptide (residues 45-58) with and without Antibody Binding.
| Condition | Deuteration (Da) at 30s | Deuteration (Da) at 300s | Deuteration (Da) at 3000s | Protection Factor* |
|---|---|---|---|---|
| Antigen Alone | 3.12 ± 0.15 | 5.88 ± 0.21 | 7.05 ± 0.18 | N/A |
| Antigen + mAb | 0.95 ± 0.12 | 1.22 ± 0.15 | 1.98 ± 0.14 | 22.4 |
*Protection Factor = (kintrinsic / kobserved), calculated from exchange rates.
Table 2: HDX-MS Experimental Parameters and Optimal Values.
| Parameter | Typical Optimal Value | Impact on Data |
|---|---|---|
| Exchange Time Points | 0.25, 1, 10, 60, 300, 1000s (log scale) | Captures kinetics. |
| Temperature | 25°C (±0.1°C) | Controls exchange rate. |
| Quench pH | 2.5 | Minimizes back-exchange (<10%). |
| Digestion Time | 2-3 minutes | Balance of peptide yield & back-exchange. |
| LC Gradient | 5-35% Acetonitrile in 7-10 min | Fast separation to minimize back-exchange. |
Detailed Experimental Protocols
Protocol 4.1: Epitope Masking via Antigen-Antibody Complex Formation
- Prepare Samples: In duplicate/triplicate, combine purified antigen (5 µM) with a 1.2-1.5 molar excess of monoclonal antibody in native PBS buffer (pH 7.4). Include antigen-only controls.
- Incubate: Allow complex formation for 60 minutes at 25°C.
- Verify Complexation: Analyze an aliquot via native mass spectrometry or size-exclusion chromatography to confirm >95% complex formation.
Protocol 4.2: Deuterium Labeling and Quench
- Initiate HDX: Dilute 5 µL of sample (complex or control) with 45 µL of pre-equilibrated D₂O buffer (e.g., 50 mM phosphate, pD 7.4, 25°C). Mix thoroughly but gently.
- Time Course: Incubate for predetermined time points (e.g., 30s, 100s, 1000s, 10,000s) in a controlled temperature block.
- Quench Reaction: For each time point, add 50 µL of quench solution (pre-chilled to 0°C, 0.8% formic acid, 2 M Guanidine HCl) to the 50 µL labeling reaction, reducing pH to ~2.5 and temperature to ~0°C. Vortex immediately.
Protocol 4.3: On-Line Digestion and LC-MS Analysis
- Digest: Immediately inject the 100 µL quenched sample onto a system containing an immobilized pepsin column (e.g., Poroszyme) housed in a cooled chamber (2°C).
- Peptide Trapping: Digest for 2-3 minutes as peptides are trapped on a C18 trap column.
- Separation: Elute peptides onto an analytical C18 UPLC column (0°C) with a fast gradient (e.g., 8-35% acetonitrile in 0.1% formic acid over 8 minutes).
- Mass Spectrometry Analysis: Eluting peptides are analyzed by a high-resolution mass spectrometer. Data is acquired in positive ion, data-independent (MSE) or data-dependent acquisition (DDA) mode with mass range 300-1700 m/z.
Protocol 4.4: Data Processing and Deuteration Calculation
- Peptide Identification: Use tandem MS data from undetterated or fully deuterated controls to identify peptide sequence using database search software (e.g., PEAKS, Mascot).
- Mass Analysis: Process time-point data with HDX-dedicated software (e.g., HDExaminer). Extract centroid mass for each peptide isotopic envelope at each deuteration time point.
- Calculate Uptake: Subtract the average mass of the undetterated (0s) peptide from the deuterated peptide mass at each time point. Correct for back-exchange using a fully deuterated control.
- Map Protection: Compare deuteration kinetics (uptake plots) for antigen alone vs. antigen-antibody complex. Peptides showing significant reduction in deuteration (e.g., >0.5 Da difference, statistically validated) define the conformational epitope.
Workflow and Pathway Diagrams
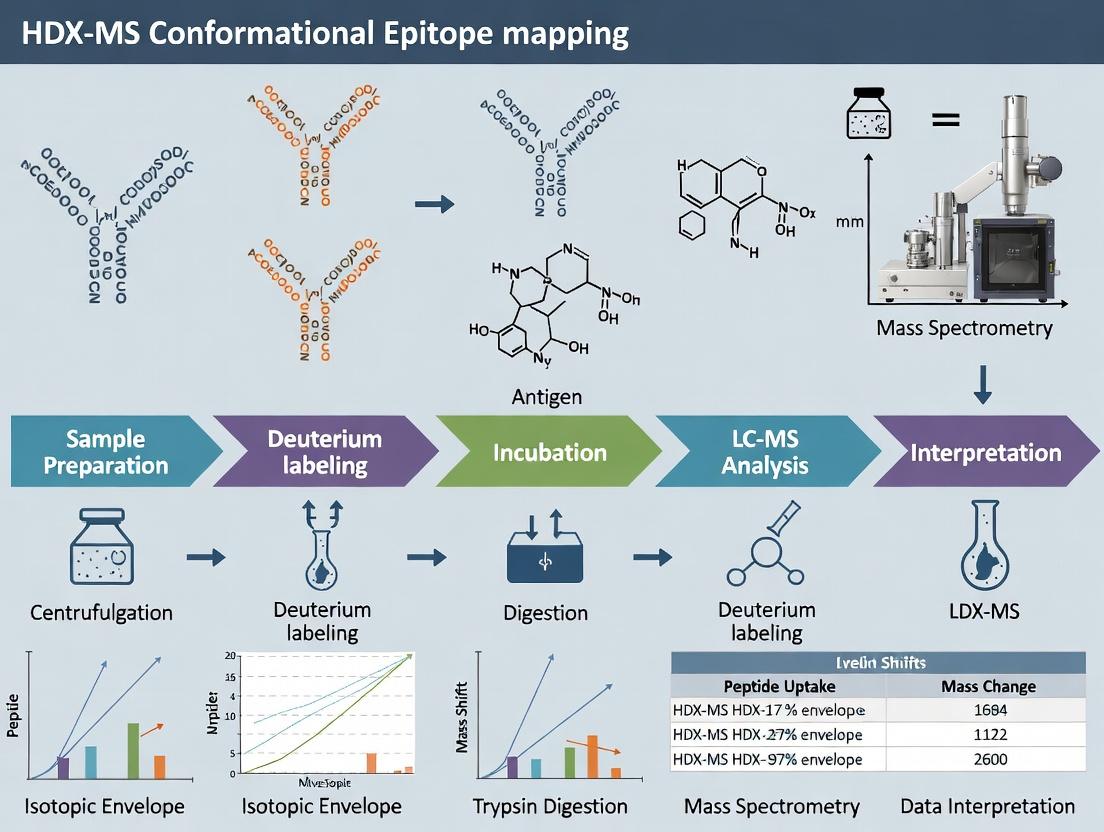
HDX-MS Conformational Epitope Mapping Workflow
HDX-MS Data Analysis and Epitope Determination Logic
Application Notes: HDX-MS for Conformational Epitope Mapping in Biologic Development
Within the thesis on Hydrogen-Deuterium Exchange Mass Spectrometry (HDX-MS) protocol for conformational epitope mapping, the technique serves as a critical analytical tool for characterizing the interactions between therapeutic biologics and their targets. This enables rational design and optimization across three key drug classes.
For Therapeutic Antibodies: HDX-MS identifies precise regions of an antibody's paratope that undergo protection from exchange upon binding to a protein antigen (e.g., a cytokine or receptor). This maps the conformational epitope, guiding affinity maturation and engineering to reduce immunogenicity or develop bispecific formats.
For Vaccines: In the analysis of protein-subunit vaccines, HDX-MS characterizes the structural integrity and dynamics of vaccine antigens. It can map epitopes recognized by neutralizing sera from vaccinated subjects, providing a mechanistic correlate of immune protection and supporting antigen design (e.g., for stabilized viral fusion proteins).
For Protein Therapeutics (e.g., enzymes, growth factors): HDX-MS analyzes higher-order structure (HOS) for comparability studies between biosimilars and innovators. It also maps interaction sites with therapeutic targets or stabilizing partners, crucial for ensuring proper biological function.
The quantitative output of HDX-MS is the deuterium uptake difference (ΔDa) between the free and bound states of the antigen, pinpointing protected peptides.
Table 1: Representative HDX-MS Data from Conformational Epitope Mapping Studies
| Therapeutic Class | Target Antigen | Number of Protected Peptides Identified | Max Protection (ΔDa) | Key Epitope Region Mapped | Reference Year* |
|---|---|---|---|---|---|
| Monoclonal Antibody | IL-6 | 7 | 4.2 | Loop residues 35-52 | 2023 |
| Bispecific Antibody | HER2 & CD3 | 12 (HER2), 5 (CD3) | 3.8, 2.1 | HER2: Domain IV; CD3: C'-C Loop | 2024 |
| Subunit Vaccine Antigen | SARS-CoV-2 Spike RBD | 5 (from neutralizing mAb) | 3.5 | Receptor Binding Motif | 2023 |
| Enzyme Replacement Therapy | α-Galactosidase A | 9 (stabilizer complex) | 2.8 | Active-site adjacent lobe | 2022 |
Note: Years are indicative based on recent literature trends.
Detailed Protocols
Protocol 1: HDX-MS Workflow for Antibody:Antigen Epitope Mapping
Objective: To identify the conformational epitope on an antigen recognized by a therapeutic monoclonal antibody.
Materials: Purified antigen and antibody proteins, deuterium oxide (D₂O) buffer (pH 7.4, 25 mM phosphate, 150 mM NaCl), quench buffer (3M urea, 1% formic acid, 0.1M TCEP, chilled), LC-MS system with pepsin column/chip, UPLC with C18 column, high-resolution mass spectrometer.
Procedure:
- Labeling: Prepare antigen-alone and pre-formed antigen:antibody complex (≥95% bound by SEC) in H₂O buffer. Initiate HDX by diluting 10-fold into D₂O buffer. Incubate at 25°C for five time points (e.g., 10s, 1min, 10min, 60min, 240min).
- Quench: At each time point, mix 50 µL labeling reaction with 50 µL ice-cold quench buffer (pH ~2.5) to reduce pH and temperature.
- Digestion & Separation: Immediately inject quenched sample onto an immobilized pepsin column (2°C) for online digestion (1 min). Resulting peptides are trapped and desalted on a C18 trap column (0.3°C).
- LC-MS Analysis: Peptides are separated via a C18 UPLC column (0°C, 8-12 min gradient) and analyzed by a high-resolution MS (e.g., Q-TOF) with electrospray ionization.
- Data Processing: Use dedicated software (e.g., HDExaminer, DynamX) to identify peptides, adjust for back-exchange, and calculate deuterium uptake for each peptide at each time point.
- Epitope Mapping: Calculate the difference in uptake (ΔDa) between the free antigen and the complex. Peptides with significant protection (e.g., ΔDa > 0.5 Da and statistically significant) are mapped onto the antigen structure.
Protocol 2: HDX-MS for Vaccine Antigen Epitope Characterization
Objective: To map the epitope on a vaccine antigen recognized by neutralizing monoclonal antibodies from immunized subjects.
Materials: Purified recombinant vaccine antigen (e.g., viral glycoprotein), purified neutralizing mAb, controls (non-neutralizing mAb, isotype control). Follow same buffers and LC-MS setup as Protocol 1.
Procedure:
- Complex Formation: Incubate vaccine antigen with a 1.2-1.5 molar excess of neutralizing mAb. Use antigen with non-neutralizing mAb and antigen-alone as critical controls.
- HDX Labeling & Analysis: Perform HDX labeling (typically focused on shorter times: 10s, 1min, 5min, 20min) followed by quench, digestion, and LC-MS analysis as in Protocol 1.
- Data Interpretation: Identify regions protected specifically by the neutralizing mAb but not by the non-neutralizing control. These protected peptides define the neutralizing epitope, which can be assessed for conservation across viral variants.
Protocol 3: HDX-MS for Protein Therapeutic Higher-Order Structure (HOS) Analysis
Objective: To compare the conformational dynamics of a biosimilar protein therapeutic to its innovator product.
Materials: Innovator and biosimilar protein therapeutics at identical concentrations. Same HDX buffers and MS setup.
Procedure:
- Sample Preparation: Buffer-exchange both innovator and biosimilar into identical H₂O-based reaction buffer.
- Differential HDX: Perform parallel HDX labeling for both samples under identical conditions (same D₂O buffer, temperature, time points).
- Analysis: Process data to generate deuterium uptake plots for the peptic peptides covering >95% of the protein sequence.
- Comparability Assessment: Overlay uptake plots and calculate the relative difference (ΔΔDa) for each peptide. A successful biosimilar will show no significant differences in HDX kinetics, indicating identical conformational dynamics and HOS.
Visualizations
HDX-MS Epitope Mapping Workflow
Thesis Context in Biologic Drug Development
The Scientist's Toolkit: Key Reagent Solutions for HDX-MS Epitope Mapping
| Item | Function in HDX-MS Epitope Mapping |
|---|---|
| Deuterium Oxide (D₂O), 99.9% | The labeling reagent; source of deuterium for exchange with backbone amide hydrogens. Purity is critical for clean MS spectra. |
| Deuterated Buffer Salts | Preparation of labeling buffer in D₂O to maintain correct pD (pH + 0.4) and ionic strength during exchange. |
| Immobilized Pepsin Column/Chip | Provides rapid, reproducible, and cold digestion of labeled protein to peptides for analysis. Minimizes back-exchange. |
| Quench Buffer (Low pH, Denaturant) | Rapidly drops pH to ~2.5 and temperature to ~0°C, stopping the HDX reaction. Contains chaotropes (urea/guanidine) to unfold protein for consistent digestion. |
| C18 UPLC Trap & Column | Desalting (trap) and chromatographic separation of peptides under low-temperature, low-pH conditions to minimize back-exchange prior to MS. |
| Intact Protein Standard | Used for MS calibration and system suitability testing to ensure mass accuracy essential for detecting small ΔDa changes. |
| HDX Data Processing Software | Specialized software (e.g., HDExaminer, DynamX, PLGS) for automated peptide identification, uptake calculation, back-exchange correction, and statistical analysis. |
| High-Resolution Mass Spectrometer | Typically a Q-TOF or Orbitrap system, providing the high mass accuracy and resolution required to resolve isotopic envelopes of labeled peptides. |
This application note details the core advantages of Hydrogen-Deuterium Exchange Mass Spectrometry (HDX-MS) within the context of a broader thesis focusing on HDX-MS protocol development for conformational epitope mapping. This technique is pivotal for characterizing protein-ligand interactions in drug discovery, particularly for biologics like monoclonal antibodies.
I. Key Advantages in Epitope Mapping
The utility of HDX-MS in structural biology is underscored by three principal advantages, quantitatively demonstrated in recent studies.
Table 1: Comparative Analysis of HDX-MS Performance Metrics in Epitope Mapping Studies
| Advantage | Key Performance Metric | Typical Range / Value | Implication for Epitope Mapping |
|---|---|---|---|
| Sensitivity | Protein Amount Required per Time Point | 10 - 100 pmol (∼0.2 - 2 µg for a 20 kDa protein) | Enables study of low-yield, recombinant proteins and complex targets. |
| Sensitivity | Detection of Deuterium Incorporation Difference | ≥ 0.1 Da (∼5% relative difference in many cases) | Identifies subtle, allosteric conformational changes upon antibody binding. |
| Flexibility | Compatible Protein Buffer Components | Salts (NaCl, PBS), Glycerol (<10%), Detergents (e.g., DDM, CHAPS) | Allows screening of binding conditions close to functional assays; minimizes artifacts. |
| Flexibility | Molecular Weight Range of Analytes | 5 kDa - >200 kDa (with sub-unit analysis) | Maps epitopes on large, multi-domain antigens without size limitation. |
| Near-Native State | Maintained Non-covalent Complexes | Analysis under physiological pH (6.0-8.0) and temperature (0-37°C) | Preserves transient or weak antibody-antigen interactions (Kd µM-nM range). |
| Near-Native State | Solvent Accessibility Resolution | 5 - 20 amino acid peptide resolution (with MS/MS) | Localizes binding interface to a precise peptide segment. |
II. Detailed Protocol: Conformational Epitope Mapping via HDX-MS
The following protocol is optimized for mapping the epitope of a monoclonal antibody (mAb) bound to its protein antigen.
A. Sample Preparation
- Complex Formation: Incubate the antigen protein (at 5 µM) with a 1.2 molar excess of the mAb in PBS, pH 7.4, for 30 minutes at 25°C. A control sample of antigen alone is prepared identically.
- Buffer Matching: Use centrifugal concentrators (10 kDa MWCO) to exchange the antigen-only control into the complex buffer, ensuring identical solution conditions.
B. Deuterium Labeling
- Initiate labeling by diluting the antigen-antibody complex or antigen control 10-fold into deuterated PBS (pD 7.4, pre-chilled to 0°C).
- Allow labeling to proceed for three time points (e.g., 10 seconds, 1 minute, 10 minutes) at 0°C to capture exchange kinetics.
- Quench the reaction by adding an equal volume of pre-chilled quench buffer (400 mM KH₂PO₄/H₃PO₄, pH 2.2, 4 M Guanidine HCl) to achieve a final pH of ~2.5 and temperature of 0°C.
C. Sample Processing & MS Analysis
- Immediately inject the quenched sample onto a nano-UPLC system with an in-line pepsin column/immobilized protease cartridge (held at 2°C).
- Digest the protein online for ~3 minutes. Trap the resulting peptides on a C18 trap column and desalt.
- Separate peptides using a fast, steep acetonitrile gradient (5-35% in 7 minutes) on a C18 analytical column (held at 0°C) and elute directly into a high-resolution mass spectrometer (e.g., Q-TOF, Orbitrap).
- Acquire data in data-independent (MSE) or data-dependent acquisition (DDA) mode.
D. Data Analysis
- Process undeuterated control data to identify peptides using standard proteomics software (e.g., PLGS, Byos, HDExaminer).
- Calculate deuterium incorporation for each peptide at each time point by measuring the centroid mass shift.
- Identify significant differences in deuterium uptake between the antigen-alone and antigen-mAb complex samples. A significant protection (reduced deuterium uptake) in the complex localizes the antibody epitope.
III. Workflow and Pathway Visualization
Diagram Title: HDX-MS Conformational Epitope Mapping Workflow
Diagram Title: HDX-MS Advantages Converge on Epitope Mapping
IV. The Scientist's Toolkit: Essential Research Reagents & Materials
Table 2: Key Reagent Solutions for HDX-MS Epitope Mapping
| Item | Specification / Example | Function in Protocol |
|---|---|---|
| Deuterium Labeling Buffer | PBS, pD read 7.4 (99.9% D₂O) | Source of deuterium for exchange reaction; must match control buffer in composition aside from D/H. |
| Quench Buffer | Low pH (2.0-2.5), denaturing (e.g., 2-4 M GuHCl, 0.5-1 M TCEP) | Rapidly lowers pH and temperature to halt exchange, denatures protein for digestion. |
| Immobilized Protease | Pepsin or protease XIII immobilized on agarose/silica | Provides rapid, consistent, and cold-tolerant digestion for peptide generation. |
| Chromatography Columns | 1. Peptide trap column (C18, 2.1 mm).2. Analytical UPLC column (C18, 1.0 mm). | Desalting and separation of peptides under low pH, low temperature conditions. |
| LC Solvents | A: 0.1% Formic Acid in H₂O.B: 0.1% Formic Acid in Acetonitrile. | Mobile phases for reversed-phase LC separation compatible with MS detection. |
| MS Calibration Standard | NaI or CsI cluster ions; intact protein standard (e.g., Leu-Enk). | Provides accurate mass calibration for high-resolution measurement of small mass shifts. |
| Data Analysis Software | HDExaminer, DynamX, Mass Spec Studio, HDX Workbench. | Specialized software for automated peptide identification, deuterium calculation, and statistical analysis of differences. |
Step-by-Step HDX-MS Protocol: From Lab Bench to Data Acquisition
Within the context of Hydrogen-Deuterium Exchange Mass Spectrometry (HDX-MS) for conformational epitope mapping, the quality of the final data is fundamentally dependent on the initial stages of sample preparation. Buffer optimization and the formation of a stable, homogeneous antigen-antibody complex are critical prerequisites. This application note details protocols and considerations for these foundational steps to ensure successful HDX-MS experiments aimed at elucidating antibody binding sites on protein antigens.
Buffer Optimization for HDX-MS
The selection and optimization of the labeling buffer are paramount, as it must maintain protein stability and complex integrity while enabling efficient deuterium exchange.
Key Buffer Components and Considerations
- pD (pH) Control: The labeling reaction is pD-dependent. A standard labeling pD is 7.4, adjusted using meter readings with a +0.4 correction factor (pH meter reading of 7.0 ≈ pD 7.4). Buffers must have minimal temperature and isotope effects (e.g., phosphates).
- Salt Concentration: Essential for maintaining complex solubility and stability, but high concentrations can cause signal suppression in MS. Optimal range is typically 50-150 mM.
- Additives: Minimize non-specific exchange and maintain protein folding. Common additives include reducants (e.g., TCEP) and stabilizers (e.g., L-Arg/L-Glu).
Quantitative Buffer Optimization Parameters
The following table summarizes optimal ranges for key buffer parameters as established in recent literature.
Table 1: Optimal Buffer Parameters for HDX-MS Epitope Mapping
| Parameter | Optimal Range | Recommended Standard | Function & Rationale |
|---|---|---|---|
| pD (Labeling) | 6.8 - 8.0 | 7.4 (pH meter reading 7.0) | Maximizes amide exchange rate for measurable window; maintains native state. |
| Buffer Species | Phosphate, Tris, HEPES | 20 mM Potassium Phosphate | Low pH/temp coefficient; minimal salt & isotope effects. |
| Salt (NaCl/KCl) | 50 - 150 mM | 100 mM | Maintains complex solubility & stability without MS interference. |
| Reducing Agent | 0.5 - 2 mM TCEP | 1 mM TCEP | Maintains reduced state; superior to DTT in deuterated buffers. |
| Stabilizing Additives | 50-100 mM L-Arg/Glu | 50 mM L-Arg, 50 mM L-Glu | Reduces aggregation; improves chromatographic peak shape. |
| Chaotropes/Denaturants | Avoid | N/A | Disrupts native structure, invalidating epitope mapping. |
Protocol: Preparation of Optimized Deuteration Buffer
Objective: To prepare 100 mL of HDX labeling buffer (20 mM KPi, 100 mM NaCl, pD 7.4). Materials:
- K₂HPO₄ (anhydrous)
- KH₂PO₄ (anhydrous)
- NaCl
- D₂O (99.9% deuterium)
- pH meter with glass electrode
Procedure:
- Prepare 20 mM Potassium Phosphate stock in H₂O, pH 7.0.
- Add solid NaCl to a final concentration of 100 mM.
- Lyophilize 10 mL of the buffer to complete dryness.
- Reconstitute the lyophilized powder in 10 mL of 99.9% D₂O. Vortex thoroughly.
- Measure the pH using a standard pH meter. The observed reading is the pH meter reading. The pD is calculated as: pD = pH meter reading + 0.4.
- If adjustment is needed, use minute volumes of concentrated NaOD in D₂O (to increase pD) or DCl in D₂O (to decrease pD).
- Filter through a 0.22 µm membrane. Store at 4°C; use within 2 weeks.
Antigen-Antibody Complex Formation
A stoichiometric, homogeneous, and stable complex is essential for mapping the true conformational epitope.
Critical Parameters for Complex Formation
- Stoichiometry: A known, fixed molar ratio (typically 1:1 for IgG:antigen) is required. Excess of either component leads to unbound population, complicating HDX data.
- Purity: Both components must be highly pure (>95%) via SEC or SDS-PAGE to avoid confounding MS signals.
- Stability: The complex must remain intact throughout the duration of the HDX labeling reaction (minutes to hours) at the labeling temperature (often 0-4 °C).
Protocol: Formation and Validation of Antigen-Antibody Complex
Objective: To form a 1:1 molar complex of monoclonal antibody (mAb) and protein antigen and validate its homogeneity.
Materials:
- Purified monoclonal IgG (≥ 1 mg/mL)
- Purified protein antigen (≥ 1 mg/mL)
- Assay Buffer (e.g., PBS or optimized HDX quench buffer analogue)
- Size Exclusion Chromatography (SEC) column (e.g., Superdex 200 Increase)
- Analytical SEC-HPLC system or LC-SEC-MS system
Procedure:
- Determine Concentrations: Precisely determine protein concentrations using A280 absorbance with calculated extinction coefficients.
- Mix for Complexation: Combine the mAb and antigen at a 1:1.2 molar ratio (antigen in slight excess) in assay buffer. Typical final complex concentration is 5-20 µM.
- Incubate: Incubate the mixture for 60 minutes at room temperature, followed by 30 minutes on ice.
- Purify Complex (SEC): Inject the mixture onto a pre-equilibrated SEC column. Use an isocratic flow with assay buffer to separate the complex from unbound antigen and antibody.
- Validate:
- Analyze SEC chromatogram for a single, symmetric peak at an elution volume corresponding to the expected molecular weight of the complex (~150 kDa for IgG + antigen).
- Collect the peak fraction.
- Confirm stoichiometry and homogeneity via native mass spectrometry or SEC-MALS (Multi-Angle Light Scattering).
- Concentration and Storage: Concentrate the purified complex fraction using a centrifugal concentrator to the desired working concentration (typically 10-50 µM). Aliquot, flash-freeze in liquid nitrogen, and store at -80°C until HDX-MS experiment.
The Scientist's Toolkit: Key Reagents & Materials
Table 2: Essential Research Reagent Solutions for HDX-MS Sample Prep
| Item | Function in Epitope Mapping Sample Prep |
|---|---|
| High-Purity D₂O (≥99.9%) | Source of deuterium for the HDX labeling reaction; purity minimizes back-exchange. |
| Deuterium-Free Quench Buffer | Low-pH, low-temperature buffer (e.g., 0.1% FA, 4°C) to halt HDX, compatible with LC-MS. |
| Immobilized Pepsin Column | Provides rapid, reproducible digestion under quench conditions (pH ~2.5, 0°C) for peptide-level analysis. |
| Size Exclusion Chromatography Resin | Critical for purifying the antigen-antibody complex to homogeneity and removing unbound species. |
| Acidic LC Solvents (0.1% FA) | Used for peptide separation; low pH minimizes back-exchange during LC analysis. |
| Reducing Agent (TCEP) | Maintains disulfide bond reduction in deuterated buffers without isotope effects. |
Visual Workflows
Figure 1: Deuteration Buffer Preparation Workflow
Figure 2: Antigen-Antibody Complex Formation & Validation
Within the broader thesis on Hydrogen-Deuterium Exchange Mass Spectrometry (HDX-MS) for conformational epitope mapping, the initial labeling reaction is the critical, rate-limiting step. This phase dictates the resolution at which protein dynamics and ligand-binding interfaces can be probed. Precise control over time and temperature during the deuteration reaction is non-negotiable for generating reproducible, high-quality data that accurately reflects regional solvent accessibility and conformational changes upon antigen-antibody complex formation.
Key Parameters for the HDX Reaction
The deuteration rate is governed by intrinsic chemical exchange rates, which are highly dependent on pH and temperature, and by protein structural factors. The following table summarizes the core parameters for a standard HDX-MS workflow in epitope mapping.
Table 1: Core HDX Reaction Parameters for Epitope Mapping
| Parameter | Standard Condition | Purpose & Rationale |
|---|---|---|
| Labeling pH (pD) | pD 7.4 (pHread 7.0) | Mimics physiological conditions; optimal exchange rate for amide hydrogens. |
| Labeling Buffer | 10-50 mM phosphate or PBS | Provides minimal buffering capacity to maintain stable pD during dilution. |
| D₂O Concentration | >99% D₂O | Maximizes deuterium incorporation gradient. |
| Protein Concentration | 1-10 µM (post-dilution) | Balances signal intensity with minimizing aggregation/refolding artifacts. |
| Key Temperatures | 0°C (quench), 25°C (standard label), 4°C (slow label) | Temperature is a primary lever for controlling exchange kinetics (see Table 2). |
| Time Course Points | 10s, 30s, 1m, 5m, 10m, 30m, 1h, 2h, 4h | Captures fast, medium, and slow-exchanging regions for comprehensive coverage. |
Table 2: Effect of Temperature on Deuteration Kinetics
| Temperature | Relative Exchange Rate* (vs. 25°C) | Application in Epitope Mapping |
|---|---|---|
| 0°C (Quench) | ~0.01x | Halts exchange; used in quenching solution (low pH, low T). |
| 4°C | ~0.25x | "Slow" labeling for highly dynamic regions or very stable complexes. |
| 25°C | 1.0x (Reference) | Standard condition for most pharmaceutical protein studies. |
| 37°C | ~2.5x | Accelerates exchange, useful for probing very protected regions. |
*Approximate rate change per 10°C rule-of-thumb (Q10~3).
Experimental Protocol: Time-Course and Temperature-Controlled Labeling
Preparation of Labeling Buffers
- Prepare a 10x stock of labeling buffer (e.g., 200 mM sodium phosphate) in H₂O, pH meter reading 7.0.
- Dilute the 10x stock 1:10 into 99.9% D₂O to create the Deuteration Buffer (final 20 mM phosphate, pD ~7.4). Filter (0.22 µm) and pre-equilibrate to desired labeling temperatures (e.g., 4°C, 25°C).
- Prepare Quench Buffer: 3 M Guanidine-HCl, 0.1% Formic Acid (v/v) in H₂O, pH 2.2-2.5. Pre-chill to 0°C.
Labeling Reaction Setup (Manual)
This protocol is for a single time point. For a full time course, reactions are initiated sequentially and quenched at their respective time points.
- Pre-incubation: Incubate your protein or protein-antibody complex (in H₂O-based buffer) at the target labeling temperature for 5 minutes.
- Initiation: Dilute the protein sample 1:10 (v/v) into the pre-equilibrated Deuteration Buffer to initiate exchange. Mix rapidly by pipetting.
- Example: 9 µL of D₂O buffer + 1 µL of 10 µM protein complex.
- Time-Course Incubation: Maintain the reaction tube at the precise target temperature (±0.2°C) using a calibrated thermocycler or water bath.
- Quenching: At the predetermined time point, withdraw the labeling reaction and mix 1:1 (v/v) with ice-cold Quench Buffer.
- Example: 10 µL of labeling reaction + 10 µL of quench buffer. Final pH ~2.5, temperature ~0°C.
- Immediate Processing: The quenched sample must be immediately injected for LC-MS analysis or flash-frozen in liquid N₂ for analysis within 1-2 weeks.
Automated HDX Platform Workflow
For higher reproducibility and dense time-course data, automated systems are preferred.
Title: Automated HDX-MS Workflow for Epitope Mapping
The Scientist's Toolkit: Essential Reagents & Materials
Table 3: Key Research Reagent Solutions for HDX Reactions
| Item | Function & Criticality |
|---|---|
| High-Purity D₂O (≥99.9%) | Source of deuterium label. Purity is essential to maintain pD and minimize back-exchange. |
| Deuterium-Free Buffers (Phosphate, PBS) | H₂O-based buffer stocks for making D₂O labeling buffer. Must be volatile-compatible for MS. |
| Quench Buffer (Low-pH, Denaturing) | Rapidly drops pH to ~2.5 and temperature to 0°C, halting exchange. Contains denaturant (GnHCl) to unfold protein for digestion. |
| Immobilized Pepsin Column | Provides rapid, reproducible digestion at low pH and temperature (0-4°C) to minimize back-exchange post-quench. |
| Trapping Cartridge (C18 or C8) | Desalts and concentrates peptides prior to analytical separation, crucial for sensitivity. |
| UPLC System with Peltier Chiller | Maintains entire liquid path (injection valve, columns) at 0°C to minimize back-exchange during analysis. |
| High-Resolution Mass Spectrometer | Accurately measures small mass shifts (+1 Da per incorporated D) with high mass accuracy and resolution. |
| Precision Temperature Control Devices | Thermostated water baths, chillers, or automated robot enclosures to maintain labeling T ±0.2°C. |
Title: Factors Governing the HDX Reaction Output
Within the broader context of an HDX-MS protocol for conformational epitope mapping, the steps of quenching and digestion are critical junctures that dictate the success of the experiment. The primary goal is to rapidly reduce the deuterium exchange rate (quenching) and then cleave the labeled protein into peptides (digestion) for subsequent LC-MS/MS analysis, all while minimizing back-exchange to preserve the deuteration pattern. This document outlines optimized Application Notes and Protocols for these steps.
The Scientist's Toolkit: Essential Research Reagent Solutions
| Item | Function in HDX-MS Quenching/Digestion |
|---|---|
| Quench Buffer (Low pH, Low T) | Typically 0.1-1.0% formic acid, pH ~2.5, 0°C. Rapidly lowers pH to slow amide hydrogen exchange (kex ~10^-3 min^-1 at pH 2.5, 0°C). |
| Immobilized Pepsin | Protease immobilized on agarose or magnetic beads. Enables rapid digestion (seconds) and easy removal to stop proteolysis, minimizing back-exchange. |
| Reducing Agent (TCEP) | Tris(2-carboxyethyl)phosphine, added to quench buffer. Reduces disulfide bonds under acidic conditions, improving peptide yield and coverage. |
| Chaotropic Agent (GdnHCl) | Low concentration (0.2-0.5 M) guanidine hydrochloride in quench. Aids unfolding and improves digestion efficiency for some refractory proteins. |
| On-line Digestion System | Immobilized enzyme reactor (IMER) in a temperature-controlled chamber (e.g., 10-15°C) integrated into the LC system for automated, reproducible digestion. |
| Alternative Proteases | e.g., Nepenthesin-1, Aspergillopepsin. Used in tandem with or as substitutes for pepsin to alter cleavage specificity and increase sequence coverage. |
Quantitative Optimization Data
Table 1: Impact of Quench pH and Temperature on Back-Exchange
Data based on typical amide hydrogen exchange kinetics. Back-exchange is measured as % loss of deuterium label before MS analysis.
| Quench pH | Temperature (°C) | Approx. Back-Exchange Rate (%/min)* | Recommended Hold Time |
|---|---|---|---|
| 2.3 | 0 | ~0.5 - 0.7 | < 3 minutes |
| 2.5 | 0 | ~0.7 - 1.0 | < 2 minutes |
| 2.5 | 4 | ~1.5 - 2.0 | < 1 minute |
| 2.7 | 0 | ~1.2 - 1.5 | < 1 minute |
*Rates vary based on peptide sequence. Data emphasizes need for speed post-quench.
Table 2: Protease Performance Comparison for HDX-MS
Summary of key protease characteristics affecting peptide yield and coverage.
| Protease | Optimal pH | Typical Digestion Time | Key Cleavage Specificity | Key Advantage for HDX |
|---|---|---|---|---|
| Pepsin (sol.) | 2.0 - 2.5 | 30 sec - 2 min | Broad, hydrophobic/aromatic | Well-characterized, high activity at low pH |
| Nepenthesin-1 | 2.0 - 2.5 | 30 sec - 2 min | Broad, slight preference for basic | Complementary coverage to pepsin |
| Aspergillopepsin | ~2.0 | 1 - 3 min | Broad | Effective for membrane proteins |
| Immobilized Pepsin | 2.0 - 2.5 | 30 sec - 1 min | Broad | No self-digestion, rapid separation |
Detailed Protocols
Protocol 1: Standard Off-line Quenching and Immobilized Pepsin Digestion
Objective: To rapidly halt HDX and digest the protein under minimal back-exchange conditions.
Materials:
- Pre-labeled protein sample
- Pre-chilled (0°C) quench buffer: 0.1% Formic Acid, 0.2 M TCEP, 0.5 M GdnHCl, pH ~2.5
- Slurry of immobilized pepsin beads (e.g., agarose-immobilized pepsin)
- Water bath or cooler set to 0°C
- Low-binding microcentrifuge tubes
- Centrifuge
Procedure:
- Quenching: At the desired deuteration time point, dilute the labeling reaction 1:1 (v/v) with the ice-cold quench buffer. Vortex briefly and immediately place on ice. The effective pH must be ≤ 2.5 and temperature ≤ 0°C.
- Digestion Setup: Prepare a micro-spin column or tube with immobilized pepsin slurry (e.g., 10 µL settled bead volume). Wash beads twice with 100 µL of ice-cold quench buffer (without additives) by brief centrifugation.
- Digestion: Apply the quenched protein sample directly onto the washed beads. Gently flick to mix.
- Incubate: Place the tube in a 0°C ice-water bath and incubate for exactly 60 seconds. For refractory proteins, incubation at 10°C for 60 seconds may be tested.
- Stop Digestion: Centrifuge the tube at 4°C for 10-15 seconds to separate the digest supernatant from the beads. Immediately proceed to injection onto the UPLC system, which is held at 0°C.
Protocol 2: On-line Digestion Using an Immobilized Enzyme Reactor (IMER)
Objective: To achieve fully automated, highly reproducible digestion with minimal manual handling time and back-exchange.
Materials:
- HDX-MS system with dual UPLC setups and valve switching
- Commercially available or custom-packed Pepsin IMER cartridge (e.g., 2 mm x 20 mm)
- Trap column (e.g., C8 or C18, held at 0°C)
- Analytical column (C18, 0°C)
- Solvent A: 0.1% Formic Acid in water
- Solvent B: 0.1% Formic Acid in acetonitrile
- Pumps and chillers capable of maintaining 0°C
Procedure:
- System Configuration: The IMER is placed in a temperature-controlled chamber set to 10-15°C (optimal for pepsin activity) within a loop of the injection valve, upstream of the trap column (held at 0°C).
- Quenching & Injection: The deuterated sample is manually or robotically mixed 1:1 with ice-cold quench buffer and immediately injected onto the system.
- On-line Digestion: The quenched sample is pumped (e.g., at 100 µL/min) through the IMER with 0.1% FA. Digestion occurs during the ~30-second transit time through the enzyme column.
- Peptide Trapping: The digest effluent is directed onto the trap column at 0°C. Peptides are desalted and concentrated, while solvents like GdnHCl are washed to waste.
- LC-MS/MS Analysis: After a brief wash, the trap column is switched in-line with the analytical column for gradient elution and MS analysis.
Experimental Workflow Diagrams
Title: HDX-MS Quenching and Digestion Core Workflow
Title: On-line HDX Digestion System Schematic
Liquid Chromatography and Mass Spectrometry Setup for Deuteron Detection
This protocol details the setup for deuteron detection via Hydrogen/Deuterium Exchange Mass Spectrometry (HDX-MS) as a core component of a thesis focused on conformational epitope mapping for therapeutic antibody development. Precise detection of deuterium incorporation into protein peptides is critical for mapping antibody-antigen interaction surfaces at amino-acid resolution.
LC-MS System Configuration for HDX-MS
Core System Requirements
The setup must minimize back-exchange and maintain low temperatures to preserve deuterium labels.
Table 1: Essential LC-MS Configuration Parameters
| Component | Specification | Purpose |
|---|---|---|
| LC System | Nano-flow, 2D-HPLC with trapping column | Desalting and rapid separation to minimize back-exchange. |
| Analytical Column | Reverse-phase C18, 1.0 mm ID, 5 cm length, sub-2µm particles | High-resolution peptide separation at 0°C. |
| Mobile Phase A | 0.1% Formic Acid in H₂O, 0°C | Acidic conditions protonate peptides and quench exchange. |
| Mobile Phase B | 0.1% Formic Acid in Acetonitrile, 0°C | Organic solvent for gradient elution. |
| LC Temperature | 0°C (entire flow path post-injection) | Critically suppresses back-exchange (<10%). |
| Gradient Duration | 7-10 minutes | Balances separation speed with peptide resolution. |
| Mass Spectrometer | High-resolution Q-TOF or Orbitrap (≥ 60,000 resolution) | Accurate mass measurement for deuteration shift detection. |
| Ion Source | Nano-electrospray, low temperature | Gentle ionization for intact peptides. |
| Data Acquisition | Data-dependent or targeted MS/MS (HD⁷⁺ mode recommended) | Enables peptide identification and deuteration analysis. |
Protocol: System Setup and Conditioning
- Pre-cooling: Install the analytical column in a column oven or insulated block and cool to 0°C. Place all mobile phase solvents on ice or in a refrigerated chamber for ≥1 hour prior.
- System Equilibration: Flush the entire system (trapping and analytical columns) with 100% Mobile Phase A at 40 µL/min for 30 minutes at 0°C.
- MS Calibration: Calibrate the mass spectrometer using a standard tune mix (e.g., NaI) in the intended acquisition mass range (typically 300-2000 m/z).
- Back-exchange Test: Inject a standard deuterated peptide (e.g., deuterated angiotensin II) and process through the full workflow. Calculate back-exchange as:
(D_initial - D_detected) / D_initial * 100%. Optimize if result exceeds 10-15%.
Experimental Protocol: HDX Workflow for Epitope Mapping
Reagent Solutions & Materials
Table 2: The Scientist's Toolkit - Key HDX Reagents
| Item | Function | Critical Notes |
|---|---|---|
| Deuterium Buffer (⁷²O) | Exchange buffer for labeling. | pH 7.4, 25 mM phosphate, 100 mM NaCl. Pre-chilled. |
| Quench Buffer | Stops H/D exchange and denatures protein. | 4M Guanidine HCl, 0.8% Formic Acid, pH ~2.3, -0°C. |
| Immobilized Pepsin | Protease for digestion under quench conditions. | Poroszyme immobilized enzyme cartridge, held at 10-15°C. |
| Trapping Column | Desalts and concentrates peptides pre-analysis. | C8 or C18, 2 cm length, held at 0°C. |
| Reducing Agent (TCEP) | Optional, for disulfide bond reduction during quench. | Added to quench buffer for complex antibodies. |
Detailed Stepwise Protocol
Part A: Deuterium Labeling
- Prepare 10 µL of antibody-antigen complex (10 µM) in H₂O buffer.
- Initiate exchange by diluting 1:10 (v/v) into pre-chilled deuterated buffer. Incubate for defined timepoints (e.g., 10s, 1min, 10min, 1h) at 25°C.
- Quench by adding 50 µL of ice-cold Quench Buffer to 50 µL of labeling reaction, vortex immediately. Final pH must be < 2.5, temperature ≤ 0°C.
Part B: Digestion & LC-MS Analysis
- Immediately inject the quenched sample onto the immobilized pepsin column (held at 15°C) at 100 µL/min with 0.1% FA in H₂O.
- Digest for 60-90 seconds. Elute peptides onto the trapping column at 0°C.
- Switch valve; elute peptides from the trap onto the analytical C18 column (0°C) with a fast acetonitrile gradient (5-35% B in 7 min).
- Acquire data in high-resolution MS1 mode (60,000+ resolution). Use parallel MS/MS acquisitions for peptide identification in separate, non-deuterated samples.
Part C: Data Processing
- Process non-deuterated files for peptide identification (using Mascot, Sequest, or PEAKS).
- Use dedicated HDX software (HDExaminer, DynamX, Mass Spec Studio) to:
- Extract deuterium incorporation for each peptide/timepoint.
- Correct for back-exchange using a fully deuterated control.
- Calculate relative deuterium uptake difference (∆D) between bound and unbound states to identify protected regions (epitope).
Data Presentation & Analysis
Table 3: Example Deuteration Data Output for Epitope Mapping
| Peptide Sequence | Position | Uptake (Unbound) at 1min (Da) | Uptake (Bound) at 1min (Da) | ∆D (Da) | Protection (Y/N) |
|---|---|---|---|---|---|
| AANDGYYFQH | 145-154 | 4.12 ± 0.15 | 1.05 ± 0.30 | -3.07 | Yes |
| SVFLFPPKP | 155-163 | 3.98 ± 0.22 | 4.01 ± 0.18 | +0.03 | No |
| DTLMISR | 180-186 | 5.89 ± 0.10 | 2.45 ± 0.25 | -3.44 | Yes |
Interpretation: Peptides showing significant negative ∆D (e.g., >0.5 Da combined with statistical significance) are considered protected from exchange in the bound state, indicating direct involvement in the binding interface or allosteric effects.
Within the broader context of a thesis on Hydrogen-Deuterium Exchange Mass Spectrometry (HDX-MS) for conformational epitope mapping, robust data processing is paramount. This protocol details the computational workflow required to transform raw HDX-MS data into meaningful deuteration levels, enabling the identification of protein regions whose solvent accessibility changes upon ligand (e.g., antibody) binding, thus mapping the epitope.
The Scientist's Toolkit: Essential Research Reagent Solutions
| Item | Function in HDX-MS Workflow |
|---|---|
| Deuterium Oxide (D₂O) | The labeling reagent; provides the deuterons exchanged onto the protein backbone amides. |
| Quench Buffer (Low pH, low T) | Halts HDX by dropping pH to ~2.5 and temperature to 0°C, typically containing a denaturant (e.g., GuHCl) and a reducing agent. |
| Immobilized Pepsin | The protease for online digestion under quench conditions, generating peptides for analysis. |
| Reverse-Phase UPLC Column | Desalts and separates peptides rapidly prior to MS analysis, minimizing back-exchange. |
| Mass Spectrometer (High-Res) | Measures the mass of peptides and their deuterium content. Time-of-Flight (TOF) or Orbitrap instruments are standard. |
| HDX-MS Data Processing Software | Platforms like HDExaminer, DynamX, or Mass Spec Studio automate peptide identification, centroid calculation, and deuteration analysis. |
Experimental Protocols
Protocol 1: HDX-MS Experiment for Epitope Mapping
- Labeling: Incubate the antigen protein alone and in complex with the antibody in D₂O-based buffer for defined time points (e.g., 10s, 1min, 10min, 1hr) at controlled temperature (e.g., 25°C).
- Quenching: Mix the labeling reaction 1:1 with pre-chilled quench buffer.
- Digestion & Separation: Inject the quenched sample onto an immobilized pepsin column, followed by a reverse-phase UPLC trap/column held at 0°C.
- Mass Spectrometry Analysis: Elute peptides directly into a high-resolution mass spectrometer. Acquire data in data-independent (MS^E) or data-dependent acquisition (DDA) mode.
- Control Samples: Include fully deuterated (for max D) and non-deuterated (for 0% D) controls.
Protocol 2: Peptide Identification from Non-Deuterated Controls
- Data Acquisition: Run triplicate non-deuterated (all H) samples with MS/MS fragmentation enabled.
- Database Search: Process MS/MS data using standard search engines (e.g., Mascot, Sequest, PEAKS) against the protein sequence database.
- Filtering Criteria: Apply filters: peptide score > threshold, length 5-20 residues, MS1 mass error < 5 ppm, and manual validation of key peptides.
- Peptide List Creation: Export a final list of peptides with sequence, charge state, retention time, and mass for use in the deuteration calculation workflow.
Data Processing Workflow
The core computational pipeline involves sequential steps to calculate deuteration levels for each peptide at each time point.
Diagram 1: HDX-MS data processing workflow
Step 1: Peptide Identification & Mapping Using the peptide list from Protocol 2, software extracts the exact mass and retention time for each peptide across all deuterated samples.
Step 2: Centroid Calculation For each peptide isotopic envelope, the software calculates the weighted average mass (centroid). The change in centroid mass relative to the non-deuterated control is the raw deuterium uptake.
Step 3: Back-Exchange & Deuterium Loss Correction
A correction is applied to account for loss of deuterium (back-exchange) during sample handling and LC-MS.
%D_corrected = ( (m_t - m_0%) / (m_100% - m_0%) ) * 100
where m_t is centroid at time t, m_0% is non-deuterated mass, and m_100% is fully deuterated control mass.
Step 4: Deuteration Calculation The corrected deuterium uptake (in Da or %) is calculated for each peptide at each time point for both antigen and antigen-antibody complex states.
Step 5: Differential HDX Analysis The final output is the difference in deuteration between the complex and the antigen alone (ΔD). A significant difference (typically >±0.5 Da and >±5% at one time point) indicates protection (negative ΔD) or deprotection (positive ΔD) from exchange.
Quantitative Data Presentation
Table 1: Example Deuteration Data for a Representative Peptide (Sequence: ALDVGTAK)
| Time Point | State | Centroid Mass (Da) | Uptake (Da) | Corrected %D | Δ%D (Complex - Alone) |
|---|---|---|---|---|---|
| 10 s | Antigen Alone | 800.5123 | 1.52 | 19.0 | - |
| 10 s | Antigen-Complex | 800.4298 | 0.44 | 5.5 | -13.5 |
| 1 min | Antigen Alone | 800.5981 | 2.60 | 32.5 | - |
| 1 min | Antigen-Complex | 800.4705 | 1.48 | 18.5 | -14.0 |
| 10 min | Antigen Alone | 800.6654 | 3.34 | 41.8 | - |
| 10 min | Antigen-Complex | 800.5922 | 2.61 | 32.6 | -9.2 |
| Fully Deuterated Ref. | - | 800.8320 | 5.00 | 100.0 | - |
Table 2: Key Statistical Validation Metrics for the Workflow
| Parameter | Target Value | Purpose |
|---|---|---|
| Peptide Sequence Coverage | >95% of protein | Ensures comprehensive analysis. |
| Average Redundancy | ≥3 peptides per region | Increases confidence in localization. |
| Replicate Reproducibility (SD of %D) | <±0.15 Da or <±5% | Validates experimental precision. |
| Significance Threshold (Δ%D) | >±0.5 Da AND >±5% (at one time point) | Minimizes false positives in epitope mapping. |
Diagram 2: Logic for identifying significant HDX changes
Solving Common HDX-MS Challenges: Back-Exchange, Data Quality, and Reproducibility
Within the broader thesis on HDX-MS protocol for conformational epitope mapping, the minimization of back-exchange is paramount. Back-exchange, the re-introduction of deuterons with solvent protons after the deuterated exchange reaction has been quenched, leads to an underestimation of deuteration levels and loss of structural resolution. This application note details optimized Liquid Chromatography (LC) and sample handling protocols to preserve the deuterium label, thereby ensuring data accuracy for mapping antibody-antigen interaction sites.
The following table summarizes key experimental parameters and their optimal ranges for minimizing back-exchange during the HDX-MS workflow, post-quench.
Table 1: Optimized Parameters for Back-Exchange Minimization
| Parameter | Optimal Range/Setting | Rationale & Impact |
|---|---|---|
| Quench Solution pH | 2.3 - 2.5 | Maximizes protonation state, slowing back-exchange kinetics. |
| Quench Temperature | 0 - 4 °C | Low temperature drastically reduces back-exchange rate. |
| LC Mobile Phase pH | 2.3 - 2.5 | Maintains low pH throughout desalting/separation. |
| LC System Temperature | 0 °C (Trapping & Column) | Cold environment is critical from injection to MS source. |
| Peptide Desalting Time | ≤ 5 minutes | Minimizes time peptides are exposed to aqueous solvent. |
| Gradient Length | As fast as resolution allows (~5-10 min) | Reduces LC run time, limiting back-exchange window. |
| Electrospray Source | Minimal in-source fragmentation | Low voltage/temperature settings prevent gas-phase back-exchange. |
Detailed Experimental Protocols
Protocol 3.1: Ultra-Cold, Low-pH LC System Setup
Objective: To configure an LC system that maintains sub-zero temperatures and consistent low pH from injection to MS source. Materials: UHPLC system, pepsin/acidic protease column, C18 trap column, analytical C18 column, ice-water slurry, chilled coolant circulator, mobile phase A (0.1% Formic Acid in water, pH ~2.4), mobile phase B (0.1% Formic Acid in acetonitrile, pH ~2.4). Procedure:
- Place the entire pepsin/protease column, trap column, and analytical column inside a custom-made or commercial chilling chamber.
- Connect the chamber to a refrigerated circulator set to -1 to 0 °C. Ensure all tubing entering/exiting the chamber is minimally exposed.
- Pre-chill all mobile phases in the LC system solvent racks to 0°C using an ice bath or system cooler.
- Equilibrate the trap and analytical columns at starting conditions (e.g., 95% A, 5% B) at a low flow rate (e.g., 50 µL/min) for at least 15 minutes until backpressure stabilizes.
- Verify system temperature by measuring the eluent temperature at the column outlet; it should be ≤ 2 °C.
Protocol 3.2: Optimized Sample Handling Post-Quench
Objective: To process and inject the quenched HDX sample with minimal delay and thermal exposure. Materials: Quenched HDX sample (in 0.1% FA, 4°C), cooled autosampler (4°C or lower), LC system from Protocol 3.1. Procedure:
- After quenching the HDX reaction (1:1 v/v with chilled 0.1% FA), immediately place the sample tube on a pre-cooled (0°C) rack or autosampler.
- Program the autosampler to draw and inject the sample rapidly. Keep the syringe and injection loop at 4°C.
- For online digestion: Inject the quenched protein sample onto the immobilized pepsin column held at 10-15°C (a compromise between digestion efficiency and back-exchange).
- For trapped peptides: The digested peptides are captured on the C18 trap column at 0°C. Desalt with 0.1% FA for 2-3 minutes only.
- Immediately start the fast, cold gradient elution to the analytical column and MS.
Visualization of Workflows
Title: HDX-MS Workflow with Critical Control Zones
Title: Schematic of Ultra-Cold, Low-pH LC System
The Scientist's Toolkit: Essential Reagents & Materials
Table 2: Key Research Reagent Solutions for Back-Exchange Minimization
| Item | Function & Importance |
|---|---|
| Deuterium Oxide (D₂O), 99.9% | Exchange-in buffer for primary HDX reaction. High purity ensures accurate deuteration baseline. |
| Quench Buffer (0.1% Formic Acid, 0-4°C) | Lowers pH to ~2.5 and temperature to slow back-exchange. Must be pre-chilled and pH-verified. |
| Immobilized Pepsin Column | Enables rapid, online digestion at low pH (2.3-2.5), minimizing the time between quench and trapping. |
| Chilled Mobile Phases (0.1% FA in H₂O & ACN) | Pre-cooled solvents maintain the cold temperature of the LC flow path, suppressing back-exchange. |
| Refrigerated Circulator / Chilling Chamber | Actively cools the trap and analytical columns to 0°C, a non-negotiable requirement for label preservation. |
| Cold Autosampler (4°C or lower) | Keeps quenched samples cold prior to injection, preventing back-exchange during wait times. |
| Low-Permeability HPLC Vials & Caps | Prevents sample evaporation and potential warming, which can concentrate samples and increase back-exchange. |
Improving Sequence Coverage and Peptide Redundancy
Within the broader thesis on Hydrogen-Deuterium Exchange Mass Spectrometry (HDX-MS) for conformational epitope mapping, achieving high sequence coverage and peptide redundancy is paramount. This application note details protocols to optimize these parameters, which are critical for accurately localizing antibody-binding regions on antigen proteins. Enhanced coverage and redundancy increase confidence in deuterium uptake measurements, directly impacting the reliability of epitope mapping data used in therapeutic antibody development.
Key Strategies for Optimization
Based on current literature and practice, optimization focuses on three pillars: sample handling, digestion efficiency, and LC-MS/MS data acquisition.
Table 1: Summary of Optimization Strategies and Expected Impact
| Strategy Category | Specific Action | Primary Impact | Expected % Increase in Coverage* |
|---|---|---|---|
| Sample Handling | Lower pH Quench (pH 2.0, 0°C) | Reduces back-exchange | 5-10% |
| Addition of Chaotropes (e.g., 0.5M GdnHCl) in Quench | Denatures protein, improves protease access | 10-15% | |
| Digestion | Immobilized Pepsin Column (vs. in-solution) | Increases consistency, reduces autolysis | 15-25% |
| Dual-Protease Strategy (Pepsin + AspN) | Generates overlapping, complementary peptides | 20-35% | |
| Optimization of Digestion Time (30 sec - 3 min) | Balances depth vs. deuterium loss | 5-10% | |
| LC-MS/MS | Nanoflow LC (300 nL/min) | Improves ionization efficiency | 10-20% |
| Long, Shallow C18 Gradients (e.g., 45-90 min) | Enhances chromatographic separation | 15-25% | |
| Data-Independent Acquisition (DIA) modes | Increases peptide detectability & redundancy | 20-30% | |
| High-Resolution Mass Analyzer (Orbitrap) | Improves peptide ID confidence | 5-15% |
*Estimated increases are relative to a baseline standard protocol and are protein-dependent.
Detailed Experimental Protocols
Protocol 3.1: Optimized Quench and Dual-Protease Digestion for HDX-MS
Objective: To maximize sequence coverage and peptide redundancy through minimized back-exchange and overlapping peptide generation.
Materials: See "The Scientist's Toolkit" (Section 6).
Procedure:
- HDX Labeling: Perform deuterium labeling of antigen (with/without bound antibody) as per primary thesis protocol.
- Optimized Quench:
- At each time point, dilute the labeling reaction 1:1 with pre-chilled (0°C) quench buffer (100 mM Phosphate, 0.5 M Guanidine HCl, pH 2.0).
- Immediately plunge the sample into an ethanol/dry ice bath or place on ice slush.
- Dual-Protease Digestion:
- Thaw immobilized pepsin column and equilibrate with 100 µL of quench buffer (0.1% FA, pH 2.5) at 200 µL/min.
- Load quenched sample onto the column at a flow rate of 50 µL/min. Collect digest eluate.
- In parallel, for the same quenched sample, add immobilized AspN (on bead) at a 1:5 enzyme:substrate ratio. Incubate with shaking (4°C, 3 min).
- Centrifuge AspN beads (10,000 x g, 1 min, 4°C) and collect supernatant.
- LC-MS/MS Analysis:
- Immediately inject pepsin and AspN digests separately.
- Trap and desalt peptides on a C18 trap column (5 µm, 5 x 0.3 mm) for 3 min at 30 µL/min with 0.1% FA.
- Elute onto analytical column (C18, 1.7 µm, 100 x 0.15 mm) using a 45-minute linear gradient from 8% to 35% solvent B (0.1% FA in ACN).
- Perform MS analysis using a DIA method: Full MS scan (400-1200 m/z, R=60,000) followed by 24 staggered variable windows DIA scans (R=30,000).
Protocol 3.2: Data Processing for Enhanced Coverage
Objective: To consolidate peptide identifications from multiple digests and acquisitions.
- Process pepsin and AspN DIA data files separately through a search engine (e.g., Spectronaut, DIA-NN) against the antigen sequence.
- Use a non-deuterated control sample to generate a spectral library.
- Apply stringent filters: peptide length 5-20 residues, MS1 mass error < 5 ppm.
- Merge peptide lists from both proteases, noting overlapping regions.
- Map all unique and overlapping peptides to the protein sequence to calculate final coverage and average redundancy (peptides/residue).
Visualization of Workflows and Relationships
Diagram 1: HDX-MS Optimization Workflow for Coverage
Diagram 2: Data Consolidation Logic for Coverage
Results and Data Presentation
Table 2: Example Optimization Results for a 50 kDa Model Antigen
| Experimental Condition | Sequence Coverage (%) | Avg. Redundancy (Peptides/Residue) | Unique Peptides Identified | % Deuterium Recovery |
|---|---|---|---|---|
| Standard Protocol (Solution Pepsin) | 78.2 | 2.1 | 112 | 92.5 |
| Optimized Protocol (Chaotrope Quench + Dual Protease + DIA) | 96.5 | 4.8 | 245 | 94.8 |
| Improvement (Absolute) | +18.3% | +2.7 | +133 | +2.3% |
The Scientist's Toolkit: Essential Research Reagents & Materials
Table 3: Key Reagents for HDX-MS Coverage Optimization
| Item | Function in Protocol | Example Product/Catalog # (for reference) |
|---|---|---|
| Deuterium Oxide (99.9% D) | Creates labeling buffer for HDX exchange. | Sigma-Aldrich, 151882 |
| Immobilized Pepsin Column | Provides consistent, rapid digestion with minimal autolysis. | Pierce Immobilized Pepsin, 20343 |
| Immobilized AspN (Endoproteinase) | Complementary protease to pepsin; cleaves N-terminal to Asp. | Roche, recombinant, purified |
| Guanidine Hydrochloride | Chaotropic agent in quench buffer to denature protein for protease access. | Thermo Scientific, 24115 |
| Trifluoroacetic Acid (TFA)/Formic Acid (FA) | Acidic modifiers for quench buffers and LC solvents to maintain low pH. | Pierce, 28904 / 28905 |
| Nanoflow UPLC System | Provides high-resolution, low-flow-rate chromatographic separation. | Waters M-Class, Thermo Easy-nLC 1200 |
| C18 Reverse-Phase Capillary Column | Stationary phase for peptide separation prior to MS. | 1.7 µm, 100 x 0.15 mm, e.g., Waters CSH |
| High-Resolution Mass Spectrometer | Accurate mass measurement for peptide identification and deuteration analysis. | Thermo Orbitrap Eclipse, Bruker timsTOF |
| Data-Independent Acquisition (DIA) Software | Enables complex data extraction from DIA MS files for peptide ID. | Spectronaut (Biognosys), DIA-NN (open-source) |
In hydrogen-deuterium exchange mass spectrometry (HDX-MS) for conformational epitope mapping, managing complex, time-dependent datasets is paramount. The primary challenge lies in distinguishing significant deuterium uptake differences that indicate antibody-induced protection from random experimental noise. This requires rigorous statistical frameworks and appropriately set significance thresholds to ensure robust, reproducible identification of epitope residues, directly impacting the accuracy of therapeutic antibody characterization in drug development.
Statistical Frameworks for HDX-MS Data Analysis
HDX-MS data analysis involves comparing deuterium uptake between the antigen alone and the antigen-antibody complex. Multiple statistical methods are applied to control for false discoveries.
Key Methods:
- Student's t-test (paired): Commonly used for comparing uptake at each time point for each peptide. Its limitation is the multiple comparisons problem when applied across hundreds of peptides and time points.
- Analysis of Variance (ANOVA): Used to assess significance across multiple time points and conditions simultaneously.
- Linear Mixed-Effects Models: Account for both fixed effects (e.g., complex condition) and random effects (e.g., biological replicate), effectively modeling variance structure.
- False Discovery Rate (FDR) Control: Methods like the Benjamini-Hochberg procedure are applied to adjust p-values from multiple comparisons, controlling the expected proportion of false positives among significant findings.
Current Consensus: A combination of a significance threshold (e.g., p < 0.01) and a minimum deuteration difference threshold (ΔD ≥ 0.3 Da or 5%) is considered best practice to ensure biological relevance.
Table 1: Impact of Statistical Thresholds on Epitope Mapping Results
| Statistical Threshold Applied | Average Epitope Residues Identified | False Positive Rate (Simulated Data) | Key Reference / Tool |
|---|---|---|---|
| p < 0.05, ΔD ≥ 0.2 Da | ~25-35% of antigen surface | 8-12% | Massign, HDX Workbench |
| p < 0.01, ΔD ≥ 0.3 Da | ~15-25% of antigen surface | 3-5% | (Chalmers et al., Anal Chem, 2022) |
| p < 0.01, ΔD ≥ 0.5 Da | ~8-15% of antigen surface | <2% | (Weis et al., JACS, 2023) |
| p < 0.05 + FDR (q < 0.05) | ~12-20% of antigen surface | ~5% | Deuteros 2.0, MEMHDX |
Table 2: Common Significance Criteria in Recent HDX-MS Epitope Mapping Studies
| Criterion Type | Typical Value | Rationale |
|---|---|---|
| Unadjusted p-value | < 0.01 | Reduces Type I error vs. p < 0.05. |
| Minimum ΔD (Absolute) | 0.3 - 0.5 Da | Exceeds back-exchange noise and instrument error. |
| Minimum ΔD (%) | 5-10% | Useful for comparing peptides of different lengths. |
| Sig. Time Points | ≥ 2 consecutive | Ensures reproducible protection effect, not single-point outlier. |
| FDR (q-value) | < 0.05 - 0.1 | Directly controls false positives in high-throughput analysis. |
Experimental Protocol: Statistical Workflow for HDX-MS Epitope Mapping
Protocol: Data Processing & Statistical Significance Analysis
I. Materials & Software
- HDX-MS raw data files (.raw, .d)
- Protein/peptide identification software (e.g., PLGS, Mascot, PEAKS)
- HDX data processing suite (e.g., HDX Workbench, DynamX, Deuteros)
- Statistical computing environment (e.g., R, Python with Pandas/NumPy/SciPy)
II. Procedure A. Data Reduction and Alignment (Pre-processing):
- Peptide Identification: Search non-deuterated controls against the antigen sequence.
- Deuterium Incorporation Calculation: For each peptide, calculate centroid mass for each time point (e.g., 0.25, 1, 10, 60 min) and replicate (n≥3).
- Data Curation: Remove poorly retained or low-intensity peptides. Align peptide sets between the antigen-alone and antigen-antibody complex experiments.
B. Calculation of Deuterium Uptake Differences:
- For each peptide, at each time point, calculate the average deuterium uptake (Da or %) across replicates for both conditions.
- Compute the difference (ΔD) for each time point: ΔD = D(antigen-alone) - D(complex). A positive ΔD indicates protection (potential epitope).
C. Statistical Testing:
- Per-Peptide/Time Point Test: Perform a paired, two-tailed Student's t-test at each time point for each peptide, comparing replicate uptake values between the two conditions.
- Variance Modeling (Advanced): Implement a linear mixed-effects model in R (
lme4package) or Python (statsmodels), with condition as a fixed effect and peptide/replicate as random effects.
D. Threshold Application & Epitope Assignment:
- Apply primary significance threshold (e.g., p < 0.01).
- Apply minimum ΔD threshold (e.g., ≥ 0.3 Da).
- Require significance at ≥ 2 consecutive time points.
- False Discovery Rate Control: Apply the Benjamini-Hochberg procedure to the list of p-values from all peptide/time point comparisons to calculate q-values. Filter for q < 0.05.
- Map significant peptides fulfilling all criteria onto the antigen structure. A contiguous surface of protection defines the conformational epitope.
III. Validation
- Perform the experiment with a non-binding control antibody. No significant protection should be observed.
- Use a known epitope-antibody pair as a positive control to validate threshold settings.
Visualization of Workflows & Relationships
Diagram Title: HDX-MS Data Analysis Statistical Workflow
Diagram Title: Threshold Selection Trade-offs
The Scientist's Toolkit: Key Reagents & Solutions
Table 3: Essential Research Reagents & Materials for HDX-MS Epitope Mapping
| Item | Function in HDX-MS Epitope Mapping |
|---|---|
| Deuterium Oxide (D₂O), 99.9% | Exchange buffer component; source of deuterons for labeling. |
| Quench Buffer (Low pH, Low T) | Halts HDX (e.g., 0.1% FA, 0°C); critical for reproducible time points. |
| Immobilized Pepsin Column | Provides online, consistent digestion for high sequence coverage. |
| LC-MS Grade Solvents | Essential for reproducible chromatographic separation and low background. |
| Reference (Non-binding) Antibody | Critical negative control for distinguishing specific from non-specific protection. |
| Positive Control Antigen-Ab Pair | Validates the entire experimental and statistical pipeline. |
| Statistical Software Suite (R/Python) | For implementing custom mixed-effects models and FDR correction. |
| HDX Data Processing Software | Dedicated platform for peptide management, uptake calculation, and initial statistics. |
Application Notes: Strategies for Challenging Complexes in HDX-MS Epitope Mapping
In the context of HDX-MS for conformational epitope mapping, low-abundance or challenging protein complexes—such as membrane protein-antigen interactions or complexes with weak binding affinities—pose significant hurdles. Successful analysis requires optimization at every stage to maximize signal-to-noise while preserving the native, often transient, interaction.
Table 1: Key Challenges and Optimization Strategies
| Challenge | Impact on HDX-MS Epitope Mapping | Optimization Strategy | Expected Outcome |
|---|---|---|---|
| Low Abundance | Poor peptide coverage & low signal for complex-specific deuterium uptake differences. | Pre-analytical enrichment (e.g., streptavidin pulldown), nanoUPLC systems, high-sensitivity MS (e.g., Q-TOF, Orbitrap). | ≥ 90% sequence coverage for antigen in complex; reliable ΔD measurement for low-abundant peptides. |
| Weak/Transient Binding (KD > 100 nM) | Complex may dissociate during dilution/quench, obscuring epitope. | On-line rapid mixing HDX, tighter complex stabilization (optimized buffer, crosslinking (XL)), reduced dilution factor. | Detection of localized protection consistent with known epitope for complexes with KD in µM range. |
| Membrane-Associated Complexes | Aggregation, loss during handling, poor digestion. | Use of suitable mimetics (nanodiscs, amphipols), addition of mild non-denaturing detergents (e.g., GDN), optimized digestion enzymes (e.g., pepsin + nepenthesin). | Successful analysis of integral membrane protein antigen with antibody, identifying solvent-protected interfaces. |
| High Heterogeneity | Complex stoichiometry variability leads to averaged, uninterpretable HDX data. | Native size-exclusion chromatography (SEC) or charge detection MS pre-fractionation prior to HDX. | Isolation of a single, homogeneous complex population for HDX analysis. |
Detailed Protocols
Protocol A: On-Line HDX-MS for Weak Affinity Complexes Using Rapid Mixing
Objective: To map the epitope of a monoclonal antibody (mAb) binding to a soluble antigen with a weak binding affinity (KD ~ 1 µM).
Complex Formation & Stabilization:
- Prepare the antigen (50 µL at 10 µM) and mAb (at 15 µM) in PBS, pH 7.4.
- Incubate at 4°C for 1 hour to form the complex. Include an antigen-only control.
- Critical: Pre-chill all HDX components to 0°C.
Deuterium Labeling (On-Line):
- Use an automated HDX platform (e.g., LEAP PAL or HDX-2).
- Program to mix 5 µL of sample (complex or antigen alone) with 45 µL of D2O-based labeling buffer (PBS, pD 7.4) directly in the injection loop.
- Perform labeling for five time points (e.g., 10 s, 1 min, 5 min, 20 min, 2 hours) at 4°C.
- Key: Total system dead time should be < 10 seconds to capture fast-exchanging amides.
Quenching & Digestion:
- Rapidly quench the labeling reaction by mixing with 50 µL of pre-chilled quench buffer (0.1% v/v formic acid, 2M guanidine-HCl, pH 2.5) to achieve final pH ~ 2.5 and 0°C.
- Immediately inject the quenched sample onto an immobilized pepsin column (2.1 mm x 30 mm) held at 0°C.
LC-MS/MS Analysis:
- Trap peptides on a C18 trap column at 0°C.
- Separate using a C18 analytical column with a 7-35% acetonitrile gradient (0.1% formic acid) over 9 minutes.
- Analyze with a high-resolution mass spectrometer (e.g., Thermo Orbitrap Exploris 480) in data-dependent acquisition mode.
Data Processing:
- Process data using specialized software (e.g., HDExaminer, DynamX).
- Identify peptides with a significant reduction in deuterium uptake (ΔD > 0.5 Da at the earliest time point and >5% relative deuterium uptake difference) in the complex versus antigen alone. These clusters define the conformational epitope.
Protocol B: HDX-MS for a Membrane Protein-Antibody Complex in Nanodiscs
Objective: To map the epitope of an antibody binding to a GPCR antigen reconstituted in lipid nanodiscs.
Sample Preparation:
- Incorporate the purified GPCR into MSP1E3D1 nanodiscs with a POPC:POPS lipid mixture using established protocols.
- Form the complex by incubating GPCR-nanodiscs (5 µM) with a 1.2x molar excess of Fab fragment at 4°C for 2 hours. Separate complex from free Fab using SEC (Superdex 200 Increase) in 20 mM HEPES, 150 mM NaCl, pH 7.4.
Off-Line HDX Labeling:
- Dilute the isolated complex (and GPCR-nanodisc control) 1:10 into D2O-based labeling buffer (matching SEC buffer, pD 7.4).
- Label at 20°C for six time points (30 s, 1, 5, 10, 30, 120 min).
Quenching & Digestion:
- Quench by adding pre-chilled quench buffer to a final concentration of 0.8% formic acid and 0.8M guanidine-HCl.
- Digest using a dual protease column (immobilized pepsin and nepenthesin) at 12°C to enhance membrane protein peptide yield.
LC-MS Analysis:
- Use a nanoUPLC system coupled to a timsTOF Pro 2 mass spectrometer for enhanced sensitivity.
- Employ a 8-minute fast gradient to minimize back-exchange.
Data Analysis:
- Focus analysis on peptides from extracellular loops (ECLs) and termini. Significant protection in ECL2/3 upon Fab binding indicates the epitope location.
Visualization
Title: Workflow for Challenging Complex HDX-MS
The Scientist's Toolkit: Research Reagent Solutions
Table 2: Essential Materials for HDX-MS of Challenging Complexes
| Item | Function & Rationale | Example/Supplier |
|---|---|---|
| Automated HDX Platform | Enables precise, low-dead-time (<10s) mixing for kinetic labeling studies of weak complexes, improving reproducibility. | LEAP Technologies PAL HDX, Waters HDX-2. |
| High-Sensitivity Mass Spectrometer | Provides the necessary signal-to-noise for low-abundance peptides from limited sample quantities. | Thermo Orbitrap Exploris 480, Bruker timsTOF Pro 2. |
| Nanodisc Scaffold Protein (MSP) | Creates a soluble, native-like lipid bilayer environment for membrane protein antigens, enabling HDX analysis. | MSP1E3D1 (Cube Biotech). |
| Immobilized Multi-Protease Column | Increases sequence coverage, especially for refractory regions of membrane proteins or dense complexes. | Poroszyme Immobilized Pepsin & Nepenthesin (Thermo). |
| Mild Detergent/Cleavable Surfactant | Solubilizes membrane proteins without denaturation; cleavable forms (e.g., PICUP) prevent MS interference. | Glyco-diosgenin (GDN), PICUP (G-Biosciences). |
| Crosslinkers (Homobifunctional, NHS-ester) | Stabilizes transient complexes prior to HDX dilution/quench steps. Must be used at sub-stoichiometric levels. | BS3 (Thermo), DSS (Creative Molecules). |
| Microfluidic Size-Exclusion Columns | For rapid, online buffer exchange and complex cleanup immediately before HDX labeling, reducing handling artifacts. | Cytiva HiScreen Columns. |
Best Practices for Ensuring Experimental Reproducibility and Robustness
Within the context of Hydrogen-Deuterium Exchange Mass Spectrometry (HDX-MS) for conformational epitope mapping, reproducibility and robustness are paramount. This protocol outlines a standardized workflow to generate reliable data for characterizing antibody-antigen interactions, a critical component in therapeutic drug development.
Key Application Notes & Quantitative Benchmarks
The following table summarizes critical parameters and their optimal ranges established from current literature to ensure reproducible HDX-MS epitope mapping.
Table 1: Critical Parameters for Robust HDX-MS Epitope Mapping
| Parameter | Optimal Range/Rule | Impact on Reproducibility |
|---|---|---|
| Deuterium Buffer pD (pHread + 0.4) | pD 7.0 ± 0.2 | Controls exchange rate; >0.5 unit deviation alters kinetics. |
| Incubation Temperature | 0.0°C ± 0.3°C | Critical for quenching exchange; variance increases back-exchange. |
| Quench pH & Temperature | pH 2.5, 0°C | Irreversibly slows exchange; temperature fluctuation is a major error source. |
| Digestion Time | 3 minutes ± 30 seconds | Incomplete or over-digestion affects peptide coverage and resolution. |
| Back-Exchange Correction | Use >10 fully deuterated peptides | Normalizes data; essential for inter-lab comparison. Minimum 85% deuteration retained. |
| Statistical Significance | ≥99% confidence (p<0.01) with ≥0.5 Da difference | Robust epitope definition; reduces false positives. |
| Biological Replicates | n ≥ 3 independent experiments | Non-negotiable for statistical power in binding studies. |
Detailed Experimental Protocol: HDX-MS for Epitope Mapping
Protocol 1: Labeling & Quench
- Objective: Initiate and precisely control deuterium exchange.
- Reagents: Deuterated Buffer (20 mM phosphate, 150 mM NaCl, pD 7.0), Quench Buffer (0.8 M GuHCl, 0.9% FA, pH 2.5).
- Procedure:
- Pre-cool all buffers and tips on wet ice.
- For labeling, dilute antigen (or antigen-antibody complex) 10-fold into deuterated buffer. Use high-precision pipettes.
- Incubate at 0.0°C for defined time points (e.g., 10s, 1min, 10min, 1hr, 4hr).
- At each time point, aliquot 50 µl and add to 50 µl of pre-chilled Quench Buffer, vortexing immediately. Maintain at 0°C.
Protocol 2: Digestion & LC-MS Analysis
- Objective: Generate peptides and measure deuteration levels.
- Reagents: Immobilized Pepsin column, LC Solvent A (0.1% FA in H₂O), Solvent B (0.1% FA in ACN).
- Procedure:
- Pass quenched sample through immobilized pepsin column (held at 0°C) at 100 µl/min for 3 minutes.
- Collect digest onto a trap column (held at 0°C) for desalting.
- Elute peptides onto a reverse-phase UHPLC column with a 8-40% B gradient over 9 minutes (0.5°C).
- Acquire data using a high-resolution mass spectrometer (e.g., Q-TOF) with electrospray ionization in positive mode.
Protocol 3: Data Processing & Analysis
- Objective: Identify significantly protected peptides.
- Software: Use dedicated HDX-MS software (e.g., HDExaminer, DynamX).
- Procedure:
- Process undeuterated controls to identify peptide set (confidence: PLGS score >7, MS/MS validation).
- Calculate centroid mass for each peptide isotopic envelope at each time point.
- Apply back-exchange correction using theoretical maximum deuteration.
- Compare deuteration levels of antigen alone vs. antigen-antibody complex across all time points.
- Apply statistical tests (e.g., Welch's t-test) on replicates. Map peptides with significant protection (ΔD ≥ 0.5 Da, p ≤ 0.01) onto the antigen structure.
Visualization of Workflows
Title: HDX-MS Conformational Epitope Mapping Workflow
Title: HDX Data Analysis & Significance Pathway
The Scientist's Toolkit: Essential Reagent Solutions
Table 2: Key Research Reagent Solutions for HDX-MS
| Item | Function & Specification | Critical for Robustness |
|---|---|---|
| Deuterium Oxide (D₂O) Buffer | Provides deuterium source for exchange. Must be pH-adjusted (pD) with negligible TCEP for disulfide integrity. | Consistency in ionic strength and pD across experiments is non-negotiable. |
| Quench Buffer | Lowers pH and temperature to dramatically slow exchange (pH 2.5, 0°C). Contains denaturant (GuHCl) to unfold protein for consistent digestion. | Must be pre-chilled and volumes precisely replicated to ensure identical quenching efficiency. |
| Immobilized Pepsin Column | Provides rapid, consistent digestion under quench conditions (low pH, 0°C). | Minimizes autolysis and variability compared to soluble pepsin; requires periodic validation of activity. |
| Liquid Chromatography System | UHPLC with temperature-controlled cabinet or column chiller. | Maintaining 0°C during chromatography is essential to minimize back-exchange post-quench. |
| Internal Standard Peptides | Synthetic, non-deuteratable peptides spiked into post-quench sample. | Monitors and corrects for LC-MS system performance variability between runs. |
| Fully Deuterated Control | Protein denatured and fully deuterated in high [GuHCl] D₂O. | Provides site-specific correction factors for back-exchange, enabling inter-study comparison. |
Beyond HDX-MS: Validating and Integrating Findings with Orthogonal Techniques
Comparing HDX-MS with High-Resolution Structural Methods (Cryo-EM, X-ray)
Within the broader thesis on establishing a robust Hydrogen-Deuterium Exchange Mass Spectrometry (HDX-MS) protocol for conformational epitope mapping, it is essential to compare this technique with high-resolution structural methods, namely Cryo-Electron Microscopy (Cryo-EM) and X-ray Crystallography. While Cryo-EM and X-ray provide atomic or near-atomic resolution static snapshots, HDX-MS offers complementary, dynamic, and solution-phase information on protein dynamics and interactions. This application note delineates their comparative strengths, detailed experimental protocols, and integrated workflows for comprehensive epitope mapping in drug discovery.
Comparative Analysis
Methodological Comparison
Table 1: Core Characteristics of HDX-MS, Cryo-EM, and X-ray Crystallography
| Feature | HDX-MS | X-ray Crystallography | Cryo-EM (Single Particle Analysis) |
|---|---|---|---|
| Typical Resolution | Peptide level (5-20 Å for dynamics) | Atomic (0.8 - 3.0 Å) | Near-atomic to Atomic (1.8 - 3.5 Å+) |
| Sample State | Solution-phase, native conditions | Crystalline solid | Vitrified solution (frozen-hydrated) |
| Sample Consumption | Low (pmol to µg) | High (mg) | Moderate (µg) |
| Throughput | Moderate to High | Low to Moderate | Moderate |
| Key Measurable | Deuterium incorporation (time-resolved) | Electron density map | 2D class averages -> 3D density map |
| Information Gained | Protein dynamics, solvent accessibility, binding interfaces (epitopes) | Static atomic coordinates, precise bonding | Static 3D structure, conformational heterogeneity |
| Size Range | 5 kDa - MDa complexes | Typically < 500 kDa (with exceptions) | 50 kDa - GDa complexes |
| Key Challenge | Back-exchange control, data analysis complexity | Obtaining diffraction-quality crystals | Sample preparation, vitrification, processing |
Quantitative Performance Metrics (Representative Data)
Table 2: Performance Metrics for Epitope Mapping Studies
| Metric | HDX-MS | X-ray Crystallography | Cryo-EM |
|---|---|---|---|
| Typical Timeline (from sample to data) | 1-3 weeks | 3 months - 2+ years | 1 week - 3 months |
| Success Rate (sample to structure/dataset) | High (>70%) | Variable, often low (<30%) | Moderate to High (~50-70%) |
| Detectable Conformational Change | Yes, localized & subtle | Yes, if captured in crystal | Yes, can separate states |
| Labeling/Modification Tolerance | High (flexible) | Low (can hinder crystallization) | Moderate |
| Required Antigen Concentration | 0.1 - 10 µM | 5 - 20 mg/mL | 0.5 - 3 mg/mL |
| Mapping Resolution (epitope) | 5-15 amino acid peptides | Individual residues | ~3-5 Å (side chain density) |
Title: Integrated Epitope Mapping via HDX-MS, X-ray, and Cryo-EM
Experimental Protocols
Detailed HDX-MS Protocol for Conformational Epitope Mapping
Application Note: This protocol is optimized for identifying the interface of an antigen (Ag) with a monoclonal antibody (mAb) in solution.
A. Materials & Reagents (The Scientist's Toolkit)
Table 3: Key Reagent Solutions for HDX-MS Epitope Mapping
| Item | Function & Specification |
|---|---|
| Deuterated Buffer | Provides D₂O for exchange reaction. Typically 10-20 mM phosphate/citrate, 50-150 mM NaCl, pD 7.0 (pHread 6.6). |
| Quench Buffer | Rapidly lowers pH & temperature to minimize back-exchange. Pre-chilled to 0°C: 0.8-1.2 M GuHCl, 0.8-1.2% FA, optional TCEP. |
| Immobilized Pepsin/Protease XIII Column | Online digestion system for reproducible, rapid peptide generation under quench conditions. |
| UPLC System with Peltier Cooling | Maintains sample at 0°C during chromatography to minimize back-exchange. |
| Reverse-Phase UPLC Column | Desalting and peptide separation (e.g., C18, 1.0 mm ID) with a fast, steep organic gradient. |
| High-Resolution Mass Spectrometer | Accurate mass measurement of peptides (TOF, Orbitrap, Q-TOF preferred). |
| Data Processing Software | (e.g., HDExaminer, DynamX, Mass Spec Studio) for deuterium uptake calculation and statistical analysis. |
B. Step-by-Step Protocol
Day 1: Sample Preparation and Labeling
- Prepare Stock Solutions: Dialyze purified Ag and Ag-mAb complex into identical non-deuterated labeling buffer (e.g., PBS, pH 7.4). Determine final concentrations (typical 5 µM).
- Initiate Deuterium Exchange:
- Pipette 18 µL of deuterated buffer into a PCR tube on ice.
- At t=0, add 2 µL of protein sample (Ag alone or complex) to the D₂O buffer, mix rapidly.
- Incubate at 25°C for defined time points (e.g., 10s, 1min, 10min, 1h, 4h).
- Quench Reaction: At each time point, add 30 µL of pre-chilled quench buffer, mix, and immediately place on dry ice/ethanol bath (-80°C). Final pH must be ~2.5.
- Store: Keep quenched samples at -80°C until analysis (preferably within 1-2 weeks).
Day 2: Online Digestion and LC-MS Analysis
- Thaw and Inject: Thaw quenched samples in a 4°C chilled autosampler.
- Online Digestion: Inject sample onto immobilized protease column (held at 10-15°C) at a flow rate of 100 µL/min with 0.1% FA in water.
- Peptide Trapping/Desalting: Digest flows onto a trap column to concentrate peptides.
- Chromatographic Separation: Elute peptides onto analytical C18 column with fast gradient (e.g., 8-40% acetonitrile in 0.1% FA over 7-10 min).
- Mass Spectrometry Analysis: Eluting peptides are analyzed by ESI-MS with high mass accuracy settings. Perform triplicate runs per sample.
Day 3-4: Data Processing and Analysis
- Peptide Identification: Use undeterated control samples with MS/MS to identify peptic peptides covering the Ag sequence.
- Deuterium Uptake Calculation: For each peptide at each time point, calculate centroid mass of isotopic envelope. Subtract centroid mass of undeterated peptide. Apply back-exchange correction if using a standard.
- Differential Analysis: For each peptide, plot deuterium uptake vs. time for Ag alone vs. Ag-mAb complex.
- Epitope Identification: Peptides showing statistically significant (e.g., >0.5 Da difference, p-value <0.01) reduced deuterium uptake in the complex define the antibody epitope (protected from solvent exchange).
Complementary Cryo-EM Sample Preparation Protocol (Single Particle)
Application Note: This protocol yields vitrified grids suitable for high-resolution structure determination of an Ag-mAb complex.
- Grid Preparation: Apply 3-4 µL of purified complex (≥ 0.5 mg/mL, in buffer without cryoprotectants like glycerol) to a glow-discharged holey carbon grid (e.g., Quantifoil R1.2/1.3).
- Blotting: Blot excess liquid with filter paper for 2-5 seconds in a vitrification device (e.g., Vitrobot, chamber at 100% humidity, 4-10°C).
- Plunge-Freezing: Immediately plunge the grid into liquid ethane cooled by liquid nitrogen.
- Storage: Transfer grid under liquid nitrogen to a storage box for later screening/data collection on a 200-300 keV Cryo-EM with a direct electron detector.
Complementary X-ray Crystallography Screening Protocol
Application Note: Initial steps for crystallizing an Ag-mAb Fab-Ag complex.
- Complex Purification: Purify the Ag-Fab complex via size-exclusion chromatography into a low-salt buffer (e.g., 10 mM Tris, 50 mM NaCl, pH 7.5).
- Sparse Matrix Screening: Use a robotic liquid handler to set up 96-well sitting drop vapor diffusion trials. Mix 0.1 µL of complex (10-20 mg/mL) with 0.1 µL of commercial screening solution (e.g., JCSG+, Morpheus).
- Incubation: Incubate plates at constant temperature (e.g., 20°C).
- Imaging: Automatically image drops regularly over 1-4 weeks to identify crystal hits.
Integrated Workflow Diagram
Title: Integrated Epitope Mapping Workflow: HDX-MS and Structural Methods
Cross-Validation Using Mutagenesis and Surface Plasmon Resonance (SPR)
Within the broader thesis investigating the use of Hydrogen-Deuterium Exchange Mass Spectrometry (HDX-MS) for conformational epitope mapping of monoclonal antibodies (mAbs), independent validation of identified epitope regions is critical. HDX-MS can pinpoint areas of a protein antigen that show significant protection from exchange upon mAb binding, suggesting the epitope location. However, this indirect measurement requires cross-validation by orthogonal biophysical methods. This Application Note details the integrated use of site-directed mutagenesis and Surface Plasmon Resonance (SPR) to confirm HDX-MS-derived epitope hypotheses, thereby strengthening the robustness of the epitope mapping conclusion for drug development applications.
Key Concepts and Workflow
The cross-validation strategy follows a logical pathway from HDX-MS hypothesis generation to definitive validation.
Diagram Title: Cross-Validation Workflow from HDX-MS to SPR
Detailed Protocols
Protocol: Generation of Antigen Mutants for Validation
This protocol follows the identification of putative epitope residues from HDX-MS data (e.g., residues showing >95% deuterium protection).
Objective: To create alanine (or other) substitution mutants of the antigen for residues identified by HDX-MS. Materials: See "Scientist's Toolkit" in Section 5.
Procedure:
- Primer Design: For each target residue, design two complementary oligonucleotide primers (25-45 bases) containing the desired mutation (e.g., codon change to GCX for alanine) in the center, flanked by ~15 bases of correct wild-type sequence.
- PCR Mutagenesis: Set up a high-fidelity PCR reaction using the wild-type antigen plasmid as template.
- Reaction Mix (50 µL): 10-50 ng template DNA, 125 ng of each primer, 1x polymerase buffer, 200 µM dNTPs, 2.5 U DNA polymerase.
- Thermocycling: Initial denaturation (95°C, 2 min); 18 cycles of [Denature (95°C, 30 s), Anneal (Tm~5°C, 1 min), Extend (68°C, 1 min/kb plasmid)].
- DpnI Digestion: Add 1 µL of DpnI restriction enzyme (10 U/µL) directly to the PCR product. Incubate at 37°C for 1-2 hours to digest methylated parental DNA template.
- Transformation: Transform 2-5 µL of the DpnI-treated DNA into competent E. coli cells via heat shock or electroporation. Plate on LB-agar with appropriate antibiotic.
- Sequence Verification: Pick colonies, culture, and isolate plasmid DNA. Perform Sanger sequencing across the entire inserted gene to confirm the mutation and absence of secondary mutations.
- Protein Expression & Purification: Express and purify mutant antigens using the same protocol established for the wild-type antigen (e.g., mammalian transient expression, affinity chromatography). Confirm purity and monodispersity via SDS-PAGE and SEC.
Protocol: SPR Analysis of Mutant Binding
Objective: To quantitatively measure the binding affinity (KD) of the mAb for wild-type and mutant antigens.
Materials: Biacore or equivalent SPR instrument, CMS Series S sensor chip, running buffer (e.g., HBS-EP+: 10 mM HEPES, 150 mM NaCl, 3 mM EDTA, 0.05% v/v Surfactant P20, pH 7.4), regeneration solution (e.g., 10 mM Glycine, pH 1.5 or 2.0).
Procedure:
- mAb Immobilization:
- Dilute the mAb to 5-10 µg/mL in 10 mM sodium acetate buffer (pH 4.5-5.5, determined by pre-scouting).
- Activate the sensor chip surface with a 1:1 mixture of 0.4 M EDC and 0.1 M NHS for 7 minutes.
- Inject the diluted mAb over a single flow cell for 5-7 minutes to achieve a target immobilization level of 5-10 kRU (response units).
- Deactivate excess active esters with a 7-minute injection of 1 M ethanolamine-HCl, pH 8.5.
- Use a second flow cell treated with activation/deactivation only as a reference cell.
- Kinetic Binding Analysis:
- Dilute wild-type and mutant antigens in running buffer in a 2- or 3-fold series (e.g., 0.5 nM to 100 nM). Include a zero concentration (buffer) for double referencing.
- Set instrument method: Flow rate: 30 µL/min. Contact time: 180 s. Dissociation time: 600 s.
- Inject antigen concentrations in random order over both the mAb and reference flow cells.
- Regenerate the mAb surface with a 30-60 s pulse of regeneration solution after each cycle.
- Data Processing and Analysis:
- Subtract the reference flow cell sensorgram from the active flow cell sensorgram.
- Further subtract the buffer injection sensorgram (double referencing).
- Fit the processed sensorgrams globally to a 1:1 Langmuir binding model using the instrument's evaluation software to derive the association rate (ka, 1/Ms), dissociation rate (kd, 1/s), and equilibrium dissociation constant (KD = kd/ka, M).
Data Presentation and Interpretation
Table 1: Representative SPR Binding Data for HDX-MS-Derived Mutants
| Antigen Variant | Mutated Residue(s) | ka (1/Ms) x 10^5 | kd (1/s) x 10^-4 | KD (nM) | Fold-Change in KD vs. WT | Interpretation |
|---|---|---|---|---|---|---|
| Wild-Type | None | 5.20 ± 0.30 | 1.05 ± 0.10 | 2.0 ± 0.2 | 1.0 | Reference |
| Mutant A | Arg-54 → Ala | 5.10 ± 0.25 | 1.10 ± 0.09 | 2.2 ± 0.3 | 1.1 | No effect |
| Mutant B | Asp-112 → Ala | 4.95 ± 0.40 | 9.80 ± 0.80 | 19.8 ± 2.5 | 9.9 | Moderate effect |
| Mutant C | Tyr-155 → Ala | 1.05 ± 0.15 | 45.00 ± 5.00 | 428.6 ± 75.0 | 214.3 | Critical residue |
| Mutant D | Glu-201 → Ala | ND* | ND* | NB | >1000 | Essential residue |
ND: Not determinable due to very weak binding. *NB: No detectable binding under assay conditions.
Interpretation Framework:
- KD Fold-Change < 2-3: Residue likely not part of the functional epitope (e.g., Mutant A).
- KD Fold-Change 3-10: Residue contributes to binding energetics; may be at the periphery (e.g., Mutant B).
- KD Fold-Change > 10: Residue is a critical component of the epitope, strongly validating the HDX-MS prediction (e.g., Mutants C & D).
The following diagram illustrates the decision logic for integrating HDX-MS and SPR mutagenesis data.
Diagram Title: Decision Logic for Integrating HDX-MS and SPR Mutagenesis Data
The Scientist's Toolkit
Table 2: Essential Research Reagent Solutions for Mutagenesis & SPR Cross-Validation
| Item | Category | Function & Critical Notes |
|---|---|---|
| High-Fidelity DNA Polymerase | Molecular Biology | Ensures accurate amplification during site-directed mutagenesis PCR to prevent secondary mutations. |
| DpnI Restriction Enzyme | Molecular Biology | Selectively digests the methylated parental DNA template post-PCR, enriching for newly synthesized mutant plasmid. |
| Competent E. coli Cells (High-Efficiency) | Molecular Biology | Essential for transformation success after mutagenesis, especially for large plasmids. |
| HEPES Buffered Saline-EP+ (HBS-EP+) | SPR Consumable | Standard running buffer for SPR; provides stable pH and ionic strength, and minimizes non-specific binding. |
| CMS Series S Sensor Chip | SPR Consumable | Gold-standard carboxymethylated dextran chip for amine-coupling of antibodies or proteins. |
| EDC & NHS Crosslinkers | SPR Chemistry | Activate carboxyl groups on the sensor chip surface for covalent ligand (mAb) immobilization. |
| Ethanolamine-HCl | SPR Chemistry | Blocks remaining activated ester groups after ligand immobilization to deactivate the surface. |
| Glycine-HCl (pH 1.5-2.5) | SPR Chemistry | Efficient regeneration solution for breaking antibody-antigen complexes without damaging the immobilized mAb. |
| Purified Wild-Type Antigen | Protein Sample | Critical standard for SPR. Must be highly pure (>95%) and characterized for accurate reference kinetics. |
Within the broader thesis on Hydrogen-Deuterium Exchange Mass Spectrometry (HDX-MS) for conformational epitope mapping, a critical challenge is translating time-resolved deuterium uptake data into a three-dimensional structural model. Integrative modeling addresses this by combining HDX-MS solvent accessibility and protection data with computational structural biology techniques to visualize epitopes on antigen-antibody complexes.
Core Quantitative Data from HDX-MS Epitope Mapping
Table 1: Key HDX-MS Metrics for Integrative Modeling
| Metric | Description | Typical Value Range | Relevance to 3D Modeling |
|---|---|---|---|
| Deuterium Uptake Difference (ΔD) | Difference in deuterium incorporation between antigen alone and antigen in complex. | -2 to +2 Da per peptide | Primary data input; identifies protected/destabilized regions. |
| Relative Deuterium Uptake (%) | Percent deuteration normalized to maximum possible. | 0-100% per peptide | Normalizes data for comparison across peptides. |
| Protection Factor (PF) | Logarithmic measure of protection from exchange. | PF > 1 indicates protection. | Quantifies binding-induced stabilization for energy constraints. |
| Statistical Significance (p-value) | Confidence in the measured ΔD. | p < 0.01 - 0.05 | Filters reliable data points for modeling. |
| Time Points | HDX labeling durations. | 3s - 24h (e.g., 10s, 1m, 10m, 1h, 4h) | Provides kinetic profile for residue-level modeling. |
Table 2: Integrative Modeling Software & Scoring Functions
| Software/Tool | Primary Use | Input Data | Output |
|---|---|---|---|
| HADDOCK | High-resolution docking | HDX protection data as Ambiguous Interaction Restraints (AIRs) | Docked complex structures |
| Rosetta | Flexible docking & refinement | HDX protection factors as energy constraints | Low-energy ensemble of models |
| ChimeraX | Visualization & analysis | HDX heat maps & PDB structures | 3D visualization of epitope |
| MODELLER | Homology modeling (if needed) | Template structure & HDX-protected sequence | Antigen/Antibody model |
Detailed Protocol: From HDX-MS to 3D Epitope Model
Protocol 1: HDX-MS Data Acquisition for Modeling
Objective: Generate reliable, quantitative deuteration data for the antigen-antibody complex and free antigen. Materials: Purified antigen and antibody, deuterated buffer (PBS in D2O, pD 7.4), quench buffer (low pH, low temperature), liquid chromatography system, high-resolution mass spectrometer. Procedure:
- Labeling: Dilute antigen alone and antigen-antibody complex into D2O buffer at 25°C. Use at least five time points (e.g., 10 sec, 1 min, 10 min, 1 hr, 4 hr).
- Quenching: At each time point, mix 1:1 with quench buffer (final pH 2.5, 0°C) to reduce back-exchange.
- Digestion & Separation: Inject onto immobilized pepsin column at 0°C. Digest peptides are trapped and desalted.
- MS Analysis: Elute peptides onto a reverse-phase UPLC column coupled to a high-resolution MS (e.g., Q-TOF). Use ESI in positive ion mode.
- Data Processing: Use specialized software (e.g., HDExaminer, DynamX) to identify peptides, extract deuterium uptake, and calculate ΔD and significance.
Protocol 2: Data Preparation for Integrative Docking
Objective: Convert HDX-MS ΔD data into spatial restraints.
- Peptide-to-Residue Mapping: Map significantly protected peptides (ΔD < -0.5 Da, p < 0.01) onto the high-resolution X-ray or homology model of the antigen.
- Define Restraint Regions: For each protected peptide, define the involved residues as "active" for docking. Adjacent, unprotected residues are defined as "passive."
- Generate Ambiguous Interaction Restraints (AIRs): For tools like HADDOCK, create AIRs stating that any "active" residue on the antigen must be within 2-5 Å of any residue on the antibody's paratope.
Protocol 3: Integrative Docking with HADDOCK
Objective: Generate a 3D model of the antigen-antibody complex guided by HDX data. Procedure:
- Input Structures: Prepare PDB files for antigen and antibody Fv region. Remove non-essential waters/ligands.
- Define Restraint File: Input the AIRs file generated in Protocol 2.
- Docking Stages in HADDOCK:
- Rigid-body docking: Thousands of complexes are generated, scored based on AIRs satisfaction and interface energy.
- Semi-flexible refinement: Top models undergo simulated annealing with flexible side-chains at the interface.
- Explicit solvent refinement: Final models are refined in a water shell for scoring.
- Cluster Analysis: HADDOCK clusters models based on interface similarity. The cluster with the best HADDOCK score and highest AIRs satisfaction is selected.
Protocol 4: Model Validation and Visualization
Objective: Validate and visualize the final epitope.
- Validation: Overlay the HDX protection data (as a relative uptake difference plot) onto the antigen surface in ChimeraX. Verify spatial congruence.
- Epitope Visualization: In ChimeraX, color the antigen surface by HDX ΔD value (e.g., blue for protected, white for no change, red for destabilized). Display the docked antibody as a ribbon or transparent surface.
Workflow and Relationship Diagrams
Title: HDX-MS Integrative Modeling Workflow
Title: Converting HDX Data to Docking Restraints
The Scientist's Toolkit: Key Research Reagent Solutions
Table 3: Essential Reagents & Materials for HDX-MS Integrative Modeling
| Item | Function & Role in Protocol | Critical Specifications |
|---|---|---|
| Deuterium Oxide (D2O) | Labeling buffer base; source of deuterons for exchange. | 99.9% D atom purity; LC-MS grade. |
| Deuterated Buffer Salts | Maintain physiological pH (pD) and ionic strength during labeling. | PBS or Tris salts, pre-equilibrated in D2O. |
| Quench Buffer | Stops HDX reaction, denatures protein, reduces back-exchange. | Low pH (2.0-2.5), 0-4°C; e.g., 4M Urea/0.1% FA in H2O. |
| Immobilized Pepsin Column | Rapid, reproducible digestion under quench conditions for peptide-level resolution. | High activity at 0°C and pH 2.5. |
| UPLC System with Peltier Cooler | Separates peptides prior to MS; cooling minimizes back-exchange. | Capable of maintaining 0°C for sample tray and chromatography. |
| High-Resolution Mass Spectrometer | Accurately measures mass shifts due to deuterium incorporation. | Mass accuracy < 5 ppm; Q-TOF or Orbitrap preferred. |
| HDExaminer / DynamX Software | Processes raw MS data to calculate deuterium uptake and ΔD. | Automated peptide ID, uptake calculation, and statistical analysis. |
| Molecular Visualization Software (ChimeraX) | Visualizes final 3D epitope model and maps HDX data onto structure. | Supports custom coloring by data attributes (e.g., ΔD). |
| Integrative Docking Platform (HADDOCK) | Performs biomolecular docking using HDX-derived restraints. | Web server or local installation accepting AIRs. |
Within the broader thesis on establishing a robust Hydrogen-Deuterium Exchange Mass Spectrometry (HDX-MS) protocol for conformational epitope mapping, this application note examines published case studies where HDX-MS was pivotal in defining therapeutic antibody binding sites. Precise epitope mapping accelerates drug candidate selection, informs engineering for improved affinity/specificity, and supports intellectual property claims. HDX-MS excels at mapping conformational epitopes without crystallization, providing dynamic insights into binding interfaces.
Case Study 1: Epitope Mapping of a Therapeutic Antibody Targeting IL-23
Program: Risankizumab (Skyrizi), an anti-IL-23p19 monoclonal antibody for plaque psoriasis. Challenge: Differentiate its epitope from other anti-IL-23 antibodies (e.g., guselkumab) to elucidate unique mechanism of action. HDX-MS Application: HDX-MS was performed on IL-23 alone and in complex with risankizumab Fab. Deuterium uptake was monitored over time (10s to 4h) at multiple pH/temperature quench conditions. Key Finding: A significant decrease in deuterium uptake was localized to a discontinuous epitope on the IL-23p19 subunit, centered on a specific loop (Loop 3 of helix D). This epitope was distinct from, though partially overlapping with, the guselkumab epitope, explaining differential binding kinetics and potency. Impact: Data directly supported patent strategy and provided a rational basis for the antibody's high neutralization potency by demonstrating steric blockade of the IL-23/IL-23R interaction interface.
Table 1: HDX-MS Data Summary for IL-23/Antibody Complexes
| Antibody | Target Subunit | Protected Regions (Peptide Segments) | ΔDeuterium Uptake (Max, at 4h) | Epitope Class |
|---|---|---|---|---|
| Risankizumab | IL-23p19 | p19: 102-115, 125-140 | -12.5 Da | Conformational, Discontinuous |
| Guselkumab | IL-23p19 | p19: 117-130, 135-145 | -9.8 Da | Conformational, Discontinuous |
| Control IgG | N/A | No significant protection | < ±1.0 Da | N/A |
Case Study 2: Defining the Epitope of a SARS-CoV-2 Neutralizing Antibody
Program: S309, the parent antibody of sotrovimab (Xevudy), targeting the SARS-CoV-2 spike protein. Challenge: Rapidly characterize the epitope and mechanism of neutralization for a pandemic-response therapeutic. HDX-MS Application: HDX-MS compared deuterium uptake in the SARS-CoV-2 spike receptor-binding domain (RBD) alone versus complexed with S309 Fab. Experiments were conducted under native conditions (pH 7.0, 25°C). Key Finding: Strong protection was observed in the RBD segment spanning residues 359-393, which forms a conserved, glycan-containing epitope outside the ACE2 receptor-binding motif. This explained its ability to neutralize diverse variants and its mechanism via steric hindrance and cross-linking. Impact: HDX-MS data was crucial for understanding broad-spectrum activity, guiding variant resistance assessments, and supporting regulatory filings.
Table 2: HDX-MS Data Summary for SARS-CoV-2 RBD/Antibody Complexes
| Antibody | Target Domain | Key Protected Peptide Sequences | Functional Epitope Residues | Cross-Reactivity |
|---|---|---|---|---|
| S309 (sotrovimab) | Spike RBD | 359-371, 372-385, 386-393 | N370, N343 (glycans), R346, K356 | Broad (SARS-CoV-1, Variants) |
| CB6 (etesevimab) | Spike RBD | 437-456, 470-491 | Y449, F456, L455, R457 | Narrower (WT) |
| REGN10933 (casirivimab) | Spike RBD | 444-461, 493-506 | K417, Y453, F486 | Alpha, Beta |
Detailed HDX-MS Protocol for Conformational Epitope Mapping
Principle: Protein-amidohydrogen exchange rates are slowed (protection) upon antibody binding due to reduced solvent accessibility or stabilized hydrogen bonding.
Protocol Steps:
- Sample Preparation:
- Purify target antigen and antibody Fab fragment to >95% homogeneity.
- Form complex at 2:1 molar excess of antigen to ensure complete binding.
- Buffer exchange into deuterated PBS (pD 7.0) using size-exclusion spin columns.
Deuterium Labeling:
- Initiate exchange by diluting protein/complex 1:10 into D₂O-based labeling buffer.
- Incubate at 4°C (or 25°C) for multiple time points (e.g., 10s, 1min, 10min, 1h, 4h).
- Quench reaction by adding pre-chilled quench buffer (0.1 M Glycine, 4 M GuHCl, pH 2.3) to drop pH to ~2.5 and temperature to 0°C.
Digestion & Liquid Chromatography:
- Inject quenched sample onto an immobilized pepsin column (2°C).
- Digest for ~1 minute. Peptide fragments are trapped on a C8 desalting column.
Mass Spectrometry Analysis:
- Elute peptides onto a reverse-phase C18 column for separation and into a high-resolution mass spectrometer (e.g., Q-TOF, Orbitrap).
- Acquire data in data-independent (MSᴱ) or data-dependent acquisition mode.
Data Processing & Analysis:
- Use specialized software (e.g., HDExaminer, DynamX) to identify peptides, correct for back-exchange, and calculate deuterium uptake for each peptide/time point.
- Calculate differential uptake (ΔD = Dᶜᵒᵐᵖˡᵉˣ - Dᵃᵖᵒˡᵒᵍ) per peptide.
- Map peptides with significant protection (typically ΔD < -0.5 Da, statistically validated) onto the target protein structure.
The Scientist's Toolkit: Research Reagent Solutions
Table 3: Essential Materials for HDX-MS Epitope Mapping
| Item | Function & Importance |
|---|---|
| High-Purity Antigen & Fab | Minimizes spectral complexity; ensures observed protection is due to specific binding. |
| Deuterium Oxide (D₂O, 99.9%) | Source of deuterium for the HDX reaction; purity is critical for low background. |
| Immobilized Pepsin Column | Enables rapid, reproducible, and cold digestion to minimize back-exchange. |
| UPLC System with Peltier Chambers | Maintains low temperature (0°C) during LC to minimize back-exchange post-quench. |
| High-Resolution Mass Spectrometer | Provides the mass accuracy and resolution needed to resolve small deuterium mass shifts. |
| HDX-MS Analysis Software (e.g., HDExaminer) | Automates peptide identification, deuterium uptake calculation, and statistical analysis. |
| Quench Buffer (Low pH, Denaturing) | Stops HDX by protonating amides and unfolds protein for consistent digestion. |
Diagrams
HDX-MS Epitope Mapping Workflow
IL-23 Pathway & Antibody Blockade Mechanism
Within the broader thesis on establishing a robust Hydrogen-Deuterium Exchange Mass Spectrometry (HDX-MS) protocol for conformational epitope mapping, selecting the appropriate analytical platform is paramount. This application note assesses the complementary techniques used in structural biology for epitope mapping, providing a framework for when HDX-MS is the optimal choice.
Comparative Platform Analysis
The selection of an epitope mapping platform depends on the research question, sample requirements, and desired resolution. The quantitative data below compares key methodologies.
Table 1: Comparative Analysis of Epitope Mapping Platforms
| Platform | Typical Resolution | Sample Consumption (per analysis) | Throughput (Sample to Data) | Key Strength | Primary Limitation |
|---|---|---|---|---|---|
| HDX-MS | Peptide level (5-20 aa) | 1-10 pmol | Medium (Days) | Sensitive to dynamics; Solution-state; Low protein requirement | No atomic detail; Data analysis complexity |
| X-ray Crystallography | Atomic (<2 Å) | >1 nmol | Very Slow (Weeks-Months) | Atomic resolution; Detailed interaction network | Requires crystallization; Static picture |
| Cryo-Electron Microscopy (cryo-EM) | Near-atomic to Atomic (2-3 Å) | ~0.1 nmol | Slow (Weeks) | Handles large complexes; No crystallization | Expensive equipment; Complex sample prep |
| Surface Plasmon Resonance (SPR) | N/A (Binds/No Bind) | ~10-100 pmol | Fast (Hours) | Direct kinetic data (KD, kon, koff) | No structural information |
| Alanine Scanning Mutagenesis | Single residue | Variable | Medium (Days-Weeks) | Functional impact of specific residues | Indirect; Time-consuming; May affect folding |
Detailed HDX-MS Protocol for Conformational Epitope Mapping
This protocol is optimized for identifying regions of a protein antigen that show decreased deuterium uptake upon binding to a monoclonal antibody (mAb), indicating the epitope.
Protocol 1: HDX-MS Epitope Mapping Experiment
I. Materials & Reagent Preparation
- Deuterated Buffer: 10 mM PBS, pD 7.4 (pHread 7.0), 99.9% D₂O.
- Quench Buffer: 0.1 M NaH₂PO₄/H₃PO₄, 2 M GuHCl, 0.5 M TCEP, pH 2.2, 0°C.
- Digestion & Desalting Column: Immobilized pepsin protease column (e.g., Poroszyme) followed by a C8 or C18 trap column, held at 10-15°C in a temperature-controlled chamber.
- LC-MS System: UHPLC coupled to high-resolution mass spectrometer (e.g., Q-TOF, Orbitrap).
- Analytical Column: C18 reversed-phase column (1.0 x 50 mm, 1.7-1.9 μm particles).
- LC Solvents: Solvent A: 0.1% Formic Acid in H₂O; Solvent B: 0.1% Formic Acid in Acetonitrile.
II. Experimental Procedure
- Sample Preparation: Complex 5 μM antigen with 5.5 μM mAb (slight mAb excess) in non-deuterated PBS, pH 7.4. Incubate 1 hour at 25°C. Prepare antigen-only control identically.
- Deuterium Labeling: Dilute complex and control samples 10-fold into deuterated buffer. Incubate at 25°C for multiple time points (e.g., 10 s, 1 min, 10 min, 1 h, 4 h).
- Quenching & Digestion: At each time point, mix 50 μL of labeling reaction with 50 μL of ice-cold quench buffer. Immediately inject onto the immobilized pepsin column (0.1°C) for online digestion (2 min).
- Trapping & Separation: Peptides are trapped on the C18 trap, desalted, and eluted onto the analytical C18 column. Perform a 8-minute gradient from 5% to 35% Solvent B.
- Mass Spectrometry Analysis: Acquire data in positive ion mode with high resolution (>20,000). Use data-dependent or targeted MS/MS for peptide identification in separate, non-deuterated runs.
III. Data Processing
- Process data using dedicated HDX-MS software (e.g., HDExaminer, DynamX, HDX Workbench).
- Identify peptides from the non-deuterated runs using a database search.
- Calculate deuterium uptake for each peptide at each time point by measuring the centroid mass shift.
- Calculate the difference in deuterium uptake (ΔDa) between antigen-only and antigen-mAb complex for all peptides. Peptides showing significant protection (negative ΔDa) constitute the putative epitope.
Visualization of Method Selection Logic & HDX-MS Workflow
Figure 1: Decision tree for selecting an epitope mapping platform.
Figure 2: HDX-MS workflow for conformational epitope mapping.
The Scientist's Toolkit: Essential HDX-MS Reagents & Materials
Table 2: Key Research Reagent Solutions for HDX-MS Epitope Mapping
| Item | Function | Critical Specification/Note |
|---|---|---|
| D₂O-based Labeling Buffer | Provides deuterium source for exchange with protein backbone amide hydrogens. | pD must be carefully adjusted (pD = pHread + 0.4). Use high purity (≥99.9%). |
| Low pH Quench Buffer | Rapidly drops pH and temperature to stop exchange (kex ~ 0 at pH 2.5, 0°C). | Contains chaotrope (e.g., GuHCl) and reducing agent (e.g., TCEP) to denature and unfold protein for digestion. |
| Immobilized Pepsin Column | Provides rapid, consistent, and online proteolytic digestion under quench conditions. | Superior to in-solution digestion for reproducibility and minimizing back-exchange. |
| C8/C18 Trap Column | Desalts and concentrates peptides prior to analytical separation, removing deuterium in solution. | Must be kept cold (0.1°C) to minimize back-exchange during trapping. |
| UHPLC System | Provides fast, reproducible peptide separation to minimize back-exchange during chromatography. | Requires temperature control (0.1°C) for the entire fluid path post-quench. |
| High-Resolution Mass Spectrometer | Accurately measures the small mass shifts (ΔDa) from deuterium incorporation. | Resolution >20,000 FWHM and high mass accuracy are essential for analyzing complex peptide mixtures. |
| HDX-MS Data Processing Software | Identifies peptides, calculates deuterium uptake, and compares conditions. | Required for handling large datasets and statistical validation of differences (e.g., significance threshold of ΔDa > 0.3 Da and p-value < 0.01). |
Conclusion
HDX-MS has emerged as a powerful, accessible, and information-rich tool for conformational epitope mapping, filling a critical niche between high-resolution structural biology and functional assays. This guide underscores that successful implementation relies on a solid understanding of foundational biophysics, a meticulous and optimized experimental protocol, proactive troubleshooting to ensure data quality, and strategic validation with complementary techniques. The future of HDX-MS in biomedical research is promising, with advances in automation, data analysis software, and integration with AI-driven modeling set to increase throughput and accuracy. As the demand for precise molecular characterization of biologics grows, HDX-MS will continue to be an indispensable asset for driving the rational design of next-generation therapeutics, vaccines, and diagnostics, ultimately accelerating the path from discovery to clinical impact.