IHC in Cancer Research: A Comprehensive Guide to Biomarker Detection for Precision Oncology
Immunohistochemistry (IHC) remains a cornerstone technology for cancer biomarker detection, providing critical spatial and protein-level information for research, drug development, and diagnostic applications.
IHC in Cancer Research: A Comprehensive Guide to Biomarker Detection for Precision Oncology
Abstract
Immunohistochemistry (IHC) remains a cornerstone technology for cancer biomarker detection, providing critical spatial and protein-level information for research, drug development, and diagnostic applications. This article offers a detailed, four-part guide for researchers and drug development professionals. It begins by exploring the foundational principles and major biomarker classes in oncology. Next, it delves into advanced methodological protocols and specific applications in drug target validation and patient stratification. The guide then addresses common troubleshooting and optimization strategies for assay reliability. Finally, it examines validation frameworks and comparative analyses with next-generation techniques. This comprehensive resource synthesizes current best practices to empower robust, reproducible biomarker data generation in the era of precision medicine.
Decoding the Tumor Microscope: Core Principles and Key Biomarkers in IHC
The Essential Role of IHC in Modern Cancer Biomarker Discovery
Application Notes
Immunohistochemistry (IHC) remains the cornerstone technique for validating and contextualizing cancer biomarkers within the complex tumor microenvironment. Its ability to visualize protein expression, localization, and cellular origin in the morphological context of formalin-fixed paraffin-embedded (FFPE) tissue is unparalleled. The integration of IHC with digital pathology and quantitative image analysis has transformed it from a qualitative tool into a robust, quantitative platform essential for biomarker discovery, companion diagnostic development, and patient stratification.
A critical application is the multiplexed detection of co-expressed biomarkers, such as immune checkpoint proteins, which inform immunotherapy decisions. Current research emphasizes the quantification of biomarker expression within specific cellular compartments (e.g., membranous, cytoplasmic, nuclear) and its spatial relationship to immune cell infiltrates. The table below summarizes key quantitative findings from recent biomarker studies utilizing advanced IHC.
Table 1: Quantitative IHC Biomarker Data in Selected Cancers
| Cancer Type | Biomarker(s) | IHC Scoring Method | Key Finding (% or Density) | Clinical Correlation |
|---|---|---|---|---|
| Non-Small Cell Lung Cancer | PD-L1 (SP263) | Tumor Proportion Score (TPS) | TPS ≥50% in ~30% of cases | Predicts response to anti-PD-1/PD-L1 therapies |
| Triple-Negative Breast Cancer | PD-L1 (SP142) | Combined Positive Score (CPS) | CPS ≥10 in ~40% of cases | Eligibility for pembrolizumab combo therapy |
| Colorectal Cancer | HER2 | HER2 IHC Scoring (0 to 3+) | 3+ overexpression in ~5% of cases | Identifies candidates for HER2-targeted therapies |
| Melanoma | CD8+, PD-1+ | Digital Image Analysis (Cells/mm²) | High CD8+ density (>500 cells/mm²) with PD-1+ co-expression | Associated with improved immunotherapy survival |
Protocols
Protocol 1: Standard IHC for FFPE Tissue Using Polymer-Based Detection
Purpose: To detect and localize a protein biomarker of interest in FFPE tissue sections. Key Reagent Solutions:
- Primary Antibody: Validated for IHC on FFPE tissue (e.g., anti-PD-L1, clone 22C3).
- Epitope Retrieval Buffer: Tris-EDTA (pH 9.0) or Citrate (pH 6.0).
- Blocking Solution: 2.5-5% Normal Serum or Protein Block.
- Polymer Detection System: HRP-labeled polymer conjugated with secondary antibody.
- Chromogen: 3,3'-Diaminobenzidine (DAB).
- Counterstain: Hematoxylin.
Methodology:
- Sectioning & Baking: Cut 4-5 µm FFPE sections onto charged slides. Bake at 60°C for 1 hour.
- Deparaffinization & Rehydration: Immerse slides in xylene (3 changes, 5 min each), followed by graded ethanol (100%, 95%, 70%) and finally distilled water.
- Antigen Retrieval: Place slides in pre-heated epitope retrieval buffer in a decloaking chamber or water bath (95-100°C) for 20 minutes. Cool at room temperature for 30 minutes.
- Peroxidase Blocking: Incubate with 3% hydrogen peroxide for 10 minutes to quench endogenous peroxidase activity. Rinse with wash buffer (TBS-T or PBS).
- Protein Blocking: Apply blocking solution for 10-20 minutes at room temperature. Do not rinse; tap off excess.
- Primary Antibody Incubation: Apply optimized dilution of primary antibody. Incubate at 4°C overnight or at room temperature for 1 hour in a humidified chamber.
- Polymer Detection: Rinse slides. Apply polymer-HRP conjugate for 30 minutes at room temperature.
- Chromogen Development: Apply DAB substrate for 3-10 minutes, monitoring under a microscope. Stop reaction by immersing in distilled water.
- Counterstaining & Mounting: Counterstain with hematoxylin for 30-60 seconds. Dehydrate through graded alcohols and xylene. Mount with permanent mounting medium.
Protocol 2: Multiplex IHC (mIHC) Using Sequential Staining
Purpose: To detect two or more biomarkers on a single tissue section to assess co-expression and spatial relationships. Key Reagent Solutions:
- Primary Antibodies: Raised in different host species (e.g., mouse, rabbit, goat).
- Tyramide Signal Amplification (TSA) Reagents: Fluorophore-conjugated tyramides (e.g., Opal dyes).
- Microwave Stripping Buffer: pH 6.0 or pH 9.0 buffer for antibody stripping between rounds.
- Automated Staining System: Recommended for reproducibility (e.g., Ventana, Leica, or Akoya platforms).
Methodology:
- Perform steps 1-4 from Protocol 1.
- First Cycle: Apply first primary antibody (e.g., anti-CD8, rabbit). Detect using an HRP-polymer system. Amplify signal with a fluorophore-conjugated tyramide (e.g., Opal 520).
- Antibody Stripping: Place slides in pre-heated retrieval buffer and microwave at high power for 10-15 minutes to strip antibodies while leaving fluorophore intact.
- Subsequent Cycles: Repeat the staining cycle (primary antibody -> HRP polymer -> tyramide) with a different fluorophore (e.g., Opal 570 for PD-1, Opal 690 for cytokeratin) for each new biomarker. A final DAPI stain is applied for nuclei.
- Image Acquisition & Analysis: Slides are imaged using a multispectral microscope. Spectral unmixing software is used to separate the signals, and quantitative analysis is performed for cell phenotyping and spatial analysis.
Visualizations
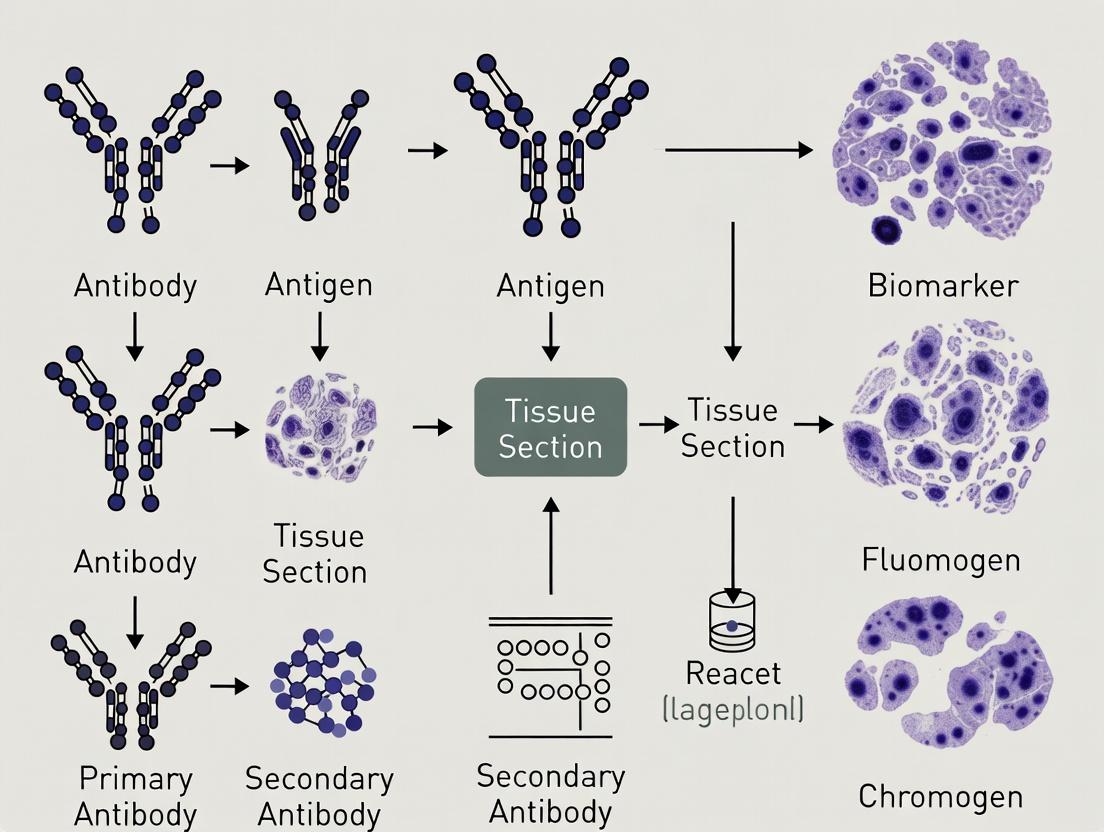
Standard IHC Workflow
PD-1/PD-L1 Immune Checkpoint Pathway
Sequential mIHC Staining Workflow
The Scientist's Toolkit: Key Research Reagent Solutions
Table 2: Essential Materials for Advanced IHC Biomarker Research
| Item | Function & Importance |
|---|---|
| Validated Primary Antibodies | Clone- and platform-specific antibodies are critical for reproducibility, especially for predictive biomarkers like PD-L1 (e.g., clones 22C3, SP142, SP263). |
| Controlled-Format Detection Systems | Pre-diluted, ready-to-use polymer detection systems on automated stainers ensure standardized results across labs and studies. |
| Tyramide Signal Amplification (TSA) Kits | Enable highly sensitive multiplex IHC by allowing sequential staining with different fluorophores on a single slide. |
| Automated IHC/ISH Staining Platform | Instruments (e.g., Ventana BenchMark, Leica BOND) provide precise control over staining conditions, essential for clinical-grade assay development. |
| Multispectral Imaging System | Microscope systems capable of capturing and unmixing the full emission spectrum allow precise quantification of multiple biomarkers in multiplex IHC. |
| Quantitative Digital Pathology Software | AI/ML-powered software tools for whole-slide image analysis enable objective scoring of biomarker expression, density, and spatial relationships. |
| Multiplex Fluorescent IHC Validated Panels | Pre-optimized antibody panels for simultaneous detection of immune cell phenotypes (e.g., T-cells, macrophages) and checkpoint markers. |
| Tissue Microarrays (TMAs) | Contain multiple patient samples on one slide, enabling high-throughput screening and validation of biomarker candidates across cohorts. |
In immunohistochemistry (IHC), the exquisite specificity of the antigen-antibody interaction forms the cornerstone for visualizing the spatial distribution of biomarkers within tumor tissues. This specificity, governed by the precise three-dimensional complementarity between an antibody's paratope and its target antigen's epitope, allows researchers to distinguish malignant from benign tissue, identify tumor subtypes, and detect therapeutic targets like HER2, PD-L1, and hormone receptors. Within cancer biomarker research, the reliability of IHC data directly impacts diagnostic accuracy, patient stratification for targeted therapies, and drug development efficacy. This application note details the principles, protocols, and critical controls that underpin robust, specific IHC for translational research.
Core Principles & Quantitative Metrics of Antibody Specificity
The strength and specificity of antigen-antibody binding are quantified by key parameters, which are critical for antibody validation in biomarker studies.
Table 1: Key Quantitative Parameters Defining Antibody Binding Characteristics
| Parameter | Definition | Typical Target Range for IHC | Impact on IHC Performance |
|---|---|---|---|
| Affinity (KD) | Equilibrium dissociation constant. Lower KD indicates higher affinity. | ≤ 10 nM (High-affinity antibodies preferred) | Determines the antibody dilution (titer) and influences signal intensity and signal-to-noise ratio. |
| Cross-Reactivity | Binding to non-target antigens with similar epitopes. | < 5% (Must be empirically validated) | Primary source of non-specific staining and false-positive results. Validated via knockout/knockdown models. |
| Signal-to-Noise Ratio (S/N) | Ratio of specific staining intensity to background. | > 3:1 (Subjectively, high specific vs. low background) | Direct measure of assay specificity and clarity. Optimized via blocking and detection system. |
| Titer | Optimal dilution of the primary antibody that yields maximum specific signal with minimal background. | Determined via checkerboard titration (e.g., 1:50 to 1:2000) | Central to protocol optimization; reduces cost and non-specific binding. |
Detailed Protocol: Standard IHC for FFPE Tissue Using HRP-DAB Detection
This protocol is fundamental for detecting cancer biomarkers in formalin-fixed, paraffin-embedded (FFPE) tissue sections.
A. Reagents & Materials
- Tissue Sections: 4-5 µm FFPE sections on charged slides.
- Antibodies: Validated primary antibody against target biomarker (e.g., anti-PD-L1, clone 22C3); HRP-conjugated secondary antibody.
- Detection System: HRP-based polymer detection kit (e.g., EnVision).
- Antigen Retrieval Buffer: Tris-EDTA (pH 9.0) or Citrate (pH 6.0).
- Blocking Solution: Protein block (serum or BSA-based).
- Chromogen: 3,3'-Diaminobenzidine (DAB).
- Counterstain: Hematoxylin.
- Mounting Medium: Aqueous or resinous.
B. Procedure
- Deparaffinization & Rehydration:
- Bake slides at 60°C for 20 min.
- Immerse in xylene (or substitute) 3 x 5 min.
- Rehydrate through graded ethanol (100%, 100%, 95%, 70%) for 2 min each.
- Rinse in distilled water (dH₂O).
Antigen Retrieval (Heat-Induced Epitope Retrieval - HIER):
- Place slides in pre-heated antigen retrieval buffer in a decloaking chamber or pressure cooker.
- Heat at 95-100°C for 20 min (varies by antibody).
- Cool to room temperature (30 min).
- Rinse in dH₂O, then place in wash buffer (TBS-Tween or PBS).
Endogenous Peroxidase Blocking:
- Incubate slides with 3% H₂O₂ in methanol for 10 min at RT.
- Rinse thoroughly with wash buffer.
Protein Blocking:
- Apply 100-200 µL of protein block for 30 min at RT to reduce non-specific binding.
Primary Antibody Incubation (The Specificity Step):
- Tap off blocking solution.
- Apply optimized dilution of primary antibody in diluent.
- Incubate in a humidified chamber at 4°C overnight OR at RT for 1 hour.
- Rinse with wash buffer 3 x 5 min.
Polymer-HRP Secondary Antibody Incubation:
- Apply polymer-HRP conjugate (per manufacturer's instructions).
- Incubate for 30 min at RT.
- Rinse with wash buffer 3 x 5 min.
Chromogen Development & Counterstaining:
- Prepare DAB substrate solution. Apply to tissue and monitor development under a microscope (typically 30 sec to 5 min).
- Immerse in dH₂O to stop reaction.
- Counterstain with hematoxylin for 30-60 sec.
- "Blue" in tap water (or Scott's solution) for 1 min.
Dehydration, Clearing, & Mounting:
- Dehydrate through graded ethanol (70%, 95%, 100%, 100%) for 1 min each.
- Clear in xylene (or substitute) 2 x 3 min.
- Mount with permanent mounting medium and coverslip.
The Scientist's Toolkit: Essential Research Reagent Solutions
Table 2: Key Reagents for Validating Antigen-Antibody Specificity in IHC
| Reagent / Solution | Primary Function in IHC | Role in Ensuring Specificity |
|---|---|---|
| Validated Primary Antibodies (e.g., CDX2, MSH6) | Binds specifically to the target biomarker epitope. | Monoclonal antibodies offer high specificity; validation via genetic (KO), microscopic (knockdown), or biological (cell line) controls is essential. |
| Isotype Control Antibody | A non-targeting antibody of the same IgG class/subclass as the primary. | Serves as a negative control to distinguish specific binding from non-specific Fc receptor or charge-mediated binding. |
| Phospho-Specific Antibody Diluent | Specialized buffer for labile epitopes (e.g., phospho-proteins). | Stabilizes the target epitope-antibody complex, preventing dissociation and loss of signal specificity. |
| Polymer-HRP Detection System | Amplifies the primary antibody signal. | High sensitivity and low background compared to traditional avidin-biotin systems, reducing non-specific staining. |
| Antigen Retrieval Buffer (pH 6.0 & 9.0) | Reverses formaldehyde-induced cross-links to expose epitopes. | Critical for restoring the native conformation of the epitope, ensuring antibody binding specificity is maintained. |
| Recombinant Protein/Peptide (for absorption control) | The exact antigen used for antibody generation. | Used in antibody pre-absorption: blocking of staining confirms specificity, while persistence indicates cross-reactivity. |
Critical Validation & Controls Workflow
Specificity validation is a multi-step process required for credible biomarker data.
Title: IHC Antibody Specificity Validation Decision Tree
Multiplex IHC: Leveraging Specificity for Complex Biomarker Analysis
Advanced multiplex IHC (mIHC) relies on orthogonal detection systems (e.g., tyramide signal amplification with fluorophores) to label multiple primary antibodies from the same host species simultaneously. The workflow hinges on sequential rounds of staining, each requiring stringent antibody stripping or inactivation to prevent cross-talk, while preserving the specificity of each antigen-antibody interaction.
Title: Sequential Workflow for Multiplex IHC (2-Plex)
This application note, framed within a broader thesis on immunohistochemistry (IHC) applications in cancer biomarker detection research, details the major classes of biomarkers identified via IHC. The transition from purely prognostic markers, which inform likely disease course, to predictive markers, which forecast response to specific therapies, represents a cornerstone of precision oncology. IHC remains a critical, accessible platform for detecting protein-based biomarkers in formalin-fixed, paraffin-embedded (FFPE) tissue specimens, guiding clinical decision-making and drug development.
Major Biomarker Classes: Definitions and Clinical Implications
| Biomarker Class | Definition | Primary Clinical Utility | Key Example(s) | Detection by IHC |
|---|---|---|---|---|
| Prognostic | Provides information on the natural history of the disease (e.g., aggressiveness, recurrence risk) independent of therapy. | Patient stratification for adjuvant therapy; informs intensity of monitoring. | Ki-67 (proliferation), p53 (mutant pattern), Mitotic Index. | Standardized scoring (e.g., Ki-67 percentage). |
| Predictive | Indicates the likelihood of response to a specific therapeutic agent. | Guides targeted therapy selection; excludes patients from ineffective treatments. | HER2 (breast/gastric cancer), PD-L1 (immune checkpoint inhibitors), ALK (lung cancer). | Binary or composite scoring (e.g., HER2 0-3+). |
| Prognostic & Predictive | Biomarkers that inform both disease outcome and response to a specific treatment. | Comprehensive clinical management. | Estrogen Receptor (ER) in breast cancer. | Semi-quantitative scoring (e.g., Allred score). |
| Pharmacodynamic | Demonstrates that a drug has hit its intended target and modulated its activity. | Used in early-phase trials to confirm mechanism of action and guide dosing. | pS6, cleaved Caspase-3, γH2AX. | Quantification of staining intensity/area. |
| Diagnostic | Aids in classifying and identifying the histologic origin or subtype of a tumor. | Critical for accurate diagnosis and initial treatment planning. | Cytokeratins (carcinoma), S100 (melanoma, schwannoma), TTF-1 (lung adenocarcinoma). | Pattern-based interpretation. |
Detailed Experimental Protocols
Protocol 1: Standard IHC for Predictive Biomarker (HER2) Assessment in Breast Carcinoma
This protocol aligns with the ASCAP/CAP guidelines and is essential for trastuzumab eligibility.
1. Specimen Preparation:
- Use 4-5 µm thick sections from FFPE tissue blocks mounted on charged slides.
- Dry slides at 60°C for 20-60 minutes.
2. Deparaffinization and Rehydration:
- Xylene: 3 changes, 5 minutes each.
- 100% Ethanol: 2 changes, 3 minutes each.
- 95% Ethanol: 2 changes, 3 minutes each.
- Rinse in running distilled water.
3. Antigen Retrieval:
- Use a pressure cooker or decloaking chamber with citrate-based buffer (pH 6.0) or EDTA-based buffer (pH 8.0).
- Heat to 121°C for 3 minutes, then cool to ~90°C before removing.
- Cool slides at room temperature for 30 minutes in buffer.
- Rinse in distilled water, then place in wash buffer (Tris-buffered saline with Tween, TBST).
4. Peroxidase Blocking:
- Incubate with 3% hydrogen peroxide solution for 10 minutes at room temperature.
- Rinse with wash buffer.
5. Protein Block (Optional):
- Apply normal serum or protein block from the detection kit for 10 minutes to reduce nonspecific binding.
6. Primary Antibody Incubation:
- Apply anti-HER2/neu rabbit monoclonal antibody (clone 4B5 or equivalent).
- Dilute per manufacturer's recommendation in antibody diluent.
- Incubate for 30-60 minutes at room temperature or overnight at 4°C.
- Rinse thoroughly with wash buffer (3 x 2 minutes).
7. Detection:
- Apply labeled polymer-horseradish peroxidase (HRP) secondary antibody (e.g., from EnVision+ or Ultravision systems) for 30 minutes at room temperature.
- Rinse thoroughly with wash buffer (3 x 2 minutes).
8. Visualization:
- Apply chromogen substrate (e.g., 3,3'-Diaminobenzidine, DAB) for 5-10 minutes, monitoring development under a microscope.
- Rinse in distilled water to stop reaction.
9. Counterstaining and Mounting:
- Counterstain with hematoxylin for 30-60 seconds.
- Rinse in tap water, differentiate in ammonia water (if needed), and blue in running tap water.
- Dehydrate through graded alcohols (95%, 100%) and xylene.
- Mount with permanent mounting medium.
10. Scoring and Interpretation:
- Score per CAP guidelines: 0 (no staining), 1+ (faint/barely perceptible membrane staining), 2+ (weak to moderate complete membrane staining), 3+ (strong complete membrane staining).
- 0 and 1+ are negative; 2+ is equivocal (requires reflex in situ hybridization testing); 3+ is positive.
Protocol 2: Multiplex IHC (mIHC) for Tumor Microenvironment Analysis
This protocol enables simultaneous detection of multiple biomarkers (e.g., CD8, PD-1, PD-L1, cytokeratin) on a single slide to assess immune context.
1. Sequential IHC Staining and Stripping (Opal Method):
- Perform standard IHC Protocol (Steps 1-8) for the first target (e.g., CD8) using a primary antibody and HRP polymer.
- Instead of DAB, apply Opal fluorophore-conjugated tyramide signal amplification (TSA) reagent for 10 minutes.
- Rinse with TBST.
- Perform antigen retrieval again (Step 3) to strip the primary-secondary antibody complex while leaving the fluorophore covalently deposited.
- Cool and rinse.
2. Iterative Staining:
- Repeat the primary antibody incubation (Step 6), detection, and fluorophore application for the second target (e.g., PD-L1) using a spectrally distinct Opal fluorophore.
- Repeat the stripping and staining cycle for up to 6-7 markers.
3. Counterstaining and Imaging:
- After the final cycle, apply spectral DAPI for nuclear counterstaining.
- Mount with anti-fade mounting medium.
- Image slides using a multispectral imaging system (e.g., Vectra, PhenoImager).
- Use spectral unmixing software to separate the signals from each fluorophore.
4. Quantitative Digital Analysis:
- Utilize image analysis software (e.g., HALO, QuPath) to segment tissue into compartments (tumor, stroma, immune cells).
- Quantify cell densities, co-expression patterns, and spatial relationships (e.g., distance of CD8+ cells to PD-L1+ cells).
Visualizations
Diagram 1: IHC Workflow for Predictive Biomarker Testing
Diagram 2: Key Signaling Pathways Involving Predictive IHC Biomarkers
The Scientist's Toolkit: Essential Research Reagents & Materials
| Item | Function/Benefit in IHC Biomarker Research |
|---|---|
| FFPE Tissue Microarrays (TMAs) | Contain multiple patient samples on one slide, enabling high-throughput, standardized staining and comparison of biomarker expression across cohorts. |
| Validated Primary Antibodies (CLIA/CAP) | Antibodies with demonstrated sensitivity and specificity for the target antigen in IHC applications, crucial for reproducible and clinically actionable results. |
| Polymer-based Detection Systems | Provide high sensitivity and low background by linking multiple enzyme molecules to a secondary antibody backbone, amplifying the signal. |
| Automated IHC Stainers | Ensure standardization, reproducibility, and high-throughput processing of slides with precise timing and reagent application. |
| Chromogens (DAB, AEC) | Enzyme substrates that produce a visible, insoluble precipitate at the antigen site (DAB: brown, permanent; AEC: red, alcohol-soluble). |
| Tyramide Signal Amplification (TSA) Kits | Enable highly sensitive multiplex IHC by using horseradish peroxidase to deposit numerous labeled tyramide molecules near the antigen. |
| Multispectral Imaging Systems | Capture the entire emission spectrum at each pixel, allowing for the separation and quantification of multiple overlapping fluorophores in multiplex IHC. |
| Digital Image Analysis Software | Enables quantitative, objective scoring of biomarker expression (H-score, percentage positivity, cell counting) and spatial analysis. |
| Control Cell Lines/Tissues | Slides containing cells/tissues with known expression levels (positive, negative, variable) of the target, run in parallel to validate each assay. |
Within the broader thesis on immunohistochemistry (IHC) applications in cancer biomarker detection research, the accurate assessment of key predictive and prognostic biomarkers is paramount. This article provides detailed application notes and protocols for four critical biomarkers: PD-L1 (immune checkpoint), HER2 (receptor tyrosine kinase), ER/PR (hormone receptors), and Ki-67 (proliferation index). Their standardized detection is essential for guiding targeted therapies, immunotherapy, and prognostic stratification in oncology research and drug development.
Table 1: Key Biomarkers in Cancer Diagnostics and Therapeutics
| Biomarker | Full Name | Primary Cancer Context | Predictive Role | Prognostic Role | Common IHC Scoring Systems |
|---|---|---|---|---|---|
| PD-L1 | Programmed Death-Ligand 1 | NSCLC, Melanoma, UC | Response to immune checkpoint inhibitors (anti-PD-1/PD-L1) | High expression may correlate with worse prognosis in some cancers | Tumor Proportion Score (TPS), Combined Positive Score (CPS) |
| HER2 | Human Epidermal Growth Factor Receptor 2 | Breast, Gastric, GEJ | Response to HER2-targeted therapies (e.g., Trastuzumab) | Overexpression associated with aggressive disease | ASCO/CAP Guidelines (0, 1+, 2+, 3+) |
| ER/PR | Estrogen Receptor / Progesterone Receptor | Breast Cancer | Response to endocrine therapy (e.g., Tamoxifen, AIs) | ER/PR+ generally indicates better prognosis | Allred Score, H-Score, % positive nuclei |
| Ki-67 | — | Breast, Neuroendocrine, Lymphomas | Predictive for chemotherapy benefit in breast cancer (e.g., in early-stage) | High index associated with poor prognosis | % positive nuclei (e.g., <20% low, ≥20% high in some breast cancer contexts) |
Table 2: Common IHC Assays and Associated Drugs
| Biomarker | FDA-Approved Companion Diagnostic Assays (Examples) | Associated Targeted Therapies |
|---|---|---|
| PD-L1 | 22C3 pharmDx (Agilent), SP142 (Ventana), SP263 (Ventana) | Pembrolizumab, Atezolizumab, Nivolumab |
| HER2 | HercepTest (Agilent), PATHWAY anti-HER2/neu (Ventana) | Trastuzumab, Pertuzumab, Ado-trastuzumab emtansine |
| ER/PR | SP1 (ER), 1E2 (PR) (Ventana); ER/PR IHC assays from multiple vendors | Tamoxifen, Fulvestrant, Aromatase Inhibitors |
| Ki-67 | MIB-1 clone (common, various vendors) | Used for decision-making in adjuvant chemotherapy (e.g., in early breast cancer) |
Experimental Protocols
Protocol 1: IHC Staining for PD-L1 (Ventana SP263 Assay)
This protocol is adapted for research using the Ventana Benchmark platform.
- Tissue Preparation: Cut 3-5 µm formalin-fixed, paraffin-embedded (FFPE) tissue sections. Mount on charged slides and dry.
- Deparaffinization & Antigen Retrieval: Use EZ Prep solution (Ventana) at 75°C. Apply Cell Conditioning 1 (CC1, Tris-based EDTA buffer, pH 8.5) at 95-100°C for 64 minutes.
- Primary Antibody Incubation: Apply ready-to-use rabbit monoclonal anti-PD-L1 (clone SP263) at 36°C for 32 minutes.
- Detection: Use the OptiView DAB IHC Detection Kit (Ventana). Apply OptiView HQ Linker for 8 min, OptiView HRP Multimer for 8 min, followed by DAB and H2O2 substrate incubation.
- Counterstaining & Coverslipping: Apply Hematoxylin II for 12 minutes, then bluing reagent for 4 minutes. Rinse, dehydrate, and mount with a permanent medium.
Protocol 2: IHC Staining for HER2 (ASCO/CAP Guideline-Compliant)
- Tissue Preparation & Baking: Cut 4 µm FFPE sections. Bake at 60°C for 60 minutes.
- Deparaffinization & Rehydration: Xylene (3 changes), 100% ethanol (2 changes), 95% ethanol, then rinse in distilled water.
- Antigen Retrieval: Use citrate buffer (pH 6.0) or EDTA-based buffer (pH 9.0) in a pressure cooker or steamer for 20-40 minutes. Cool to room temperature.
- Peroxidase Blocking: Incubate with 3% hydrogen peroxide for 10 minutes.
- Primary Antibody Incubation: Apply anti-HER2 rabbit monoclonal antibody (e.g., Clone 4B5, Ventana) for 30-60 minutes at room temperature.
- Detection: Use a polymer-based detection system (e.g., EnVision FLEX, Agilent). Incubate with labeled polymer-HRP for 30 minutes.
- Visualization & Counterstaining: Apply DAB chromogen for 5-10 minutes. Counterstain with Mayer's Hematoxylin. Dehydrate, clear, and mount.
Protocol 3: Dual IHC for ER and Ki-67 (Sequential Staining)
This protocol allows simultaneous assessment of hormone receptor status and proliferation.
- Perform ER Staining First: Complete full IHC for ER (clone SP1) using a standard protocol (similar to Protocol 2, with EDTA retrieval). Use a permanent chromogen like DAB (brown).
- Antibody Stripping: After ER visualization, treat slides with a stripping buffer (e.g., glycine-HCl, pH 2.0) or high-temperature antigen retrieval solution to denature and remove the primary/secondary antibody complex from the first round.
- Perform Ki-67 Staining Second: Apply anti-Ki-67 antibody (clone MIB-1) on the same section. Use a different chromogen (e.g., Fast Red, Vector Red) to produce a contrasting color (red/pink).
- Counterstain & Mount: Counterstain lightly with Hematoxylin and aqueous mount.
Pathway & Workflow Visualizations
The Scientist's Toolkit: Key Research Reagent Solutions
Table 3: Essential Materials for IHC Biomarker Research
| Item | Function in IHC Protocol | Example/Clone (Research Use) |
|---|---|---|
| FFPE Tissue Sections | Standardized patient-derived material for biomarker localization and scoring. | Breast carcinoma, NSCLC tissue microarrays. |
| Antigen Retrieval Buffer | Reverses formaldehyde cross-links, exposes epitopes for antibody binding. | Citrate (pH 6.0), Tris-EDTA (pH 9.0). |
| Primary Antibodies | Target-specific proteins (biomarkers) with high affinity and specificity. | PD-L1 (Clone 28-8), HER2 (Clone D8F12), ER (Clone SP1), Ki-67 (Clone MIB-1). |
| Polymer-based Detection System | Amplifies signal via enzyme-labeled polymers, reducing non-specific background. | EnVision FLEX (Agilent), UltraView (Ventana). |
| Chromogen (DAB) | Enzyme substrate producing an insoluble, visible brown precipitate at antigen site. | 3,3'-Diaminobenzidine. |
| Hematoxylin Counterstain | Stains nuclei blue, providing histological context for biomarker assessment. | Mayer's Hematoxylin, Gill's Hematoxylin. |
| Positive Control Slides | Validates staining run; tissues with known biomarker expression levels. | Tonsil (PD-L1, Ki-67), Breast Ca (HER2, ER/PR). |
| Automated IHC Stainer | Provides standardized, reproducible staining conditions for high-throughput research. | Ventana Benchmark, Agilent Autostainer. |
This application note details advanced immunohistochemistry (IHC) protocols designed to dissect spatial biology within tumor tissues. Within the broader thesis of IHC applications in cancer biomarker research, these methods move beyond single-marker detection to multiplexed, quantitative spatial analysis. This enables the direct visualization of intratumoral heterogeneity, the complex cellular composition of the tumor microenvironment (TME), and critical cell-cell interactions that govern disease progression and therapy resistance. For researchers and drug developers, this spatial context is indispensable for validating novel biomarkers, understanding mechanisms of action, and identifying patient subsets for targeted therapies.
Key Applications & Quantitative Insights
Table 1: Quantitative Metrics of Tumor Heterogeneity via Multiplex IHC
| Metric | Measurement Technique | Typical Data Range in Solid Tumors | Clinical/Biological Relevance |
|---|---|---|---|
| Tumor-Infiltrating Lymphocyte (TIL) Density | Digital cell counting in defined stromal regions | 0 - 2,500 cells/mm² | High CD8+ T-cell density correlates with improved response to immunotherapy. |
| Spatial Proximity (e.g., CD8+ to PD-L1+) | Nearest-neighbor distance analysis | Median distance: 10 - 50 μm | Shorter distances may indicate functional immune engagement. |
| Intratumoral Heterogeneity Index | Entropy scoring across multiple tissue microarrays (TMAs) cores from same tumor | Index: 0.1 (low) to 0.9 (high) | High heterogeneity is linked to worse prognosis and therapeutic resistance. |
| Proliferation Gradient (Ki-67) | Quantification from invasive margin to tumor core | % Positive cells: Core (5-15%) vs. Margin (20-40%) | Identifies aggressive tumor regions and patterns of expansion. |
| Stromal:Epithelial Ratio | Image segmentation of pan-cytokeratin vs. vimentin areas | Ratio: 0.2 (desmoplastic) to 5.0 (highly stromal) | High stromal content often associated with chemoresistance. |
Table 2: Common Multiplex IHC Panels for TME Deconvolution
| Panel Name | Target Markers (Example) | Purpose | Revealed Spatial Biology |
|---|---|---|---|
| Immune Contexture | CD8, CD4, FoxP3, CD68, PD-L1, PanCK | Quantify and locate immune cell subsets relative to tumor cells. | Immunologically "hot" vs. "cold" tumors; immune-excluded phenotypes. |
| Immunosuppressive Niche | PD-1, PD-L1, LAG-3, TIM-3, IDO-1, PanCK | Map checkpoint expression geography. | Identifies co-expression patterns and potential resistance mechanisms. |
| Cancer Stem Cell (CSC) Niche | ALDH1, CD44, CD133, β-catenin, PanCK | Locate CSC pools and their microenvironment. | CSCs often reside in peri-vascular or hypoxic niches. |
| Angio-immune Interface | CD31 (endothelium), α-SMA (CAFs), CD8, PD-L1 | Study vessel normalization and immune cell trafficking. | Assess barriers to drug and immune cell delivery. |
Detailed Experimental Protocols
Protocol 3.1: Sequential Multiplex IHC (Tyramide Signal Amplification - TSA)
Objective: To visualize 4-6 biomarkers on a single FFPE tissue section while preserving spatial relationships.
Reagents & Materials:
- FFPE tissue sections (4-5 µm)
- Target Retrieval Buffer (pH 6 and pH 9)
- Primary Antibodies (species-varied hosts: rabbit, mouse, goat)
- HRP-conjugated secondary antibodies
- TSA Opal fluorophores (e.g., Opal 520, 570, 620, 690)
- Antigen Stripping Buffer (e.g., citrate-based, pH 6.0)
- Autofluorescence quenching reagent (e.g., Vector TrueVIEW)
- DAPI for nuclear counterstain
- Antifade mounting medium
Workflow:
- Deparaffinization & Rehydration: Standard xylene and ethanol series.
- Antigen Retrieval: Heat-induced epitope retrieval (HIER) in appropriate pH buffer for the first primary antibody.
- Primary Antibody Incubation: Apply first primary antibody (e.g., rabbit anti-CD8) for 1 hour at RT or overnight at 4°C.
- Secondary HRP Antibody: Incubate with anti-rabbit HRP for 30 minutes at RT.
- TSA Fluorophore Development: Apply Opal fluorophore (e.g., Opal 520) diluted 1:100 in amplification diluent for 10 minutes.
- Antigen Stripping: Heat slide in antigen stripping buffer at 95°C for 20 minutes to remove the antibody complex without damaging tissue or fluorophores.
- Repeat: Return to Step 2, using the next primary antibody (e.g., mouse anti-PanCK) and a spectrally distinct Opal fluorophore (e.g., Opal 570). Cycle through all targets.
- Counterstain & Mount: Apply DAPI, quench autofluorescence, and mount with antifade medium.
- Image Acquisition: Use a multispectral microscope (e.g., Vectra, PhenoImager) to capture whole slide images at specific fluorescence wavelengths.
Protocol 3.2: Digital Image Analysis for Spatial Metrics
Objective: To quantify biomarker expression and calculate spatial relationships from multiplex IHC images.
Software: HALO, Visiopharm, QuPath, or ImageJ with plugins.
Workflow:
- Multispectral Unmixing: Separate the composite image into individual marker-specific channels using spectral libraries.
- Tissue Segmentation: Train a classifier to identify tissue regions (tumor epithelium, stroma, necrosis).
- Cell Segmentation & Phenotyping:
- Use DAPI to identify nuclei.
- Apply cytoplasmic/membrane detection algorithms for relevant markers.
- Set positivity thresholds (based on negative controls or intensity percentiles).
- Assign each cell a phenotype (e.g., CD8+ T cell, PD-L1+ tumor cell).
- Spatial Analysis:
- Density: Calculate cells/mm² within user-defined regions.
- Proximity: Use "nearest neighbor" function to compute distances between cell phenotypes (e.g., distance from each CD8+ cell to the nearest PD-L1+ cell).
- Interaction Mapping: Generate heatmaps or spatial scatterplots.
- Data Export: Export cell-level and image-level data (X/Y coordinates, phenotype, intensity) for statistical analysis in R or Python.
The Scientist's Toolkit: Essential Research Reagent Solutions
| Item | Function & Rationale |
|---|---|
| FFPE Tissue Microarrays (TMAs) | Contain dozens of patient samples on one slide, enabling high-throughput, controlled analysis of heterogeneity across a cohort. |
| Validated, Species-Varied Primaries | Antibodies raised in different host species (rabbit, mouse, rat) are critical for sequential multiplexing without cross-reactivity. |
| TSA/Opal Fluorophore Kits | Provide high-sensitivity, enzyme-mediated signal amplification with a wide range of spectrally distinct, stable fluorophores. |
| Multispectral Imaging System | Captures the full emission spectrum at each pixel, allowing for precise unmixing of overlapping fluorophores and autofluorescence. |
| Phenotype-Specific Cell Segmentation AI | Machine learning algorithms trained to accurately identify and segment specific cell types (e.g., lymphocytes, tumor cells) in complex tissues. |
| Spatial Analysis Software Module | Dedicated tools for calculating metrics like cell-to-cell distance, density gradients, and regional colocalization coefficients. |
Visualization of Key Concepts
Title: Sequential Multiplex IHC Workflow
Title: Cellular Interactions in the Tumor Immune Microenvironment
From Protocol to Precision: Advanced IHC Methods for Drug Development and Diagnostics
Application Notes
Immunohistochemistry (IHC) remains a cornerstone technique in cancer biomarker detection research, enabling the spatial visualization of protein expression within the complex tumor microenvironment. The reliability of IHC data directly impacts downstream analyses, including patient stratification, prognostic assessment, and therapeutic target validation. Achieving consistent, reproducible staining is a critical challenge, often complicated by pre-analytical variables, antigen retrieval inefficiencies, and detection system variability. This protocol outlines a standardized, robust IHC workflow designed to minimize technical artifacts and maximize inter-assay and inter-laboratory reproducibility, thereby strengthening the translational relevance of research findings within a thesis focused on novel cancer biomarker discovery and validation.
Experimental Protocols
Protocol 1: Tissue Preparation and Fixation (Pre-Analytical Phase)
- Objective: To preserve tissue morphology and antigenicity in a consistent manner.
- Materials: Fresh tissue specimen, 10% Neutral Buffered Formalin (NBF), cassettes, automated tissue processor, paraffin wax.
- Methodology:
- Immerse tissue specimen in a volume of 10% NBF at least 10 times greater than the tissue volume within 30 minutes of excision.
- Fix for 24-72 hours at room temperature. Do not under-fix or over-fix.
- Process fixed tissues through a series of graded alcohols and xylenes using an automated tissue processor (standard 12-16 hour cycle).
- Embed in paraffin wax using a mold and cassette.
- Section tissues at 4-5 µm thickness using a microtome and float onto positively charged or adhesive slides.
- Dry slides overnight at 37°C or for 1 hour at 60°C.
Protocol 2: Deparaffinization, Rehydration, and Antigen Retrieval
- Objective: To remove paraffin and restore antigen binding sites.
- Materials: Xylene, 100%, 95%, 80%, 70% ethanol, distilled water, antigen retrieval buffer (pH 6 or pH 9), pressure cooker or decloaking chamber.
- Methodology:
- Deparaffinize slides by immersion in fresh xylene (3 changes, 5 minutes each).
- Rehydrate through graded alcohols: 100% ethanol (2 x 3 min), 95% (2 min), 80% (2 min), 70% (2 min).
- Rinse in distilled water for 5 minutes.
- Perform Heat-Induced Epitope Retrieval (HIER): Fill a pressure cooker with appropriate antigen retrieval buffer (see Table 1), bring to a boil. Submerge slides, seal cooker, and heat until full pressure is achieved. Maintain at 121°C for 15 minutes.
- Carefully depressurize and cool the cooker in a cold water bath for 20 minutes.
- Rinse slides in distilled water, then transfer to wash buffer (1X PBS or TBS).
Protocol 3: Immunostaining Procedure
- Objective: To specifically detect target antigen with minimal background.
- Materials: Hydrogen Peroxide Block, Protein Block, Primary Antibody, Labeled Polymer-HRP Secondary, DAB Chromogen, Hematoxylin Counterstain, mounting medium.
- Methodology:
- Peroxidase Blocking: Apply 3% H₂O₂ for 10 minutes to quench endogenous peroxidase activity. Rinse with wash buffer.
- Protein Blocking: Apply 2.5% normal horse serum or a casein-based protein block for 20 minutes to reduce non-specific binding.
- Primary Antibody Incubation: Tap off block, apply optimally titrated primary antibody. Incubate for 60 minutes at room temperature or overnight at 4°C in a humidified chamber. Rinse thoroughly with wash buffer.
- Polymer Detection: Apply HRP-labeled polymer secondary reagent (e.g., anti-mouse/rabbit) for 30 minutes. Rinse with wash buffer.
- Visualization: Prepare DAB chromogen according to manufacturer's instructions. Apply to tissue and monitor development under a microscope (typically 30 seconds to 5 minutes). Immerse in distilled water to stop.
- Counterstaining: Immerse in Hematoxylin for 30-60 seconds. Rinse in tap water, then differentiate in 1% acid alcohol if needed. "Blue" in Scott's tap water substitute.
- Dehydration & Mounting: Dehydrate through graded alcohols (70%, 80%, 95%, 100% - 30 sec each) and xylene (2 x 2 min). Coverslip using permanent mounting medium.
Protocol 4: Validation and Controls
- Objective: To confirm assay specificity and performance.
- Methodology:
- Include a positive control tissue known to express the target antigen on every slide run.
- Include a negative control where the primary antibody is replaced with an isotype-matched IgG or antibody diluent on a consecutive tissue section.
- For multiplex IHC, include single-stain controls to assess spectral cross-talk.
- Use standardized scoring systems (e.g., H-score, Allred score) and digital pathology platforms for quantitation.
Data Presentation
Table 1: Optimization of Antigen Retrieval Conditions for Common Cancer Biomarkers
| Biomarker (Cancer Type) | Recommended Retrieval Buffer pH | Retrieval Method & Time | Key Diagnostic/Research Utility |
|---|---|---|---|
| ERα (Breast) | pH 9, Tris-EDTA | Pressure Cooker, 15 min | Therapeutic target (Endocrine therapy) |
| PD-L1 (NSCLC) | pH 6, Citrate | Pressure Cooker, 20 min | Predictive biomarker (Immunotherapy) |
| HER2 (Breast, Gastric) | pH 9, Tris-EDTA | Water Bath, 95°C, 40 min | Therapeutic target (Trastuzumab) |
| Ki-67 (Pan-Cancer) | pH 6, Citrate | Pressure Cooker, 15 min | Prognostic marker (Proliferation index) |
| MSH2 (Colorectal) | pH 9, Tris-EDTA | Pressure Cooker, 15 min | Diagnostic for Lynch syndrome |
Table 2: Impact of Fixation Time on IHC Staining Intensity (H-Score)
| Fixation Duration in 10% NBF | Average H-Score for ERα | Average H-Score for Ki-67 | Morphology Assessment |
|---|---|---|---|
| 8 hours (Under-fixed) | 185 ± 25 | 210 ± 30 | Suboptimal, soft tissue |
| 24 hours (Optimal) | 255 ± 15 | 265 ± 20 | Excellent, crisp nuclear detail |
| 72 hours (Standard) | 250 ± 18 | 260 ± 22 | Excellent |
| 120 hours (Over-fixed) | 165 ± 40 | 180 ± 35 | Brittle, excessive cross-linking |
Mandatory Visualization
Title: Robust IHC Staining Workflow Diagram
Title: PD-1/PD-L1 Immune Checkpoint Pathway
The Scientist's Toolkit
Table 3: Essential Research Reagent Solutions for IHC
| Item | Function in IHC Workflow | Key Consideration for Consistency |
|---|---|---|
| 10% Neutral Buffered Formalin | Cross-links proteins to preserve tissue morphology. | Fixation time must be standardized (24-72h). Over-fixation masks antigens. |
| Antigen Retrieval Buffers (Citrate pH 6.0, Tris-EDTA pH 9.0) | Reverses formaldehyde cross-linking to expose epitopes. | pH and heating method must be optimized for each target antigen. |
| Validated Primary Antibody | Binds specifically to the target protein of interest. | Requires rigorous validation via knockout cells/ tissues and titration. |
| Polymer-based HRP Detection System | Amplifies signal and visualizes antibody binding. | Superior to traditional methods (e.g., ABC) in sensitivity and consistency. |
| DAB Chromogen | Produces an insoluble brown precipitate at the antigen site. | Development time must be controlled precisely to avoid over/under-staining. |
| Automated IHC Stainer | Performs staining protocols with robotic fluid handling. | Dramatically improves inter-run reproducibility and throughput. |
| Digital Slide Scanner | Creates high-resolution whole slide images for analysis. | Enables quantitative, standardized scoring and archiving. |
Antibody Selection and Validation Strategies for Novel Biomarkers
Within the broader thesis on immunohistochemistry (IHC) applications in cancer biomarker detection research, the identification and validation of novel biomarkers is paramount. The reliability of IHC data is critically dependent on the rigorous selection and validation of primary antibodies. This document provides detailed application notes and protocols for these processes, ensuring the generation of specific, sensitive, and reproducible results essential for drug development and clinical research.
Antibody Selection Criteria
A multi-parameter assessment is required prior to procurement.
Table 1: Key Criteria for Primary Antibody Selection
| Criterion | Assessment Parameters | Optimal Outcome/Requirement |
|---|---|---|
| Target Specificity | Immunogen sequence, recognized epitope, UniProt ID cross-reference. | Epitope should be unique to target protein, preferably in a functionally relevant domain. |
| Application Validation | Peer-reviewed publications, vendor-provided data for IHC (formalin-fixed paraffin-embedded, FFPE). | Minimum of 5 independent citations with clear IHC data; vendor WB data is insufficient. |
| Species Reactivity | Compatibility with the sample species (e.g., human, mouse, rat). | Must include the species of the experimental model. |
| Clonality | Monoclonal (recombinant/hybridoma) vs. Polyclonal. | Recombinant monoclonal preferred for batch-to-batch consistency; polyclonal may offer higher sensitivity. |
| IHC Platform Validation | Validation for automated stainers (e.g., Ventana, Leica, Dako). | Antibody should be validated on the intended staining platform with known protocol. |
| Control Recommendations | Availability of positive/negative control tissues or cell lines. | Vendor should provide validated control samples. |
Validation Protocol for a Novel Biomarker Antibody in IHC
This protocol outlines a comprehensive, multi-tiered validation strategy.
Protocol 2.1: Initial Specificity Verification (Western Blot & Cell Pellet Array)
Objective: Confirm antibody recognizes the protein of interest at the correct molecular weight and demonstrates minimal off-target binding.
Materials:
- Research Reagent Solutions: RIPA lysis buffer, protease/phosphatase inhibitors, BCA assay kit, pre-cast polyacrylamide gels, PVDF/nitrocellulose membrane, HRP-conjugated secondary antibody, chemiluminescent substrate, ECL imager.
- Cell Lines: Recombinant cell lines: (1) Overexpressing the target protein, (2) CRISPR/Cas9 knockout (KO) of the target gene, (3) Wild-type (WT).
- Tissue Samples: FFPE cell pellets from the above cell lines.
Method:
- Lysate Preparation: Lyse ~1x10^6 cells from each cell line (Overexpressing, KO, WT) in RIPA buffer + inhibitors.
- Protein Quantification: Determine concentration using BCA assay.
- Western Blot: Load 20 µg of total protein per lane. Perform SDS-PAGE and transfer to membrane.
- Immunoblotting: Probe with the candidate primary antibody (optimized dilution). Use a loading control antibody (e.g., GAPDH).
- Cell Pellet IHC: Section FFPE cell pellets. Perform IHC using the candidate antibody and standard FFPE protocol.
- Analysis: The antibody is considered specific for Western if a single band at the expected molecular weight is present in WT/Overexpressing lysates and absent in KO lysates. For IHC, strong signal in Overexpressing, weak/none in KO, and moderate in WT pellets confirms specificity.
Protocol 2.2: IHC Validation in Biological Context (Tissue Microarray)
Objective: Assess staining pattern in relevant and irrelevant tissues, confirming known protein expression distribution.
Materials:
- Research Reagent Solutions: Validated Tissue Microarray (TMA) containing cores of known positive and negative tissues, antigen retrieval solution (pH6 or pH9), automated IHC stainer or humidified chamber, polymer-based detection system, hematoxylin counterstain.
- TMA: Commercially sourced or custom-built TMA with pathologist-annotated cores.
Method:
- Sectioning: Cut 4 µm sections from the TMA block.
- IHC Staining: Perform automated or manual IHC. Include a no-primary antibody control.
- Scoring: Two independent, blinded pathologists score staining for intensity (0-3+) and percentage of positive cells.
- Analysis: Compare scores to expected expression patterns from literature (e.g., public protein atlas data). Concordance >90% with expected patterns supports antibody validity.
Protocol 2.3: Orthogonal Validation
Objective: Correlate IHC staining with an independent method to confirm target identity.
Materials:
- Research Reagent Solutions: Fluorescence in situ hybridization (FISH) probes (for gene amplification), RNAscope kits (for mRNA), multiplex immunofluorescence panels with antibodies from different clones/clonality.
- Tissue Sections: Consecutive sections from the same FFPE blocks used in Protocol 2.2.
Method:
- Spatial Correlation: On consecutive sections, perform IHC with the candidate antibody and an orthogonal method (e.g., RNAscope for target mRNA).
- Digital Image Analysis: Use image analysis software to co-register sections and correlate signal intensities pixel-by-pixel or region-by-region.
- Interpretation: A high correlation coefficient (e.g., Pearson's r > 0.7) between protein (IHC) and mRNA signals strongly confirms antibody specificity.
Protocol 2.4: Pre-Analytical Variable Assessment
Objective: Determine the impact of pre-analytical factors (ischemia time, fixation duration) on staining.
Materials:
- Research Reagent Solutions: Paired tissue samples from the same surgical specimen with controlled cold ischemia times (e.g., 30 min vs. 120 min), buffers for fixation time experiments.
- Tissues: Mouse xenograft tumors or paired clinical samples where variables can be controlled.
Method:
- Controlled Experiment: Process identical tissue pieces with varying fixation times (e.g., 6, 12, 24, 48 hours in 10% NBF).
- Staining & Quantification: Perform IHC under standardized conditions. Use digital pathology to quantify H-score or positive pixel count.
- Analysis: Plot signal intensity vs. fixation time. Define the "optimal fixation window" where signal is stable. Incorporate this into the standard operating procedure.
The Scientist's Toolkit
Table 2: Essential Research Reagent Solutions for Antibody Validation
| Reagent/Category | Function/Explanation |
|---|---|
| CRISPR/Cas9 Knockout Cell Lines | Isogenic controls that genetically lack the target protein, providing the gold standard for specificity testing. |
| Recombinant Protein / Overexpression Cell Lysates | Positive controls containing a high concentration of the target antigen for assay optimization. |
| Validated Tissue Microarrays (TMAs) | Multi-tissue controls enabling high-throughput assessment of staining patterns across diverse biological contexts. |
| Multiplex Fluorescence IHC (mIHC) Panels | Allow co-localization studies with antibodies from different vendors/clones to confirm target identity and explore tumor microenvironment. |
| RNAscope / In Situ Hybridization Kits | Orthogonal validation tools that detect target mRNA in the same morphological context as IHC. |
| Automated IHC Stainer & Linker Kits | Ensure protocol consistency and reproducibility, especially for clinical-grade assay development. |
| Digital Pathology & Image Analysis Software | Enable quantitative, objective scoring of IHC staining (H-score, % positivity, intensity) and spatial analysis. |
Visualization Diagrams
Title: Multi-Tier Antibody Validation Workflow for IHC
Title: Key Variables Impacting IHC Biomarker Detection
Quantitative vs. Semi-Quantitative Scoring Systems (H-score, Allred, CPS)
Within the broader thesis on immunohistochemistry (IHC) applications in cancer biomarker detection research, the accurate and reproducible assessment of protein expression is paramount. IHC serves as a critical bridge between molecular discoveries and clinical pathology, informing prognosis, predicting therapeutic response, and validating drug targets. The translation of a stained tissue section into actionable data hinges on the scoring system employed. This document details the protocols, applications, and comparative analysis of prevalent quantitative (H-score) and semi-quantitative (Allred, Combined Positive Score [CPS]) scoring systems, providing researchers and drug development professionals with the tools for rigorous biomarker evaluation.
Comparative Analysis of Scoring Systems
Table 1: Core Characteristics of IHC Scoring Systems
| System | Classification | Parameters Scored | Calculation | Output Range | Primary Clinical/Research Context |
|---|---|---|---|---|---|
| H-score | Quantitative | Staining Intensity (0-3) & Percentage of Positive Cells | Σ (1 * % cells intensity 1) + (2 * % cells intensity 2) + (3 * % cells intensity 3) | 0 - 300 | Research, targeted therapy biomarkers (e.g., ER, HER2-low), continuous data for correlation. |
| Allred Score | Semi-Quantitative | Proportion Score (PS: 0-5) & Intensity Score (IS: 0-3) | PS + IS | 0 - 8 | Breast cancer ER/PR status, binary clinical decision-making. |
| Combined Positive Score (CPS) | Semi-Quantitative | Number of Positive Cells (Tumor & Lymphocytes/Macrophages) & Total Tumor Cells | (Number of PD-L1+ cells / Total number of viable tumor cells) * 100 | 0 - 100 | Immunotherapy biomarkers (PD-L1 in gastric, cervical, HNSCC), incorporates immune cells. |
Table 2: Quantitative Performance Comparison
| Metric | H-score | Allred Score | CPS |
|---|---|---|---|
| Inter-Observer Reproducibility | Moderate; requires rigorous training. | Good; defined bins simplify scoring. | Variable; depends on cell identification rules. |
| Data Granularity | High (300-point scale). | Low (9-point scale). | Continuous but often binned for clinical use. |
| Amenable to Digital Pathology/AI | High, ideal for algorithm training. | Moderate. | High, but complex due to multiple cell types. |
| Typical Clinical Cut-off Example | Varies by biomarker (e.g., ≥10 for HER2-low). | ≥3 for ER positivity in breast cancer. | ≥1 for Pembrolizumab in gastric cancer. |
| Key Strength | Continuous data for statistical analysis. | Fast, clinically validated for specific uses. | Accounts for tumor and immune microenvironment. |
Detailed Experimental Protocols
Protocol 1: H-score Assessment for Hormone Receptor Analysis
Application: Quantification of Estrogen Receptor (ER) expression in invasive breast carcinoma for research correlative studies.
Materials (Research Reagent Solutions):
- Validated Primary Antibody: Rabbit monoclonal anti-ER (Clone SP1) - Binds specifically to ERα in nucleus.
- IHC Detection Kit: Polymer-based HRP detection system (e.g., EnVision+) - Amplifies signal with low background.
- Hematoxylin Counterstain: Differentiates nuclei from unstained areas.
- Positive Control Tissue: ER-known breast carcinoma section - Ensures assay validity.
- Whole Slide Scanner: For digital pathology workflow - Enables digital scoring and archiving.
Methodology:
- Staining & Digitization: Perform standardized IHC on formalin-fixed, paraffin-embedded (FFPE) tumor sections. Scan slides at 20x magnification.
- Region Selection: Annotate viable tumor regions, excluding necrosis, stroma, and normal ducts.
- Intensity Classification: Visually assess each tumor cell nucleus on a scale:
- 0: No staining.
- 1+: Weak, barely perceptible staining.
- 2+: Moderate staining.
- 3+: Strong staining.
- Percentage Estimation: For each intensity category (1+, 2+, 3+), estimate the percentage of positive tumor cells. Sum of percentages must equal 100%.
- Calculation: Apply the formula: H-score = (1 * % 1+) + (2 * % 2+) + (3 * % 3+). Example: 30% 1+, 50% 2+, 10% 3+ yields H-score = (130) + (250) + (3*10) = 190.
Protocol 2: Allred Scoring for Clinical ER/PR Reporting
Application: Standardized clinical reporting of ER and Progesterone Receptor (PR) status in breast cancer.
Methodology:
- Score Proportion (PS): Estimate the percentage of positively staining tumor cell nuclei.
- 0: None
- 1: <1%
- 2: 1-10%
- 3: 11-33%
- 4: 34-66%
- 5: 67-100%
- Score Intensity (IS): Judge the average staining intensity of the positive cells.
- 0: Negative
- 1: Weak
- 2: Intermediate
- 3: Strong
- Calculate Total Score: Sum PS and IS (range 0-8).
- Binary Call: A total score of ≥3 is considered positive for ER/PR.
Protocol 3: CPS Assessment for PD-L1 in Immunotherapy Trials
Application: Determining eligibility for anti-PD-1/PD-L1 therapies in cancers like gastric or head and neck.
Methodology:
- Cell Identification: Identify viable tumor cells, lymphocytes, and macrophages within the tumor area.
- Count Positive Cells: Tally any cell (tumor, lymphocyte, macrophage) with partial or complete membrane staining of any intensity for PD-L1.
- Count Total Tumor Cells: Tally all viable tumor cells in the assessed area.
- Calculation: CPS = (Number of PD-L1+ cells / Total number of viable tumor cells) * 100. Example: 150 PD-L1+ cells (including 120 tumor and 30 immune cells) / 1000 total tumor cells = CPS 15.
Visualization: Pathway & Workflow
(Diagram 1: IHC Scoring Decision and Application Workflow)
(Diagram 2: PD-L1/PD-1 Pathway and CPS Scoring Basis)
The Scientist's Toolkit: Essential Research Reagents & Materials
Table 3: Key Reagents for IHC Scoring Validation
| Item | Function in Context | Critical Specification |
|---|---|---|
| Validated Primary Antibodies | Specific detection of target antigen (e.g., ER, PD-L1). | Clone, species, recommended dilution, ICC/ISH validation. |
| Isotype Control Antibodies | Distinguish specific from non-specific background staining. | Matched species, immunoglobulin class, and concentration. |
| Multitissue Control Microarrays (TMA) | Simultaneous validation of staining across multiple tumor types and controls. | Contains known positive, negative, and gradient expression cores. |
| Automated IHC Staining Platform | Ensures staining reproducibility, critical for longitudinal studies. | Protocol standardization, reagent volume precision. |
| Digital Pathology/Image Analysis Software | Enables quantitative scoring (H-score, CPS), reduces observer bias. | Cell detection algorithms, intensity calibration tools. |
| Certified Pathologist Reference Standards | Gold standard for training and validating scoring algorithms. | Defined by board-certified pathologists using consensus criteria. |
Multiplex IHC and Digital Pathology for Complex Biomarker Panels
Within the broader thesis on IHC applications in cancer biomarker detection research, the ability to visualize multiple biomarkers simultaneously in a single tissue section is transformative. Multiplex immunohistochemistry (mIHC) and digital pathology enable the spatial profiling of complex biomarker panels—including immune checkpoints, tumor antigens, and functional state markers—critical for understanding the tumor microenvironment (TME), predicting immunotherapy response, and identifying novel therapeutic targets. This application note details protocols and data analysis workflows for robust multiplex detection and quantitative digital analysis.
Table 1: Comparison of Primary Multiplex IHC/IF Platforms
| Platform | Principle | Max Markers per Cycle | Spatial Context Preservation | Compatible with FFPE | Typical Analysis Time (per slide) |
|---|---|---|---|---|---|
| Tyramide Signal Amplification (TSA) | Enzymatic amplification with tyramide deposition | 6-8+ (sequential cycles) | High | Yes | 4-8 hours imaging + analysis |
| Multiplexed Ion Beam Imaging (MIBI) | Metal-tagged antibodies, TOF-SIMS detection | 40+ | High | Yes | 1-2 hours acquisition |
| CODEX (Co-Detection by Indexing) | Oligo-tagged antibodies, iterative fluorescent staining | 40+ | High | Yes | 6-8 hours (including cycling) |
| Opal/ PhenoImager | TSA-based fluorescent multiplexing | 6-8 | High | Yes | 4-6 hours imaging + analysis |
| Digital Spatial Profiling (DSP) | Oligo-tagged antibodies, UV-cleavage from ROI | 50+ (from preselected ROIs) | ROI-based | Yes | 3-5 hours (depends on ROIs) |
Table 2: Example Biomarker Panel for Immuno-Oncology (Non-Small Cell Lung Cancer)
| Biomarker | Cell Type/Function | Purpose in Panel | Clone Example | Expected Positivity in TME |
|---|---|---|---|---|
| Pan-CK | Tumor cells (epithelial) | Tumor mask/identification | AE1/AE3 | 20-60% of cells |
| PD-L1 | Tumor/Immune cells | Immune checkpoint | 22C3 | 0-50% of tumor cells |
| CD8 | Cytotoxic T-cells | Effector immune infiltrate | C8/144B | 5-30% of stromal cells |
| CD68 | Macrophages | Myeloid lineage marker | KP1 | 5-25% of stromal cells |
| FOXP3 | Regulatory T-cells | Immunosuppressive cells | 236A/E7 | 1-10% of CD3+ cells |
| Ki-67 | Proliferating cells | Proliferation index | MIB-1 | Variable |
Detailed Experimental Protocols
Protocol 1: Sequential TSA-Based Multiplex IHC/IF (Opal Workflow) for 6-Color Staining
Principle: Sequential rounds of primary antibody application, HRP-polymer secondary, and tyramide-conjugated fluorophore (Opal) deposition, followed by antibody stripping, enabling multiple markers on one FFPE section.
Materials:
- FFPE tissue sections (4-5 µm) on positively charged slides
- Primary antibodies, validated for sequential IHC
- Opal fluorophore reagents (6-plex kit, e.g., Opal 520, 570, 620, 650, 690, 780)
- HRP-labeled polymer secondary antibody (e.g., anti-mouse/rabbit)
- Microwave or steamer for antigen retrieval
- Antibody stripping buffer (pH 6.0 or pH 9.0)
- Fluorescent mounting medium with DAPI
- Automated staining system (optional but recommended for reproducibility)
Method:
- Slide Preparation & Deparaffinization: Bake slides at 60°C for 1 hour. Deparaffinize in xylene and rehydrate through graded ethanol series to water.
- Antigen Retrieval: Perform heat-induced epitope retrieval (HIER) in appropriate buffer (e.g., Tris-EDTA pH 9.0 or Citrate pH 6.0) using a pressure cooker or microwave for 15-20 minutes. Cool to room temperature.
- First Staining Cycle: a. Block endogenous peroxidase with 3% H₂O₂ for 10 minutes. b. Apply protein block (e.g., 10% normal goat serum) for 10 minutes. c. Apply first primary antibody (e.g., Pan-CK) for 1 hour at RT or overnight at 4°C. d. Apply HRP-polymer secondary antibody for 30 minutes. e. Apply Opal fluorophore (e.g., Opal 520) diluted 1:100 in amplification diluent for 10 minutes.
- Antibody Stripping: Place slide in retrieval buffer and perform HIER again (microwave for 10-15 minutes) to denature and remove the primary-secondary antibody complex.
- Repeat Cycle: Repeat steps 3 and 4 for each subsequent primary antibody (e.g., CD8, PD-L1, etc.), using a different Opal fluorophore each time.
- Counterstaining & Mounting: After the final cycle, apply DAPI (1 µg/mL) for 5 minutes to stain nuclei. Rinse and mount with anti-fade fluorescent mounting medium.
- Image Acquisition: Use a multispectral or confocal microscope equipped with appropriate filter sets for each fluorophore. Capture images at 20x magnification. For whole slide imaging, use a high-throughput fluorescent slide scanner.
Protocol 2: Digital Pathology & Image Analysis Workflow for Multiplex IHC Data
Principle: Utilize digital image analysis software to quantify biomarker expression and spatial relationships from whole slide images (WSIs) of multiplex IHC stains.
Materials:
- Whole slide image file (e.g., .qptiff, .vsi, .svs format)
- Digital image analysis software (e.g., HALO, QuPath, inForm)
- High-performance computing workstation
Method:
- Image Preprocessing: Load the multispectral image. Apply image alignment if channels are slightly misregistered. If using multispectral imaging, perform spectral unmixing to eliminate autofluorescence and separate fluorophore signals.
- Tissue Detection: Use automated algorithms to detect the tissue region and exclude slide background.
- Cell Segmentation: a. Nuclear Segmentation: Use the DAPI channel to identify all nuclei. Apply a watershed or deep-learning based algorithm to separate touching nuclei. b. Cytoplasmic/Membrane Segmentation: Expand from the nuclear mask by a defined pixel radius (cytoplasm) or use marker-specific membrane detection algorithms.
- Phenotype Assignment: a. Set intensity thresholds for each biomarker (positive vs. negative) based on control samples or isotype controls. b. Create a phenotyping rule set (e.g., "CD8+ Cell" = DAPI+ nucleus, CD8 signal above threshold in cytoplasm/membrane). c. Apply rules to all segmented cells to classify them into phenotypes (e.g., Pan-CK+ PD-L1+ tumor cells, CD8+ T-cells, CD68+ macrophages).
- Quantitative & Spatial Analysis: a. Density: Calculate cells/mm² for each phenotype. b. Proportions: Calculate percentage of positive cells within a parent population. c. Spatial Metrics: Calculate cell-to-cell distances (e.g., nearest CD8+ T-cell to a PD-L1+ tumor cell). Define and quantify "immune neighborhoods" using clustering algorithms.
- Data Export & Statistical Analysis: Export cell-level and summary metrics for statistical analysis in dedicated software (e.g., R, GraphPad Prism).
Visualizations
Title: mIHC Sequential Staining & Analysis Workflow
Title: PD-1/PD-L1 Immune Checkpoint Pathway
Title: Digital Image Analysis Pipeline Logic
The Scientist's Toolkit: Essential Research Reagent Solutions
Table 3: Key Materials for Multiplex IHC & Digital Pathology
| Item | Function | Example Product/Supplier |
|---|---|---|
| Validated Primary Antibody Panels | Key biomarker detection with confirmed specificity and compatibility for sequential staining. | Cell Signaling Tech mIHC-validated Abs, Abcam, Agilent |
| Tyramide Signal Amplification (TSA) Kits | Enable high-sensitivity, multiplex fluorescent detection via enzymatic deposition of fluorophores. | Akoya Biosciences Opal Polaris Kits |
| Multispectral Imaging System | Capture high-resolution fluorescent whole slide images with spectral unmixing capability. | Akoya PhenoImager, RareCyte CyteFinder, Zeiss Axioscan |
| Digital Image Analysis Software | Quantify biomarker expression, perform cell segmentation, and calculate spatial relationships. | Indica Labs HALO, Akoya inForm, QuPath (open-source) |
| Automated Staining Platform | Increase reproducibility and throughput of complex sequential staining protocols. | Leica BOND RX, Agilent Dako Omnis |
| Indexed Fluorescent Oligo-Conjugated Antibodies | For ultra-high-plex platforms (CODEX, DSP) allowing cyclic staining/detection. | Akoya CODEX Antibody Panel, NanoString GeoMx Abs |
| Tissue Microarray (TMA) | Validate panels across hundreds of patient samples simultaneously on one slide. | Custom construction services (e.g., US Biomax) |
| Anti-Fade Mounting Medium with DAPI | Preserve fluorescence signal during storage and imaging while providing nuclear counterstain. | Vector Labs Vectashield, Thermo Fisher ProLong Diamond |
Within the context of immunohistochemistry (IHC) applications in cancer biomarker detection research, the development of targeted therapies is intrinsically linked to the co-development of precise diagnostic tools. Companion diagnostics (CDx) and target engagement biomarkers are critical components of modern drug development, enabling patient stratification and providing direct evidence of a drug's interaction with its intended target. IHC remains a cornerstone technology for visualizing protein-level biomarker expression and modification in tumor tissue, bridging preclinical discovery and clinical validation.
Application Notes
Companion Diagnostics (CDx) via IHC
CDx are assays developed to identify patients most likely to benefit from a specific therapeutic product. IHC-based CDx are prevalent in oncology.
Key Applications:
- Patient Selection: Identifying overexpression, amplification, or mutation of drug targets (e.g., HER2 for trastuzumab, PD-L1 for immune checkpoint inhibitors).
- Exclusion of Patients at Risk: Detecting biomarkers associated with adverse events.
- Monitoring Resistance Mechanisms: Assessing biomarker changes upon disease progression (e.g., loss of PTEN).
Quantitative Data Summary: Examples of FDA-Approved IHC-Based CDx
| Therapeutic Agent | Target | Indication | CDx Assay (Platform) | Clinical Cut-off Definition |
|---|---|---|---|---|
| Trastuzumab | HER2 | Breast/Gastric Cancer | HercepTest (Dako) | IHC 3+ or ISH+ |
| Pembrolizumab | PD-L1 | NSCLC, others | PD-L1 IHC 22C3 pharmDx (Agilent) | Tumor Proportion Score (TPS) ≥1%, ≥50% |
| Crizotinib | ALK | NSCLC | VENTANA ALK (D5F3) CDx Assay (Roche) | Presence of ALK fusion protein (IHC positive) |
| Durvalumab | PD-L1 | Urothelial Carcinoma | VENTANA PD-L1 (SP263) Assay (Roche) | Tumor Cell (TC) ≥25% or IC ≥25% |
Target Engagement Biomarkers via IHC
These biomarkers provide pharmacodynamic evidence that a drug has interacted with and modulated its target within the tumor microenvironment. IHC is ideal for assessing spatial and cell-type specific engagement.
Key Applications:
- Proof-of-Mechanism: Demonstrating downstream pathway modulation (e.g., loss of phosphorylated protein, nuclear translocation of a transcription factor).
- Dose Optimization: Informing Phase 2 dose selection by correlating drug exposure with target effect in tumor biopsies.
- Understanding Heterogeneity: Visualizing intratumoral variability in drug target engagement.
Quantitative Data Summary: Example IHC Readouts for Target Engagement
| Drug Class | Target | Engagement Biomarker (IHC Readout) | Typical Assay Output |
|---|---|---|---|
| EGFR Inhibitor | EGFR | Reduction in p-EGFR (Y1068) | H-Score decrease from baseline |
| AKT Inhibitor | AKT | Reduction in p-AKT (S473) | Percentage of positive tumor cells |
| PARP Inhibitor | PARP1 | Increase in PARylation (for trapping agents) | H-Score or visual scoring increase |
| CDK4/6 Inhibitor | RB1 | Reduction in p-RB (S807/811) | Allred Score or digital image analysis |
Experimental Protocols
Protocol: IHC for Companion Diagnostic Assay Development (Example: PD-L1)
This protocol outlines key steps for developing a robust, quantitative IHC assay for a CDx.
Title: Development and Validation of a PD-L1 IHC Companion Diagnostic Assay.
Objective: To establish a standardized IHC protocol for detecting PD-L1 in formalin-fixed, paraffin-embedded (FFPE) non-small cell lung carcinoma (NSCLC) tissue sections to select patients for anti-PD-1/PD-L1 therapy.
Materials: See "The Scientist's Toolkit" below.
Procedure:
- Tissue Sectioning: Cut 4 µm sections from FFPE tumor blocks. Mount on positively charged slides. Dry at 60°C for 1 hour.
- Deparaffinization and Rehydration:
- Xylene: 3 changes, 5 minutes each.
- Ethanol: 100% (2x), 95%, 70%: 2 minutes each.
- Rinse in distilled water.
- Antigen Retrieval: Use a pre-heated (95-100°C) EDTA-based retrieval solution (pH 9.0). Immerse slides and incubate for 20 minutes. Cool at room temperature for 20 minutes. Rinse in wash buffer.
- Endogenous Peroxidase Blocking: Apply 3% hydrogen peroxide solution for 10 minutes at room temperature. Rinse in wash buffer.
- Protein Block: Apply serum-free protein block for 10 minutes to reduce non-specific binding.
- Primary Antibody Incubation: Apply validated anti-PD-L1 monoclonal antibody (clone 22C3) at the optimized dilution (e.g., Ready-to-Use) for 30 minutes at room temperature. Rinse in wash buffer.
- Detection System: Apply labeled polymer-horseradish peroxidase (HRP) secondary detection system for 30 minutes at room temperature. Rinse in wash buffer.
- Visualization: Apply 3,3’-Diaminobenzidine (DAB) chromogen for 5-10 minutes, monitoring under a microscope. Rinse in distilled water.
- Counterstaining: Immerse in hematoxylin for 1-2 minutes. Rinse in tap water. Differentiate in 1% acid alcohol if needed. Blue in Scott's tap water substitute.
- Dehydration and Mounting:
- Ethanol: 70%, 95%, 100% (2x): 1 minute each.
- Xylene: 3 changes, 2 minutes each.
- Mount with permanent mounting medium.
- Scoring: Score stained slides using a validated method (e.g., Tumor Proportion Score - TPS). TPS = (Number of PD-L1 staining tumor cells / Total number of viable tumor cells) x 100%. Use a cutoff (e.g., TPS ≥1% or ≥50%) for patient stratification.
Protocol: IHC for Target Engagement Assessment (Example: p-AKT)
This protocol measures the reduction in phosphorylated AKT as evidence of AKT inhibitor engagement.
Title: Pharmacodynamic IHC Assay for p-AKT (S473) Target Engagement.
Objective: To quantify changes in p-AKT levels in paired pre- and on-treatment tumor biopsies from a clinical trial of an AKT inhibitor.
Procedure:
- Steps 1-5: Follow the same deparaffinization, antigen retrieval (using citrate buffer, pH 6.0, may be optimal for phospho-epitopes), and blocking steps as in Protocol 3.1.
- Primary Antibody Incubation: Apply anti-p-AKT (S473) monoclonal antibody at the validated concentration overnight at 4°C in a humidified chamber. Include appropriate controls.
- Steps 7-10: Follow detection, DAB visualization, and counterstaining as in Protocol 3.1.
- Digital Image Acquisition & Analysis:
- Scan slides using a whole slide scanner at 20x magnification.
- Annotate viable tumor regions by a pathologist.
- Use digital image analysis software to quantify the percentage of tumor cells with positive membranous/cytoplasmic staining.
- Calculate the H-Score (range 0-300) based on staining intensity (0, 1+, 2+, 3+) and distribution: H-Score = (3 x % strong) + (2 x % moderate) + (1 x % weak).
- Data Analysis: Compare the H-Score or % positive cells between pre- and on-treatment biopsies using a paired statistical test. A significant reduction confirms target engagement.
Signaling Pathways and Workflows
Title: Companion Diagnostic Guided Treatment Decision
Title: IHC Confirms Drug Mechanism of Action
The Scientist's Toolkit: Key Research Reagent Solutions
| Item | Function & Importance in IHC for CDx/Target Engagement |
|---|---|
| Validated Primary Antibodies | Clone-specific antibodies validated for IHC on FFPE tissue. Critical for specificity and reproducibility of CDx assays (e.g., PD-L1 clones 22C3, 28-8, SP142). |
| Automated IHC Stainer | Provides standardized, high-throughput, and reproducible staining conditions essential for clinical-grade assay development and deployment. |
| ISH-Compatible Detection System | For simultaneous detection of protein (IHC) and gene amplification/mutation (ISH) on the same slide, providing orthogonal validation. |
| Whole Slide Scanner | Enables digital pathology for remote scoring, archival, and application of quantitative digital image analysis algorithms. |
| Multiplex IHC/Optical Barcoding Kits | Allow simultaneous detection of 6+ biomarkers on one tissue section to study co-expression, immune context, and complex pathway interactions. |
| FFPE Cell Line Pellet Controls | Characterized positive and negative control materials essential for daily assay validation and quality control. |
| Phospho-Specific Antibody Validated for FFPE | Specifically recognizes the phosphorylated form of a target protein. Crucial for measuring pharmacodynamic changes as evidence of target engagement. |
| Tumor Tissue Microarray (TMA) | Contains dozens of patient tumor cores on one slide. Invaluable for high-throughput antibody screening and assay optimization during development. |
Solving the Puzzle: Troubleshooting Common IHC Pitfalls and Enhancing Assay Performance
Within cancer biomarker detection research, the validity of immunohistochemistry (IHC) data directly impacts therapeutic target identification and drug development. Accurate staining is paramount for assessing biomarker expression, tumor heterogeneity, and treatment efficacy. Poor staining outcomes—negative, weak, or high background—compromise data integrity, leading to false conclusions. This application note details systematic troubleshooting protocols to diagnose and resolve these common issues.
Quantitative Analysis of Common Staining Artifacts and Their Prevalence
Table 1: Frequency and Primary Causes of Poor IHC Staining Outcomes in Research Studies
| Staining Outcome | Approximate Frequency in Problem Cases | Top 3 Contributing Factors |
|---|---|---|
| Negative (No Signal) | 40-50% | 1. Depleted/Inactive Primary Antibody (35%) 2. Over-fixation/Antigen Masking (30%) 3. Incompatible Epitope Retrieval Method (25%) |
| Weak/Low Signal | 30-40% | 1. Suboptimal Antibody Titration (40%) 2. Under-fixation/Antigen Degradation (25%) 3. Inadequate Detection System Sensitivity (20%) |
| High Background | 20-30% | 1. Endogenous Enzyme Activity Not Blocked (30%) 2. Non-Specific Antibody Binding (30%) 3. Overdevelopment/High Chromogen Concentration (25%) |
Diagnostic and Remediation Protocols
Protocol 1: Systematic Diagnosis of Negative Staining
Objective: To identify the failure point in the IHC workflow when no specific signal is observed. Materials: Positive control tissue slides, known validated antibody, alternative detection kit. Method:
- Verify Reagents: Confirm primary antibody species, clonality, and recommended dilution. Prepare fresh buffers.
- Run Parallel Controls:
- Positive Tissue Control: Process a slide with a tissue known to express the target antigen.
- Primary Antibody Omission Control: Replace primary antibody with antibody diluent. This should yield no signal.
- Alternative Detection Control: Use a highly sensitive polymer-based detection system if a less sensitive method (e.g., indirect HRP) was initially used.
- Evaluate Antigen Retrieval: If using heat-induced epitope retrieval (HIER), ensure the pH of the retrieval buffer (e.g., pH 6 vs. pH 9) matches the antibody's requirement. Extend retrieval time by 5-10 minutes if over-fixation is suspected.
- Amplification Test: Apply a tyramide signal amplification (TSA) step post-primary antibody incubation. Appearance of signal indicates initial weak signal requiring amplification.
Protocol 2: Optimization for Weak Staining
Objective: To enhance specific signal intensity while minimizing background. Materials: Test multi-tissue array slide, serial antibody dilutions, different retrieval buffers. Method:
- Antibody Titration: Perform a checkerboard titration of the primary antibody. Test a range of dilutions (e.g., 1:50, 1:100, 1:200, 1:500) on a multi-tissue array containing both positive and negative tissues.
- Retrieval Optimization: Test both citrate (pH 6.0) and EDTA/Tris (pH 9.0) buffers using the same HIER method. Process slides in parallel.
- Incubation Adjustment: Increase primary antibody incubation time (e.g., from 1 hour at room temperature to overnight at 4°C) for improved binding kinetics.
- Signal Detection Enhancement: Switch to a polymer-based detection system containing multiple enzyme/antibody molecules for greater amplification. Increase chromogen incubation time incrementally (monitor under microscope).
Protocol 3: Reduction of Non-Specific Background
Objective: To identify and eliminate sources of non-specific staining. Materials: Non-immune serum, isotype control antibody, endogenous enzyme blocking reagents. Method:
- Blocking Steps:
- Protein Block: Extend incubation with 5-10% normal serum (from species of secondary antibody) to 30 minutes.
- Endogenous Enzyme Block: For HRP, treat with 3% H₂O₂ for 15 minutes. For AP, use levamisole.
- Endogenous Biotin Block: If using a biotin-streptavidin system, apply an endogenous biotin blocking kit sequentially.
- Antibody Specificity Controls: Include an isotype control at the same concentration as the primary antibody. The staining pattern should be clean.
- Optimize Antibody Diluent: Increase the concentration of carrier protein (e.g., 1-3% BSA) and add a mild detergent (0.1% Triton X-100) to the primary antibody diluent to reduce hydrophobic interactions.
- Stringent Washes: Increase post-primary and post-secondary antibody wash times to 3 x 5 minutes with agitation, using a buffer with adjusted ionic strength (e.g., 0.05M Tris-HCl, pH 7.6).
Visualization of Diagnostic Workflows
Title: IHC Staining Problem Diagnostic Decision Tree
Title: IHC Workflow with Key Failure Points
The Scientist's Toolkit: Essential Research Reagents & Materials
Table 2: Key Reagents for IHC Troubleshooting in Biomarker Research
| Item | Function & Rationale |
|---|---|
| Validated Positive Control Tissue | Tissue microarray containing known positive and negative tissues. Critical for distinguishing assay failure from true biomarker absence. |
| Polymer-based HRP Detection System | Highly sensitive, low-background detection method. Amplifies signal without biotin-related background. Essential for low-abundance targets. |
| Isotype Control Antibody | Matches the host species, isotype, and concentration of the primary antibody. The gold standard control for non-specific background staining. |
| Epitope Retrieval Buffers (pH 6 & pH 9) | Different antigenic epitopes require different pH for optimal unmasking after formalin fixation. Must test both for new targets. |
| Endogenous Biotin Blocking Kit | Crucial when using biotin-streptavidin detection systems to block background from endogenous biotin in tissues like liver or kidney. |
| Signal Amplification Kits (e.g., TSA) | Tyramide-based amplification can significantly increase sensitivity for weakly expressed biomarkers, turning weak staining into a clear signal. |
| Antibody Diluent with Additives | A diluent containing protein (BSA) and detergent reduces non-specific hydrophobic/ionic interactions, lowering background. |
Within cancer biomarker detection research, consistent and specific immunohistochemistry (IHC) is paramount. Optimization of pre-analytical and analytical variables—antigen retrieval, antibody titration, and blocking—is critical for reducing background, enhancing signal-to-noise ratio, and ensuring reproducible, biologically relevant data. This protocol details a systematic approach for optimizing these key variables, framed within a thesis investigating the prognostic significance of novel phospho-protein biomarkers in triple-negative breast cancer (TNBC).
Research Reagent Solutions Toolkit
| Item | Function in IHC Optimization |
|---|---|
| Formalin-Fixed, Paraffin-Embedded (FFPE) Tissue Sections | The standard specimen for clinical IHC; requires antigen retrieval due to methylene bridge cross-links formed during fixation. |
| Citrate Buffer (pH 6.0) & EDTA/EGTA Buffer (pH 9.0) | Antigen retrieval solutions. Citrate is standard for many antigens; high-pH EDTA/EGTA is superior for nuclear or phospho-antigens. |
| Heat-Induced Epitope Retrieval (HIER) System | Pressure cooker, steamer, or water bath for controlled heating of slides in retrieval buffer to reverse fixation. |
| Primary Antibody (Rabbit Monoclonal, anti-target) | The key detection reagent; must be titrated to find the concentration that gives optimal specific signal with minimal noise. |
| Normal Serum or Protein Block | (e.g., from the species of the secondary antibody). Blocks non-specific binding sites on tissue to reduce background. |
| Horseradish Peroxidase (HRP)-Conjugated Secondary Antibody | Binds to the primary antibody; conjugated enzyme catalyzes chromogen deposition. |
| Chromogen (e.g., DAB, AEC) | Enzyme substrate that produces a visible, insoluble precipitate at the antigen site. |
| Automated IHC Stainer | Provides superior reproducibility for incubation times, temperatures, and reagent application compared to manual methods. |
Table 1: Antigen Retrieval Buffer Comparison for p-AKT (Ser473) in TNBC FFPE Tissue
| Retrieval Buffer | pH | Staining Intensity (0-3+) | Background | Optimal for p-AKT? |
|---|---|---|---|---|
| Citrate | 6.0 | 1+ | Low | No |
| Tris-EDTA | 8.0 | 2+ | Moderate | Partial |
| Tris-EDTA | 9.0 | 3+ | Low | Yes |
Table 2: Titration of Primary Anti-PD-L1 Antibody (Clone 22C3)
| Antibody Dilution | Specific Membrane Signal | Cytoplasmic Background | Non-Tumor Staining | Recommended Dilution? |
|---|---|---|---|---|
| 1:50 | 3+ | High | High | No |
| 1:100 | 3+ | Moderate | Moderate | No |
| 1:200 | 3+ | Low | Low | Yes |
| 1:500 | 2+ | Very Low | None | No (under-saturated) |
Table 3: Blocking Agent Efficacy on Background Reduction
| Blocking Agent (10% v/v) | Incubation Time | Mean Background Score (0-3) | Specific Signal Preservation |
|---|---|---|---|
| None | - | 2.8 | 3+ |
| Normal Goat Serum | 30 min | 1.2 | 3+ |
| Casein-Based Block | 30 min | 0.5 | 3+ |
| BSA | 30 min | 1.5 | 3+ |
Experimental Protocols
Protocol 1: Systematic Antigen Retrieval Optimization
Objective: Identify optimal retrieval method for a novel phospho-epitope biomarker. Materials: FFPE tissue sections (positive control known), citrate buffer (pH 6.0), Tris-EDTA buffer (pH 8.0 & 9.0), heat retrieval system, staining reagents. Method:
- Cut serial 4 µm sections from TNBC FFPE block with known biomarker expression.
- Deparaffinize and rehydrate slides through xylene and graded alcohols.
- Perform parallel retrieval:
- Slide Set A: Citrate buffer, pH 6.0, 20 min in pressure cooker (95-100°C).
- Slide Set B: Tris-EDTA buffer, pH 8.0, 20 min in steamer.
- Slide Set C: Tris-EDTA buffer, pH 9.0, 20 min in water bath at 95°C.
- Cool slides for 20 min at room temperature in buffer.
- Rinse in distilled water, then PBS.
- Proceed with standardized IHC protocol: 30 min protein block, primary antibody at mid-range dilution (1:100) overnight at 4°C, appropriate secondary, DAB chromogen, hematoxylin counterstain.
- Evaluate under microscope. Optimal condition yields maximal specific signal (3+ in known positive cells) with minimal non-specific background.
Protocol 2: Checkerboard Antibody Titration
Objective: Determine optimal primary antibody concentration. Materials: Optimally retrieved slides, primary antibody, antibody diluent, automated stainer or humidified chamber. Method:
- Prepare a dilution series of primary antibody (e.g., 1:50, 1:100, 1:200, 1:500) in antibody diluent.
- Apply each dilution to a serial section of optimally retrieved tissue. Include a negative control (diluent only).
- Perform IHC with all other variables constant (blocking time, secondary antibody concentration, incubation times/temperatures, DAB development time).
- Scoring: Use a semi-quantitative H-score (intensity x percentage of positive tumor cells). The optimal dilution is the highest dilution that yields the maximum H-score before signal begins to drop, concomitant with lowest background in negative tissue structures.
Protocol 3: Evaluation of Blocking Agents
Objective: Assess efficacy of different protein blocks on background staining. Materials: Optimally retrieved and titrated slides, various blocking solutions (normal serum, casein, BSA), PBS. Method:
- Divide slides into groups (n=3 per group).
- Apply a different blocking agent to each group for 30 minutes at room temperature.
- Without rinsing, apply the optimized primary antibody directly over the block.
- Complete IHC protocol as standardized.
- Quantify background by measuring optical density in a negative tissue region (e.g., stromal collagen) using image analysis software. The optimal block provides the lowest mean background OD without attenuating the specific signal.
Visualizations
IHC Optimization Critical Steps Workflow
Troubleshooting High IHC Background
Antibody Titration Decision Pathway
Within the thesis on Immunohistochemistry (IHC) applications in cancer biomarker detection research, the reliability of any finding is fundamentally dependent on pre-analytical variables. Tissue fixation and processing are the most critical pre-analytical steps, directly governing the preservation of morphology and, more challengingly, antigenicity. Inconsistent or improper handling leads to epitope masking, degradation, or modification, resulting in false-negative or variable staining that compromises biomarker validation and drug development studies. This application note details the quantitative impact of these variables and provides standardized protocols to ensure reproducible, high-quality IHC results.
Quantitative Impact of Pre-Analytical Variables
Recent studies and quality assurance programs have systematically quantified how fixation and processing parameters affect antigen detection. The data below summarizes key findings relevant to common cancer biomarkers.
Table 1: Impact of Fixation Delay and Time on Antigenicity (IHC Score % Reduction)
| Biomarker (Cancer Type) | 1-hour Delay at RT | 4-hour Delay at RT | 24-hour Delay at RT | Prolonged Fixation (>72h) |
|---|---|---|---|---|
| ER (Breast) | 5-10% | 25-35% | 60-80% | 15-25% |
| HER2 (Breast) | <5% | 10-20% | 40-60% | 10-20% |
| Ki-67 (Multiple) | 10-15% | 30-50% | >90% | 20-40% |
| p53 (Multiple) | <5% | 15-25% | 50-70% | 5-15% |
| CD3 (Lymphoma) | 15-20% | 40-60% | >95% | 30-50% |
Table 2: Effect of Fixative Type and Processing Temperature on Antigen Retrieval Success Rates
| Fixative | Optimal Fixation Time | Cold Processing (4°C) Success Rate* | Standard Processing (RT) Success Rate* | Notes |
|---|---|---|---|---|
| 10% NBF | 18-24h | 95% | 98% | Gold standard; some epitopes masked. |
| PAXgene | 24-48h | 98% | 96% | Superior for nucleic acids & some phospho-epitopes. |
| Zinc Formalin | 24-48h | 99% | 97% | Excellent for labile surface antigens. |
| Alcohol-based | 4-18h | 92% | 90% | Good for peptides; poor morphology. |
*Success Rate = Percentage of key biomarkers (n=20) showing optimal IHC staining after standard antigen retrieval.
Detailed Protocols for Optimal Tissue Handling
Protocol 3.1: Standardized Surgical Specimen Collection and Fixation
Objective: To minimize ischemic time and ensure consistent penetration of fixative.
- Dissection: Trim tissue to a thickness not exceeding 5 mm in one dimension.
- Immediate Fixation: Submerge tissue in a 10:1 volume ratio of 10% Neutral Buffered Formalin (NBF) to tissue within 30 minutes of devascularization.
- Fixation Duration: Fix at room temperature for 18-24 hours. For small biopsies, 6-12 hours may suffice.
- Post-fixation: Transfer fixed tissue to 70% ethanol for storage (up to 1 week) prior to processing if necessary.
Protocol 3.2: Automated Tissue Processing for Optimal Antigen Preservation
Objective: To completely dehydrate and infiltrate tissue with paraffin while minimizing heat-induced epitope damage.
- Dehydration: Use a graded ethanol series: 70% (1 hr), 80% (1 hr), 95% (1 hr), 100% I (1 hr), 100% II (1 hr) – all at 15°C (cold processing).
- Clearing: Use xylene or xylene substitute: Bath I (1 hr), Bath II (1 hr) – at 15°C.
- Infiltration: Use low-melting point (52-54°C) paraffin wax: Bath I (1 hr), Bath II (1.5 hr) – at 56°C.
- Embedding: Use the same low-melting point paraffin. Cool blocks rapidly on a chilled plate.
Protocol 3.3: Antigen Retrieval Optimization Protocol
Objective: To reverse formaldehyde-induced cross-links and restore antigenicity.
- Dewax and Hydrate: Standard xylene and ethanol series.
- Retrieval Solution Choice:
- Citrate Buffer (pH 6.0): Best for most nuclear antigens (ER, p53).
- Tris-EDTA/EGTA (pH 9.0): Best for many transmembrane and cytoplasmic antigens (HER2, CD markers).
- Retrieval Method:
- Pressure Cooking: 125°C, 10 psi, for 2-3 minutes. (Highest efficacy for difficult epitopes).
- Water Bath: 96-98°C, for 20-40 minutes. (Gentler, more consistent for routine work).
- Cooling: Allow slides to cool in the retrieval solution at room temperature for 30 minutes.
- Rinse: Wash in distilled water, then place in IHC wash buffer.
Visualization of Key Concepts
Title: Impact of Pre-Analytical Steps on IHC Antigenicity
Title: Standardized Tissue Workflow for Optimal IHC
The Scientist's Toolkit: Key Research Reagent Solutions
Table 3: Essential Reagents and Materials for Tissue Quality Control in IHC
| Item | Function & Importance | Example/Note |
|---|---|---|
| Neutral Buffered Formalin (10%) | Standard fixative. Buffering prevents acidity that harms morphology and nucleic acids. | Prepared fresh monthly or use stabilized commercial solutions. |
| PAXgene Tissue System | Non-crosslinking, simultaneous fixative and stabilizer. Preserves phospho-epitopes and RNA/DNA excellently. | Critical for companion diagnostic development and multi-omics. |
| Cold Tissue Processor | Automated processor with Peltier cooling. Minimizes heat-induced epitope damage during dehydration/clearing. | Standard for research labs focusing on labile biomarkers. |
| Low-Melting Point Paraffin | Paraffin with melting point of 52-54°C. Reduces heat exposure during infiltration and embedding. | Essential for heat-sensitive antigens (e.g., some phosphorylated proteins). |
| Antigen Retrieval Buffers | Solutions of specific pH to break cross-links. pH 6.0 and pH 9.0 cover >95% of epitopes. | Use high-purity, chelating agent-free buffers for consistency. |
| Pressure Cooker / Decloaking Chamber | Provides consistent, high-temperature heat-induced epitope retrieval (HIER). | Superior to microwave for uniform, high-intensity retrieval. |
| Multiplex IHC Validation Controls | Tissue microarrays (TMAs) containing cell lines or tissues with known antigen expression levels. | Enables batch-to-batch staining normalization and protocol validation. |
| Ischemic Time Timer | Simple timer activated upon tissue resection. Documents the most critical pre-analytical variable. | A fundamental but often overlooked tool for quality documentation. |
Within the critical field of cancer biomarker detection, immunohistochemistry (IHC) serves as a cornerstone for validating expression patterns, guiding diagnosis, and informing therapeutic decisions. The reliability of IHC data, however, is fundamentally contingent upon antibody specificity. Non-specific binding, cross-reactivity, or lot-to-lot variability can lead to false-positive or false-negative results, directly impacting research conclusions and clinical translation. This application note provides detailed protocols and frameworks for rigorous antibody validation, a foundational step for any thesis focused on IHC applications in cancer research.
Core Principles of Validation
A multi-pronged strategy is essential to confirm that an antibody recognizes its intended target. The scientific community, guided by bodies like the International Working Group for Antibody Validation (IWGAV), recommends five primary pillars: 1) Genetic strategies (knockout/knockdown), 2) Orthogonal methods, 3) Independent antibody correlation, 4) Expression in tagged cell lines, and 5) Immunoprecipitation followed by mass spectrometry. For cancer biomarker IHC, the first three are most broadly applicable.
Detailed Protocols
Protocol 1: Knockdown Controls Using siRNA in Cell Line Pellet Blocks
This protocol validates specificity by reducing target expression and correlating the loss with decreased IHC signal.
Materials & Reagents:
- Target-positive cancer cell line (e.g., MCF-7 for ERα).
- Validated siRNA targeting gene of interest and non-targeting control siRNA.
- Transfection reagent.
- Cultureware and standard cell culture media.
- 10% Neutral Buffered Formalin.
- Liquid agarose (2%) for pellet formation.
- Standard IHC processing and staining equipment.
Method:
- Cell Culture & Transfection: Seed cells in multiple wells. At 60-70% confluency, transfert with target-specific siRNA and non-targeting control siRNA (in triplicate). Include an untransfected control.
- Efficiency Check (72 hrs): Harvest a parallel set of wells for qRT-PCR and/or western blot to confirm knockdown at mRNA and protein levels.
- Pellet Formation (72 hrs): Trypsinize remaining cells, centrifuge to form a loose pellet. Carefully resuspend the pellet in warm 2% liquid agarose. Allow to solidify on ice.
- Fixation & Processing: Fix the agarose-embedded pellet in 10% NBF for 24-48 hours. Process the fixed pellet into a paraffin block using standard histological tissue processing.
- Sectioning & IHC: Section the block (4-5 µm) and perform IHC using the antibody under validation alongside necessary controls (positive, negative, no-primary).
- Analysis: Score IHC staining intensity (e.g., H-score) for the knockdown vs. control pellets. A specific antibody will show a significant, quantifiable reduction in signal correlating with the molecular knockdown.
Expected Data:
| Sample | qRT-PCR (% Expression) | Western Blot Densitometry | IHC H-Score (Mean ± SD) |
|---|---|---|---|
| Non-targeting siRNA | 100 ± 8 | 1.0 ± 0.1 | 280 ± 15 |
| Target siRNA #1 | 22 ± 5 | 0.25 ± 0.05 | 65 ± 20 |
| Untransfected Control | 98 ± 7 | 0.95 ± 0.08 | 275 ± 10 |
Protocol 2: Orthogonal Validation by RNA In Situ Hybridization (RNA-ISH)
This orthogonal method detects target mRNA in the same FFPE sample format, providing independent confirmation of expression patterns.
Materials & Reagents:
- Consecutive or adjacent FFPE tissue sections from relevant cancer samples.
- RNA-ISH probe for the target gene (e.g., RNAScope or BaseScope probes).
- RNA-ISH detection kit (chromogenic).
- IHC detection kit (use a different chromogen, e.g., DAB for IHC, Fast Red for ISH).
- Hematoxylin counterstain.
Method:
- Sectioning: Cut consecutive 4 µm sections from the FFPE block. Mount on charged slides.
- Parallel Staining: Perform IHC with the antibody on one section. On the adjacent section, perform RNA-ISH according to the manufacturer's protocol (involves baking, dewaxing, protease digestion, probe hybridization, and amplification).
- Pattern Comparison: Analyze slides under a brightfield microscope. A specific antibody will show strong spatial correlation between protein signal (IHC) and mRNA signal (ISH) at the cellular and sub-tissue architecture level (e.g., tumor cells positive, stroma negative).
- Quantitative Correlation (Optional): Use digital pathology/image analysis software to quantify positive cell percentages in matched regions of interest (ROIs) from consecutive sections.
Expected Correlation Data (Digital Analysis):
| Tumor Sample | % Positive Cells by IHC (DAB) | % Positive Cells by RNA-ISH (Fast Red) | Pearson Correlation Coefficient (r) |
|---|---|---|---|
| Case 1 (High) | 85% | 78% | 0.89 |
| Case 2 (Moderate) | 45% | 50% | 0.82 |
| Case 3 (Negative) | 2% | 5% | 0.10 |
Protocol 3: Essential IHC Controls for Every Experiment
These controls must be run with every staining batch to monitor technique and reagent performance.
A. Isotype Control:
- Purpose: Identifies background from non-specific Fc receptor binding or ionic interactions.
- Protocol: Replace the primary antibody with an irrelevant immunoglobulin of the same species, class, and concentration. Any staining observed is non-specific.
B. Absorption/Pep tide Blocking Control:
- Purpose: Confirms signal is due to binding to the specific epitope.
- Protocol: Pre-incubate the primary antibody (at working concentration) with a 5-10x molar excess of the immunizing peptide antigen overnight at 4°C. Use this pre-adsorbed mixture as the primary antibody. Specific staining should be abolished or drastically reduced, while non-specific staining remains.
C. Biological Controls:
- Purpose: Provides known positive and negative tissue references.
- Protocol: Include a multi-tissue block (MTB) containing cell pellets or tissue cores with known expression status (validated by another method) on every slide. This controls for daily variation in staining conditions.
The Scientist's Toolkit: Key Research Reagent Solutions
| Item | Function in Validation |
|---|---|
| CRISPR/Cas9 KO Cell Lines | Provides definitive genetic negative control. Isogenic pairs (WT/KO) are the gold standard for confirming antibody specificity on western blot and IHC (pellet blocks). |
| Validated siRNA Pools | For transient knockdown in cell line models, enabling correlation of reduced protein with reduced IHC signal as described in Protocol 1. |
| Chromogenic RNA-ISH Probe Kits | Enable orthogonal, target-specific mRNA detection in FFPE tissues on the same platform as IHC, allowing direct pattern correlation. |
| Recombinant Tagged Protein | Used for western blot positive control to confirm antibody binds a protein of the correct molecular weight, and for peptide competition assays. |
| Immunizing Peptide | Essential for performing the absorption/blocking control to demonstrate epitope-specific binding. |
| Multi-Tissue Microarray (TMA) | Contains dozens of control tissues on one slide, allowing validation across a spectrum of expression levels and tissue contexts in a single experiment. |
| Isotype Control Antibodies | Critical negative control antibodies matched to the host species, immunoglobulin class, and concentration of the primary antibody. |
| Cell Line Pellet Array | A custom block containing formalin-fixed, paraffin-embedded pellets of various cell lines with known expression profiles, serving as a reusable biological control. |
Validation Strategy & Workflow Diagrams
Title: IHC Antibody Validation Strategy Workflow
Title: Orthogonal IHC and RNA-ISH Correlation Logic
Within the critical field of cancer biomarker detection using Immunohistochemistry (IHC), standardization is paramount for translating research findings into reliable clinical and drug development applications. Variability in pre-analytical, analytical, and post-analytical phases can compromise data integrity. This Application Note details protocols and frameworks for implementing Standard Operating Procedures (SOPs) and inter-laboratory calibration to enhance reproducibility in IHC-based biomarker studies.
Key Challenges in IHC Standardization
The variability in IHC results stems from multiple sources. A summary of major factors and their estimated impact on quantitative outcomes is presented below.
Table 1: Major Sources of Variability in IHC and Their Impact
| Source of Variability | Phase | Estimated Impact on Quantification (CV%) | Mitigation Strategy |
|---|---|---|---|
| Tissue Fixation Time | Pre-Analytical | 20-40% | SOP for fixation duration (e.g., 6-24 hrs for 10% NBF) |
| Antigen Retrieval Method | Analytical | 15-30% | Standardized pH and heating platform |
| Primary Antibody Incubation | Analytical | 25-50% | Calibrated antibody titration; controlled time/temp |
| Detection System Lot | Analytical | 10-20% | Inter-laboratory calibration with reference standards |
| Scoring Interpretation | Post-Analytical | 30-60% | Digital pathology & AI-assisted scoring algorithms |
| Cumulative Total Variability | All | >100% | Integrated SOPs & Calibration |
Core Standard Operating Procedure (SOP): IHC for HER2 Detection
This SOP provides a detailed protocol for a key cancer biomarker, incorporating controls for standardization.
Protocol: Standardized IHC Staining for HER2 (ERBB2) on Invasive Breast Carcinoma
Objective: To consistently detect and semi-quantify HER2 protein expression in formalin-fixed, paraffin-embedded (FFPE) tissue sections.
Research Reagent Solutions & Essential Materials:
- FFPE Tissue Sections: (4-5 µm thick) mounted on positively charged slides. Function: Provides the analyte-containing matrix for analysis.
- Validated Anti-HER2 Primary Antibody: e.g., Rabbit monoclonal anti-HER2 (Clone 4B5). Function: Specific binder to target epitope.
- Automated IHC Stainer: e.g., Ventana Benchmark, Leica BOND, or equivalent. Function: Ensures precise, reproducible timing and reagent application.
- Controlled Antigen Retrieval Buffer: EDTA-based, pH 9.0 or Citrate-based, pH 6.0. Function: Reverses formaldehyde-induced epitope masking.
- Polymer-based Detection System: e.g., HRP-labeled polymer conjugated with secondary antibody. Function: Amplifies signal with high sensitivity and low background.
- Chromogen: 3,3'-Diaminobenzidine (DAB). Function: Produces a stable, visible brown precipitate at antigen site.
- Reference Control Tissue Microarray (TMA): Contains cell lines or tissues with defined HER2 scores (0, 1+, 2+, 3+). Function: Run-to-run and inter-laboratory process calibration.
- Digital Slide Scanner: e.g., Aperio, Hamamatsu. Function: Enables high-resolution digital archiving and quantitative analysis.
Methodology:
- Bake & Deparaffinization: Bake slides at 60°C for 30 min. Deparaffinize in xylene and rehydrate through graded ethanol series to distilled water using a standardized protocol.
- Antigen Retrieval: Place slides in pre-heated (95-100°C) EDTA buffer (pH 9.0) in a water bath or automated retrieval chamber for 40 minutes. Cool at room temp for 20 min.
- Endogenous Peroxidase Block: Treat with 3% hydrogen peroxide solution for 10 minutes at room temperature.
- Primary Antibody Incubation: Apply validated anti-HER2 antibody at the pre-determined optimal dilution (e.g., 1:200) for 32 minutes at 37°C in a humidified chamber (automated stainer preferred).
- Detection: Apply polymer-HRP detection system according to manufacturer's instructions (typically 20-30 min incubation).
- Visualization: Apply DAB chromogen for exactly 5 minutes. Monitor development under a microscope.
- Counterstaining & Mounting: Counterstain with Hematoxylin for 1 minute, dehydrate, clear, and mount with a synthetic resin.
- Controls: Include on-slide positive (3+ HER2 carcinoma) and negative (omission of primary antibody) controls.
Scoring: Adopt ASCO/CAP guidelines using a validated digital image analysis algorithm for membrane staining intensity and completeness.
Protocol for Inter-Laboratory Calibration
This protocol establishes a method for aligning results across multiple sites.
Objective: To assess and harmonize IHC staining intensity and scoring across participating laboratories.
Methodology:
- Central Preparation of Calibration Set: A central lab prepares a TMA containing 20 cores representing a dynamic range of biomarker expression (e.g., HER2, PD-L1, Ki-67). Each core's "reference value" is established via consensus scoring by expert pathologists using a defined digital analysis tool.
- Distribution & Staining: The identical TMA block or pre-cut slides are distributed to participating laboratories (
Nlabs). - Local Analysis: Each lab processes the TMA using their in-house SOP for the target biomarker and returns stained slides and raw data (e.g., H-scores, percentage positivity).
- Data Collation & Analysis: The central lab collects all data and slides. Staining intensity is assessed using whole slide imaging and quantitative digital pathology software. Statistical analysis (e.g., Intraclass Correlation Coefficient - ICC, Cohen's kappa) is performed.
- Calibration Adjustment: If ICC < 0.9 (excellent agreement), laboratories review deviations in pre-analytical/analytical variables. A calibration factor or modified SOP (e.g., adjusted primary antibody incubation time) is recommended and validated in a second round.
Table 2: Example Inter-Laboratory Calibration Results for a PD-L1 IHC Assay
| Laboratory ID | Mean H-Score (Local) | Mean H-Score (Central Digital) | Deviation (%) | Post-Calibration ICC |
|---|---|---|---|---|
| Lab A | 45.2 | 55.1 | -18.0 | 0.94 |
| Lab B | 68.7 | 56.8 | +20.9 | 0.92 |
| Lab C | 53.1 | 54.9 | -3.3 | 0.98 |
| Overall Agreement (Pre-Calibration) | ICC = 0.72 (95% CI: 0.65-0.79) | |||
| Overall Agreement (Post-Calibration) | ICC = 0.95 (95% CI: 0.92-0.97) |
Visual Workflows
IHC Standardization Workflow with Critical Control Points
Inter Laboratory Calibration Cycle for IHC
Benchmarking Biomarkers: IHC Validation Frameworks and Comparison with Emerging Technologies
Establishing a Rigorous IHC Assay Validation Framework (CAP/CLIA Guidelines)
Within the broader research on IHC applications in cancer biomarker detection, transitioning a promising assay from research to a reliable clinical or pre-clinical tool necessitates a formal validation process. The College of American Pathologists (CAP) and the Clinical Laboratory Improvement Amendments (CLIA) provide the definitive regulatory framework for laboratories in the United States. This application note details the protocols and requirements for establishing a CAP/CLIA-compliant IHC validation framework, essential for biomarker-driven drug development and translational research.
Core Validation Parameters & Acceptance Criteria
Validation of an IHC assay requires establishing performance characteristics against predefined acceptance criteria. The following table summarizes the key parameters, their definitions, and typical benchmarks for a predictive biomarker (e.g., HER2, PD-L1).
Table 1: Essential IHC Validation Parameters & Criteria
| Parameter | Definition | Quantitative Benchmark (Example) | Purpose in Biomarker Research |
|---|---|---|---|
| Analytical Sensitivity | Lowest detectable amount of target antigen. | ≥95% concordance with a validated assay at the established cut-off. | Ensures detection of low-expressing but biologically relevant tumor clones. |
| Analytical Specificity | Assay’s ability to detect only the target antigen. | ≥90% of known positive/negative controls stain appropriately. | Confirms antibody binding is on-target, critical for accurate pathway analysis. |
| Precision (Repeatability) | Agreement under identical conditions (same run, operator, equipment). | Cohen’s kappa ≥ 0.85 for intra-run scoring. | Ensures result consistency in controlled research environments. |
| Precision (Reproducibility) | Agreement across variations (days, operators, instruments). | Cohen’s kappa ≥ 0.80 for inter-run/inter-observer scoring. | Essential for multi-site clinical trials and collaborative research. |
| Accuracy | Agreement of results with a reference method or "truth." | Overall Percent Agreement (OPA) ≥ 90% with a validated companion diagnostic. | Establishes clinical correlation for research findings. |
| Robustness | Reliability of the assay despite deliberate, small variations in protocol. | Acceptable staining (meeting criteria) across all tested conditions. | Ensures protocol resilience in routine laboratory use. |
| Reportable Range | The range of antigen expression over which the assay provides accurate and precise results. | Validated from negative controls to strongly positive controls. | Defines the quantitative or semi-quantitative scope of the assay. |
Detailed Experimental Protocols
Protocol 1: Antibody Optimization and Titration
Objective: To determine the optimal primary antibody concentration that provides maximal specific signal with minimal background. Materials: See "The Scientist's Toolkit" (Table 2). Procedure:
- Tissue Microarray (TMA) Preparation: Use a TMA containing cores with known variable expression of the target (positive, weak positive, negative) and non-target tissues.
- Serial Antibody Dilution: Prepare a series of primary antibody dilutions (e.g., 1:50, 1:100, 1:200, 1:400, 1:800) in antibody diluent.
- IHC Staining: Perform IHC using a standardized protocol (deparaffinization, antigen retrieval, peroxidase blocking, protein block) with each antibody dilution. Keep all other variables constant.
- Evaluation: Two qualified pathologists/researchers score each core for intensity (0-3+) and percentage of positive cells. The optimal dilution is the highest dilution that yields the maximum specific intensity in known positive cores without increasing background in negative cores.
Protocol 2: Inter-Observer Reproducibility Assessment
Objective: To quantify the agreement between multiple scorers, a critical component of precision. Materials: Validated IHC assay, 40-60 representative stained slides encompassing the full reportable range, scoring manual. Procedure:
- Blinded Review: Each scorer (minimum of 2-3) independently evaluates all slides without knowledge of others' scores or case details.
- Scoring: Use the validated scoring system (e.g., H-score, combined positive score (CPS), or 0-3+ scale).
- Statistical Analysis: Calculate inter-observer agreement using Cohen’s kappa (for categorical scores) or Intraclass Correlation Coefficient (ICC) for continuous scores (e.g., H-score).
- Acceptance: A kappa statistic of ≥0.80 indicates excellent agreement. Discrepant cases are reviewed to refine scoring criteria.
Visualization of Workflows and Relationships
Title: IHC Assay Validation Workflow
Title: Core IHC Staining Protocol Steps
The Scientist's Toolkit
Table 2: Essential Research Reagent Solutions for IHC Validation
| Item | Function & Importance in Validation |
|---|---|
| FFPE Tissue Microarray (TMA) | Contains multiple tissue cores on one slide, enabling high-throughput, parallel testing of antibody performance across different tissues and expression levels. Essential for precision studies. |
| Validated Positive/Negative Control Tissues | Tissues with known expression status of the target. Used in every run to monitor assay performance and demonstrate accuracy and specificity. |
| Isotype Control Antibody | A negative control antibody matching the host species and isotype of the primary antibody. Distinguishes specific from non-specific background staining. |
| Cell Line Pellet Controls | FFPE pellets of cell lines with known, stable expression levels (negative, low, high). Provide consistent, reproducible controls for daily runs and reproducibility studies. |
| Polymer-Based Detection System | A sensitive, low-background detection method (e.g., HRP-polymer). Its consistent performance is critical for assay robustness and standardization. |
| Automated Stainer | Provides superior reproducibility and consistency compared to manual staining by controlling incubation times and temperatures precisely, a key factor for CLIA compliance. |
| Digital Pathology/Image Analysis System | Enables quantitative or semi-quantitative scoring (e.g., H-score, % positivity). Reduces observer bias and improves reproducibility for continuous biomarkers. |
| Standardized Scoring Manual | A detailed document with annotated image examples for each score. The cornerstone of achieving acceptable inter-observer reproducibility. |
Within the broader research thesis on immunohistochemistry (IHC) applications in cancer biomarker detection, selecting the appropriate visualization platform is a critical foundational decision. This choice directly impacts the sensitivity, multiplexing capability, quantitative potential, and ultimately the biological conclusions drawn regarding biomarker expression and spatial distribution in tumor tissues. This application note provides a detailed comparative analysis and protocols to guide researchers in choosing between IHC and Immunofluorescence (IF) for their specific cancer research objectives.
Comparative Analysis: Core Principles and Applications
Fundamental Platform Characteristics
Immunohistochemistry (IHC)
- Detection Principle: Chromogenic detection using enzymes (typically Horseradish Peroxidase or Alkaline Phosphatase) that precipitate a colored, stable dye (e.g., DAB, brown; Fast Red, red) at the antigen site.
- Microscopy: Brightfield microscopy.
- Key Strength: Excellent morphological context. Stains are permanent and compatible with routine histopathology evaluation.
- Primary Application in Cancer Research: Single-plex biomarker detection and validation, companion diagnostics, tumor subtyping, and assessment of biomarker localization within complex tissue architecture.
Immunofluorescence (IF)
- Detection Principle: Fluorescent detection using fluorophore-conjugated reagents (e.g., Alexa Fluor dyes) that emit light at specific wavelengths upon excitation.
- Microscopy: Epifluorescence or confocal microscopy.
- Key Strength: Superior multiplexing capability (multiple biomarkers simultaneously), potential for quantitative analysis, and high signal-to-noise ratio.
- Primary Application in Cancer Research: Multiplexed spatial phenotyping of tumor microenvironment (immune cells, stroma, tumor cells), co-localization studies, and high-resolution subcellular localization.
Quantitative Comparison Table
Table 1: Platform Comparison for Cancer Biomarker Detection
| Feature | Immunohistochemistry (IHC) | Immunofluorescence (IF) |
|---|---|---|
| Max Routine Multiplexing | 2-3 markers (sequential) | 4-8+ markers (simultaneous) |
| Signal Permanence | High (years, slides stored in dark) | Low to Moderate (months, fade with light) |
| Morphology Context | Excellent (co-localizes with H&E-like view) | Good (requires counterstains like DAPI) |
| Quantitative Potential | Semi-quantitative (pathologist scoring, image analysis of density) | High (linear signal range, suitable for densitometry) |
| Sensitivity | High (signal amplification via enzymes) | Very High (amplification possible via tyramide) |
| Throughput | High (automation friendly) | Moderate (analysis can be time-intensive) |
| Primary Cost Driver | Antibody optimization, automated stainers | High-end microscopes, fluorophore-conjugated antibodies |
| Best for Thesis Applications | Translational studies linking to clinical archives, single biomarker validation | Discovery-phase spatial biology, tumor-immune interactions |
Detailed Experimental Protocols
Protocol 1: Standard Chromogenic IHC for a Cancer Biomarker (e.g., PD-L1)
Title: Automated IHC Staining Protocol for PD-L1 Detection in FFPE Tumor Sections.
Principle: Heat-induced epitope retrieval (HIER) reverses formaldehyde cross-linking in FFPE tissue, followed by sequential application of primary antibody, HRP-conjugated secondary, and DAB chromogen to visualize biomarker expression.
Materials & Reagents:
- FFPE tissue sections (4-5 µm) on charged slides
- Xylene and ethanol series (100%, 95%, 70%)
- Target Retrieval Solution (citrate buffer, pH 6.0 or EDTA/TRIS, pH 9.0)
- Peroxidase blocking solution (3% H₂O₂)
- Protein blocking solution (e.g., serum or casein)
- Validated anti-PD-L1 primary antibody
- HRP-labeled polymer secondary antibody system
- DAB Chromogen Substrate Kit
- Hematoxylin counterstain
- Mounting medium (non-aqueous)
Procedure:
- Dewax & Rehydrate: Bake slides 60°C/1hr. Deparaffinize in xylene (3x, 5 min each). Rehydrate through graded ethanol (100%, 95%, 70%, 2 min each) to distilled water.
- Antigen Retrieval: Place slides in pre-heated (95-100°C) target retrieval solution in a decloaking chamber or water bath for 20 minutes. Cool at room temperature for 30 minutes. Rinse in wash buffer (TBST or PBS).
- Peroxidase Block: Apply endogenous peroxidase block for 10 minutes at RT. Rinse with wash buffer.
- Protein Block: Apply protein block for 10 minutes at RT to reduce non-specific binding.
- Primary Antibody: Apply optimized dilution of anti-PD-L1 antibody. Incubate for 60 minutes at RT or overnight at 4°C. Rinse thoroughly with wash buffer.
- Polymer Secondary: Apply HRP-labeled polymer secondary for 30 minutes at RT. Rinse with wash buffer.
- Chromogen Detection: Prepare DAB solution per manufacturer's instructions. Apply to tissue and monitor development (typically 2-10 minutes) under a microscope. Stop reaction by immersing in distilled water.
- Counterstain & Dehydrate: Apply hematoxylin for 30-60 seconds. Rinse in tap water. Differentiate in acid alcohol if needed. "Blue" in Scott's tap water substitute. Dehydrate through graded alcohols (70%, 95%, 100%) and xylene (2x).
- Mounting: Coverslip using permanent mounting medium.
Protocol 2: Multiplex Immunofluorescence (mIF) for Tumor Immunology
Title: 4-Color Multiplex IF for Immune Cell Profiling in the Tumor Microenvironment.
Principle: Sequential rounds of staining, imaging, and antibody elution (or direct multiplexing with species/isotype-unique antibodies) to label multiple biomarkers on a single FFPE section.
Materials & Reagents:
- FFPE tissue sections (4-5 µm) on charged slides
- Multiplex IF-validated primary antibodies (e.g., anti-CD8, anti-CD68, anti-Pan-CK, anti-FOXP3)
- Species/isotype-specific fluorophore-conjugated secondary antibodies (e.g., Alexa Fluor 488, 555, 647)
- DAPI nuclear stain
- Antigen retrieval reagents (as in IHC protocol)
- Autofluorescence reduction kit (optional)
- Fluoroshield or other anti-fade mounting medium
- Phosphate-buffered saline (PBS) with Tween 20 (PBST)
Procedure (Sequential Staining & Elution Method):
- Slide Preparation: Perform dewaxing, rehydration, and antigen retrieval as per IHC Protocol steps 1-2.
- Autofluorescence Reduction (Optional): Treat slides with autofluorescence reducer (e.g., TrueBlack) per kit instructions. Rinse.
- First Staining Round:
- Apply protein block for 30 minutes.
- Apply first primary antibody (e.g., anti-Pan-CK, mouse IgG1). Incubate 1hr RT or 4°C overnight.
- Rinse with PBST.
- Apply corresponding fluorophore-conjugated secondary (e.g., AF555 anti-mouse IgG1). Incubate 1hr RT in dark.
- Rinse thoroughly.
- Imaging & Elution: Image the slide at the specific fluorescence channel. Then, perform gentle antibody elution using a low-pH glycine buffer or commercial elution buffer for 15-20 minutes. Verify elution by imaging again.
- Subsequent Rounds: Repeat Step 3 for each additional primary/secondary antibody pair (e.g., anti-CD8, rabbit IgG; anti-CD68, mouse IgG2a), followed by imaging and elution.
- Final Stain: After the last elution, perform a final staining round for the last biomarker. Apply DAPI for 5 minutes. Rinse.
- Mounting: Apply anti-fade mounting medium and coverslip. Seal edges. Store at 4°C in the dark.
Visualizing Key Methodological Pathways
Diagram 1: IHC and IF Core Workflow Divergence
Diagram 2: Multiplex IF Sequential Staining Cycle
The Scientist's Toolkit: Key Research Reagent Solutions
Table 2: Essential Materials for IHC/IF Cancer Biomarker Studies
| Item | Function & Relevance | Example/Note |
|---|---|---|
| FFPE Tissue Sections | The universal biospecimen for translational cancer research. Preserves morphology and biomolecules for long-term archival. | Ensure consistent thickness (4-5 µm) and use charged slides for adhesion. |
| Validated Primary Antibodies | Specifically bind the target cancer biomarker (e.g., HER2, PD-L1, Ki-67). Validation for IHC/IF on FFPE is critical. | Use clones with established clinical/research utility (e.g., PD-L1 22C3, HER2 4B5). |
| Chromogen Detection System (IHC) | Enzyme-mediated precipitation of a visible, stable dye at the antigen site. | HRP/DAB (brown) is most common. Consider HRP/FastRed or AP/Permanent Red for dual IHC. |
| Fluorophore-Conjugated Secondaries (IF) | Amplify signal and provide the detectable fluorescent emission for microscopy. | Use spectrally distinct, high-quantum yield dyes (e.g., Alexa Fluor series) to minimize bleed-through. |
| Antigen Retrieval Buffer | Reverses formaldehyde cross-links to expose hidden epitopes in FFPE tissue. | Choice of pH (citrate pH6.0, Tris/EDTA pH9.0) is antibody-dependent. |
| Automated Staining Platform | Provides superior reproducibility and throughput for standardized IHC/IF assays. | Essential for clinical trial or high-volume biomarker screening work. |
| Whole Slide Scanner | Digitizes stained slides for quantitative image analysis and digital pathology workflows. | Enables high-throughput, objective quantification of biomarker expression. |
| Multispectral Imaging System | For mIF, separates overlapping fluorescence emission spectra to enable true multiplexing (>4 colors). | Systems like Vectra/Polaris or CODEX allow for 6-40+ plex biomarker analysis. |
| Image Analysis Software | Quantifies biomarker expression (H-score, % positivity, density) and spatial relationships. | Open-source (QuPath) or commercial (HALO, Indica Labs) solutions available. |
| Anti-Fade Mounting Medium (IF) | Preserves fluorescence signal by reducing photobleaching during imaging and storage. | Essential for maintaining multiplex IF signal integrity over time. |
Within cancer biomarker detection research, immunohistochemistry (IHC) and molecular techniques (NGS, PCR, RNA-seq) form a complementary diagnostic and research axis. IHC provides spatial, protein-level, and morphological context within the tumor microenvironment, while molecular methods offer high-throughput, nucleotide-level precision for mutation detection, gene expression quantification, and fusion identification. This synergy is critical for validating biomarkers, understanding resistance mechanisms, and guiding therapeutic decisions.
Comparative Data Analysis
Table 1: Core Characteristics of IHC and Molecular Techniques in Biomarker Detection
| Feature | Immunohistochemistry (IHC) | Next-Generation Sequencing (NGS) | Quantitative PCR (qPCR) | RNA Sequencing (RNA-seq) |
|---|---|---|---|---|
| Analytical Target | Protein abundance & localization | DNA/RNA sequence, mutations, fusions | Specific DNA/RNA sequence abundance | Whole transcriptome RNA expression |
| Throughput | Low-medium (1-10s of markers/slide) | Very High (100s-1000s of genes/run) | High (10s-100s of targets/run) | Very High (All expressed genes) |
| Spatial Context | High (Preserves tissue architecture) | Low (Typically requires tissue homogenization) | Low (Requires tissue homogenization) | Low (Requires tissue homogenization) |
| Quantification | Semi-quantitative (H-score, % positivity) | Quantitative (variant allele frequency, counts) | Quantitative (Ct values, absolute copy #) | Quantitative (FPKM, TPM counts) |
| Turnaround Time | ~1-2 days | 5-10 days | 1-2 days | 7-14 days |
| Primary Application in Biomarkers | Protein expression (PD-L1, ER, HER2), cell typing | Mutation profiling, TMB, MSI, fusion discovery | Validation of specific mutations/transcripts, viral detection | Differential expression, novel isoform & fusion discovery |
| Limit of Detection | ~1-5% of tumor cells | 1-5% variant allele frequency | 0.1-1% variant allele frequency | Varies; low for rare transcripts |
Table 2: Complementary Use Cases in Cancer Research
| Research Question | Primary Technique | Complementary Technique | Purpose of Complementarity |
|---|---|---|---|
| HER2+ Breast Cancer Diagnosis | IHC (HER2 protein overexpression) | FISH/qPCR (HER2 gene amplification) | Confirm IHC equivocal (2+) results; reduce false positives/negatives. |
| Tumor Mutational Burden (TMB) | NGS (Computational calculation from panel) | IHC (MMR protein loss - MLH1, PMS2, MSH2, MSH6) | Identify microsatellite instability (MSI-H) as a surrogate for high TMB; provide spatial view of protein loss. |
| PD-L1 as Immunotherapy Biomarker | IHC (PD-L1 expression on tumor/immune cells) | RNA-seq (Transcriptional signatures of immune activation) | Correlate protein expression with immune phenotype; identify resistant subsets with high RNA but low protein. |
| Resistance Mechanism in Lung Cancer | NGS (Identification of EGFR T790M mutation) | IHC (Phospho-EGFR signaling pathway activation) | Confirm functional consequence of mutation via downstream pathway activation in situ. |
| Tumor Heterogeneity | IHC (Regional protein expression patterns) | Multi-region NGS or single-cell RNA-seq | Correlate spatial protein variations with underlying genomic or transcriptomic clonal evolution. |
Detailed Experimental Protocols
Protocol 1: Integrated IHC and RNA-seq Workflow for Biomarker Validation
Objective: To validate gene expression signatures identified by RNA-seq at the protein level using IHC within the same tumor sample set.
Materials: Formalin-fixed, paraffin-embedded (FFPE) tumor sections, RNA extraction kit, IHC automated stainer, specific primary antibodies, NGS library prep kit, sequencing platform.
Procedure:
- Sectioning: Cut sequential 4-5 µm sections from each FFPE block. Assign one for RNA extraction and the next for IHC.
- RNA Extraction & RNA-seq: a. Deparaffinize and digest the section for RNA extraction using a dedicated FFPE RNA kit. b. Assess RNA integrity (RIN/ DV200). c. Perform ribosomal RNA depletion or poly-A selection, followed by cDNA synthesis and library preparation. d. Sequence on an NGS platform (e.g., 50-100M paired-end reads). e. Perform bioinformatic analysis (alignment, quantification, differential expression) to identify candidate protein biomarkers.
- IHC Staining & Analysis: a. Bake the sister section at 60°C for 1 hour. b. Perform deparaffinization and rehydration through xylene and graded ethanol series. c. Perform antigen retrieval using a pressure cooker or water bath in appropriate buffer (e.g., citrate pH 6.0 or EDTA pH 9.0). d. Block endogenous peroxidase with 3% H₂O₂. e. Apply protein block (serum or BSA) for 10 minutes. f. Incubate with primary antibody (targeting candidate from step 2e) for 1 hour at room temperature or overnight at 4°C. g. Apply labeled polymer-horseradish peroxidase (HRP) secondary antibody for 30 minutes. h. Develop with 3,3'-Diaminobenzidine (DAB) chromogen for 5-10 minutes. i. Counterstain with hematoxylin, dehydrate, clear, and mount. j. Score slides using a standardized method (e.g., H-score: [% weak x 1] + [% moderate x 2] + [% strong x 3]).
- Correlation Analysis: Statistically correlate RNA-seq expression values (e.g., TPM) with IHC H-scores across the sample cohort.
Protocol 2: Mutation Validation by ddPCR and Phospho-Protein IHC
Objective: To validate a low-frequency somatic mutation detected by NGS and assess its functional protein signaling consequence.
Materials: FFPE DNA/sequential section, mutation-specific ddPCR assay, phospho-specific antibody, digital droplet PCR system.
Procedure:
- NGS Screening: Identify a candidate activating mutation (e.g., PIK3CA H1047R) via targeted panel or whole-exome sequencing.
- ddPCR Validation: a. Extract DNA from the same block used for NGS. b. Assay DNA with a mutation-specific ddPCR probe assay (FAM for mutant, HEX for wild-type). c. Generate droplets and perform PCR amplification on a droplet reader. d. Quantify absolute copies/µL of mutant and wild-type DNA to calculate variant allele frequency (VAF). Confirm NGS result if VAF > limit of detection.
- Functional IHC Validation: a. Perform IHC (as in Protocol 1, steps 3a-i) on a sequential section using a phospho-specific antibody for the pathway downstream of the mutation (e.g., phospho-AKT Ser473 or phospho-S6). b. Compare staining intensity and distribution in the mutation-positive case versus wild-type controls. c. A strong, localized phospho-signal supports the functional activation predicted by the genetic variant.
Visualizations
Diagram 1 Title: Complementary Workflow for Biomarker Profiling
Diagram 2 Title: From Mutation to IHC Signal Pathway
The Scientist's Toolkit: Key Research Reagent Solutions
Table 3: Essential Reagents for Complementary IHC-Molecular Studies
| Reagent Category | Specific Example | Function in Research |
|---|---|---|
| Nucleic Acid Extraction | FFPE RNA/DNA Extraction Kits (e.g., from Qiagen, Roche) | Isolate degraded nucleic acids of sufficient quality for downstream NGS/PCR from archival tissue. |
| IHC Antigen Retrieval | Citrate Buffer (pH 6.0) or EDTA/ Tris-EDTA Buffer (pH 9.0) | Unmask epitopes cross-linked by formalin fixation, critical for antibody binding. |
| Detection Systems | Polymer-based HRP/DAB Detection Systems | Provide high sensitivity and low background for visualizing protein targets in IHC. |
| Multiplex IHC/IF | Opal Tyramide Signal Amplification (TSA) Kits | Enable simultaneous detection of 4+ protein markers on a single tissue section. |
| Digital Analysis | Whole Slide Imaging Scanners & Image Analysis Software (e.g., HALO, QuPath) | Quantify IHC staining objectively and correlate with molecular data spatially. |
| NGS Library Prep | Hybridization Capture Panels (e.g., TruSight Oncology 500) | Enrich cancer-relevant genomic regions for mutation, TMB, and fusion analysis from limited FFPE input. |
| Ultra-Sensitive PCR | ddPCR Mutation Assay Kits | Absolutely quantify rare mutant alleles (<1% VAF) for orthogonal NGS validation. |
| Spatial Transcriptomics | Visium Spatial Gene Expression Slides (10x Genomics) | Bridge the gap by providing localized RNA-seq data mapped to H&E morphology. |
Integrating IHC with Liquid Biopsy and Other Circulating Biomarker Modalities
Within the broader thesis on Immunohistochemistry (IHC) applications in cancer biomarker detection research, this protocol details the integration of tissue-based IHC with liquid biopsy modalities. The convergence of these platforms enables comprehensive, longitudinal profiling of tumor biology, validating circulating biomarkers against the gold-standard spatial context provided by IHC.
Application Notes
Synergistic Validation of Circulating Biomarkers
IHC of tumor tissue sections provides spatial protein expression data (e.g., PD-L1, HER2) that serves as a foundational reference. Circulating tumor DNA (ctDNA) mutation analysis and circulating tumor cell (CTC) characterization from liquid biopsies offer a dynamic, systemic view. Discrepancies (e.g., positive PD-L1 in IHC but absent PD-L1+ CTCs) can reveal tumor heterogeneity and guide therapy.
Longitudinal Monitoring of Therapy Response
IHC establishes the baseline biomarker status from a diagnostic biopsy. Serial liquid biopsies (ctDNA, exosomes) monitor molecular evolution in real-time. A rising allele frequency of a targetable mutation in ctDNA may precede radiographic progression, prompting re-biopsy, where IHC can confirm phenotypic changes (e.g., loss of target antigen).
Composite Biomarker Development
Integrating multiplatform data increases diagnostic specificity. For instance, detecting ESR1 mutations in ctDNA combined with IHC-confirmed ER+ status in the primary tumor can identify candidates for extended endocrine therapy.
Protocol 1: Correlative Analysis of PD-L1 IHC and CTC Detection
Objective: To correlate tumor tissue PD-L1 expression with the presence and phenotype of circulating tumor cells.
Materials:
- Formalin-fixed, paraffin-embedded (FFPE) tumor tissue section.
- Patient-matched whole blood samples (2x10mL in CellSave tubes).
- Anti-PD-L1 antibody (Clone 22C3 or SP263) and IHC detection kit.
- CTC enrichment system (e.g., CellSearch, microfluidic chip).
- CTC staining reagents: Anti-cytokeratin (CK)-FITC, Anti-CD45-APC, DAPI, Anti-PD-L1-PE.
- Fluorescence microscope or flow cytometer for CTC analysis.
Methodology:
- IHC for PD-L1: Perform standard IHC staining on FFPE section per manufacturer's protocol. Use appropriate antigen retrieval. Score by trained pathologist using relevant clinical cutoff (e.g., Combined Positive Score (CPS) for 22C3).
- CTC Enrichment and Staining:
- Process blood sample within 96 hours of draw using the CellSearch system or equivalent for immunomagnetic enrichment (EpCAM-based).
- Stain enriched cells with CK, CD45, DAPI, and PD-L1.
- Identify CTCs as CK+/CD45-/DAPI+ events.
- Quantify the subset of CTCs that are PD-L1 positive (PE signal above threshold).
- Data Correlation: Record PD-L1 CPS from IHC and the percentage of PD-L1+ CTCs. Analyze using statistical correlation tests (e.g., Spearman's rank).
Protocol 2: Tracking HER2 Status via IHC and ctDNA
Objective: To monitor HER2 status dynamically by comparing baseline IHC with serial ctDNA ERBB2 copy number variations.
Materials:
- Primary tumor FFPE block (archival).
- Serial plasma samples (2x5mL in Streck cfDNA tubes) collected at diagnosis and every 3 months.
- Anti-HER2 IHC antibody (Clone 4B5) and detection kit.
- cfDNA extraction kit.
- Digital PCR or Next-Generation Sequencing (NGS) panel for ERBB2 amplification.
Methodology:
- Baseline HER2 IHC: Perform HER2 IHC on primary tumor. Score per ASCO/CAP guidelines (0, 1+, 2+, 3+). 3+ is positive.
- Plasma Processing & cfDNA Extraction: Centrifuge plasma, extract cfDNA from 1-3mL plasma using a column-based kit. Quantify by fluorometry.
- ctDNA Analysis:
- For dPCR: Use assays for ERBB2 and a reference gene. Calculate copy number variation.
- For NGS: Use a targeted cancer gene panel. Determine ERBB2 amplification via normalized read depth relative to controls.
- Longitudinal Integration: Plot ERBB2 amplification in ctDNA over time against the baseline IHC HER2 status. Note divergence events.
Table 1: Correlation between Tissue IHC and Circulating Biomarkers in Recent Studies
| Cancer Type | IHC Biomarker (Tissue) | Circulating Modality | Correlation Coefficient/Agreement | Clinical Implication |
|---|---|---|---|---|
| NSCLC | PD-L1 (CPS≥10) | PD-L1+ CTCs | ~65% Concordance | CTC PD-L1 dynamics predict IHC status change at progression |
| Breast Cancer | HER2 (3+) | ERBB2 amp in ctDNA | 72-78% Sensitivity, >95% Specificity | ctDNA can identify HER2 loss in metastatic sites |
| Colorectal Cancer | PTEN Loss | PTEN mutations in ctDNA | 84% Positive Predictive Value | Liquid biopsy identifies heterogeneous PTEN loss |
| Prostate Cancer | AR-V7 (Nuclear) | AR-V7 mRNA in CTCs | 85% Concordance | CTC-based AR-V7 is a functional surrogate for IHC |
Table 2: Key Research Reagent Solutions
| Item | Function in Integration Protocols |
|---|---|
| CellSave Preservative Tubes | Stabilizes blood cells for CTC analysis up to 96 hours post-draw. |
| Streck cfDNA BCT Tubes | Preserves plasma cfDNA by stabilizing nucleated cells, preventing genomic DNA contamination. |
| Validated IHC Companion Diagnostic Antibodies (e.g., 22C3, 4B5) | Provide standardized, reproducible tissue biomarker scoring aligned with clinical thresholds. |
| EpCAM-coated Immunomagnetic Beads | Enable specific capture of epithelial-derived CTCs from whole blood. |
| Ultra-sensitive NGS Panels (e.g., Guardant360, FoundationOne Liquid) | Allow simultaneous detection of mutations, CNVs, and fusions from low-input cfDNA. |
| Multiplex CTC Staining Kits | Permit simultaneous phenotypic characterization (CK, CD45, biomarker) on rare cell populations. |
Experimental Workflow and Pathway Diagrams
Title: Integrated IHC and Liquid Biopsy Workflow
Title: Biomarker Shedding and Detection Pathways
The Evolving Role of IHC in the Multi-Omics Landscape of Cancer Research
Application Notes
The integration of Immunohistochemistry (IHC) within multi-omics frameworks is transforming cancer biomarker research. As a spatial proteomics tool, IHC provides critical contextual validation for discoveries from genomics, transcriptomics, and mass spectrometry-based proteomics. This bridge between high-throughput molecular data and the tissue microenvironment is essential for understanding tumor heterogeneity, identifying therapeutic targets, and developing predictive companion diagnostics.
Key Integrative Applications:
- Spatial Validation of Omics-Derived Targets: IHC is indispensable for validating protein expression and localization of candidate biomarkers identified from bulk or single-cell RNA sequencing or proteomic screens. It confirms target relevance within the complex architecture of tumor tissue.
- Defining Phenotypically Distinct Subpopulations: IHC markers (e.g., immune cell markers, phosphorylation states) are used to segment tumors into regions of interest for subsequent spatially resolved omics analysis (e.g., GeoMx DSP, Visium), linking molecular profiles to specific cellular phenotypes.
- Informing Digital Pathology & AI Models: Quantitative IHC data (H-scores, percent positivity) serves as ground-truth annotation for training machine learning algorithms to interpret whole-slide images, enabling scalable extraction of morphological and molecular features.
- Triangulating Multi-Omics Data: IHC acts as a linchpin, correlating DNA mutations (genomics) with protein abundance and modification (proteomics) and cellular localization within the tumor microenvironment (spatial biology).
Table 1: Quantitative Comparison of IHC with Other Omics Modalities in Biomarker Detection
| Feature | Immunohistochemistry (IHC) | Next-Gen Sequencing (Genomics) | RNA-Seq (Transcriptomics) | Mass Spectrometry Proteomics |
|---|---|---|---|---|
| Primary Output | Protein localization & expression in tissue context | DNA sequence variants, copy number alterations | Global RNA expression levels | Global protein/peptide identification & quantification |
| Throughput | Low to medium (single to multiplex) | Very High | Very High | High |
| Spatial Resolution | High (cellular/subcellular) | Low (bulk tissue) to Medium (single cell, loses spatial context) | Low (bulk) to Medium (single cell, often loses spatial context) | Low (bulk) to Medium (spatial MS emerging) |
| Quantification | Semi-quantitative (pathologist scoring) to Quantitative (digital/image analysis) | Fully quantitative | Fully quantitative | Fully quantitative |
| Key Strength | Preserves tissue morphology and spatial relationships | Comprehensive mutation profiling | Discovery of novel transcripts, splicing variants | Unbiased protein discovery, post-translational modifications |
| Role in Multi-Omics | Spatial validation, defining regions for analysis, terminal downstream confirmation | Identifying driver alterations, molecular stratification | Understanding active pathways, gene regulation | Confirming protein-level expression of targets |
Detailed Protocols
Protocol 1: IHC Validation of a Transcriptomics-Derived Biomarker
Objective: To validate the protein expression and localization of a novel candidate biomarker (e.g., "Protein X") identified from a differential gene expression analysis of tumor vs. normal tissue.
Materials (The Scientist's Toolkit):
Table 2: Essential Research Reagent Solutions for IHC Validation
| Item | Function | Example/Brief Explanation |
|---|---|---|
| FFPE Tissue Sections | The analyte source. | 4-5 µm sections mounted on charged slides. Optimal preservation of morphology for IHC. |
| Validated Primary Antibody | Binds specifically to the target antigen (Protein X). | Rabbit monoclonal anti-Protein X antibody. Specificity validated via KO cell lines or siRNA. |
| Automated IHC Stainer | Standardizes the staining procedure. | Platforms like Ventana BenchMark or Leica BOND ensure reproducibility for research. |
| Detection Kit (HRP-based) | Visualizes antibody-antigen binding. | Polymer-based detection (e.g., DAB Map Kit) amplifies signal and reduces background. |
| Antigen Retrieval Buffer | Unmasks epitopes obscured by formalin fixation. | EDTA-based (pH 9.0) or Citrate-based (pH 6.0) buffer, optimized for the target antigen. |
| Digital Slide Scanner | Enables quantitative analysis. | Converts stained glass slides into high-resolution whole-slide images for digital pathology. |
| Image Analysis Software | Provides objective quantification. | Tools like HALO, QuPath, or Visiopharm for calculating H-score, % positivity, and density. |
Methodology:
- Tissue Microarray (TMA) Construction: Embed core biopsies (1-2 mm) from relevant tumor and normal control samples into a recipient paraffin block. A TMA allows high-throughput analysis of hundreds of samples on a single slide.
- Slide Preparation & Baking: Cut 4 µm sections from the TMA block, mount on slides, and bake at 60°C for 1 hour to ensure adhesion.
- Deparaffinization & Rehydration: Process slides through xylene (3 changes, 5 min each) and graded alcohols (100%, 95%, 70% - 2 min each) to water.
- Antigen Retrieval: Perform heat-induced epitope retrieval (HIER) using a decloaking chamber or pressure cooker in the appropriate buffer (e.g., Tris-EDTA, pH 9.0, 95°C for 20 minutes). Cool slides for 30 minutes.
- Endogenous Peroxidase Blocking: Incubate slides in 3% hydrogen peroxide solution for 10 minutes to quench endogenous peroxidase activity. Rinse with wash buffer.
- Protein Block: Apply a non-immune serum or protein block (e.g., 2.5% normal horse serum) for 10 minutes to reduce nonspecific background staining.
- Primary Antibody Incubation: Apply optimized dilution of the anti-Protein X antibody. Incubate at 4°C overnight in a humidified chamber. Include appropriate positive and negative (isotype control) controls on the same slide.
- Detection: The following day, use an automated stainer or manual detection system with a labeled polymer-HRP secondary antibody (e.g., anti-rabbit) per manufacturer's instructions. Incubate for 30-60 minutes at room temperature.
- Chromogen Development: Apply 3,3'-Diaminobenzidine (DAB) chromogen substrate for 5-10 minutes until optimal signal develops. Monitor under a microscope.
- Counterstaining & Mounting: Counterstain with hematoxylin for 30-60 seconds, differentiate, blue, dehydrate through alcohols, clear in xylene, and mount with a permanent mounting medium.
- Digital Analysis: Scan slides at 20x magnification. Using image analysis software, annotate tumor regions. Train an algorithm to detect DAB (brown) and hematoxylin (blue) staining. Output quantitative metrics: H-score [(3 x % strong positivity) + (2 x % moderate) + (1 x % weak)], total percent positivity, and staining intensity.
Diagram 1: IHC Workflow for Multi-Omics Target Validation
Protocol 2: Multiplex IHC (mIHC) for Tumor Microenvironment Profiling
Objective: To simultaneously characterize multiple cell types (e.g., cytotoxic T-cells, regulatory T-cells, macrophages) and their functional states (PD-1, Ki-67) within the tumor microenvironment on a single FFPE section.
Methodology (Sequential Immunofluorescence Approach):
- Slide Preparation & Antigen Retrieval: Follow steps 1-5 from Protocol 1.
- Primary/Secondary Antibody Cycle 1: Apply first primary antibody (e.g., anti-CD8, mouse IgG). Incubate, then apply a fluorophore-conjugated secondary antibody (e.g., AF488 anti-mouse). Incubate in the dark.
- Image Acquisition: Image the entire slide or selected regions of interest at the appropriate fluorescence channel.
- Antibody Stripping: Apply a stripping buffer (e.g., pH 2.0 glycine buffer or commercial stripping solution) to remove the primary-secondary antibody complex without damaging the tissue or other epitopes.
- Validation of Stripping: Re-image the same region to confirm complete loss of the fluorescent signal from cycle 1.
- Repeat Cycles: Return to step 2 with the next primary antibody (e.g., anti-FOXP3) and a different fluorophore (e.g., AF555). Repeat cycles of staining, imaging, and stripping.
- Nuclear Counterstain & Final Scan: After the final cycle, stain nuclei with DAPI, acquire the DAPI channel image, and perform image registration to align all sequential images.
- Multiplex Analysis: Use multiplex image analysis software (e.g., HALO, inForm) to perform cell segmentation based on DAPI and membrane/cytoplasmic markers. Phenotype each cell based on multi-marker expression and analyze spatial relationships (e.g., distances between cell types).
Diagram 2: Sequential mIHC Workflow
Conclusion
Immunohistochemistry remains an indispensable, versatile tool for cancer biomarker detection, uniquely bridging morphological context with protein expression analysis. As outlined, mastery requires a deep understanding of its foundational principles, meticulous methodological execution, proactive troubleshooting, and rigorous validation against emerging standards. For researchers and drug developers, a robust IHC workflow is critical for target identification, patient stratification, and companion diagnostic development. The future of IHC lies in its integration with multiplexed spatial proteomics, AI-driven digital pathology, and multi-omic datasets, enhancing its quantitative power and clinical utility. By adhering to the optimized practices and comparative frameworks discussed, professionals can ensure their IHC data delivers reliable, actionable insights, thereby accelerating the translation of biomarker discoveries into effective precision oncology therapies.