IHC vs Immunofluorescence: A Guide to Sensitivity, Applications, and Choosing the Right Method
This article provides a comprehensive comparison of Immunohistochemistry (IHC) and Immunofluorescence (IF) for researchers and drug development professionals.
IHC vs Immunofluorescence: A Guide to Sensitivity, Applications, and Choosing the Right Method
Abstract
This article provides a comprehensive comparison of Immunohistochemistry (IHC) and Immunofluorescence (IF) for researchers and drug development professionals. It covers the foundational principles, detection methods (chromogenic vs. fluorescent), and inherent sensitivities of each technique. The scope extends to methodological applications in diagnostics and complex research, best practices for troubleshooting and optimization, and guidelines for validation and method selection. The integration of digital pathology and AI is also discussed, offering a complete resource for leveraging these powerful spatial biology tools.
Core Principles: How IHC and IF Work from Antibodies to Detection
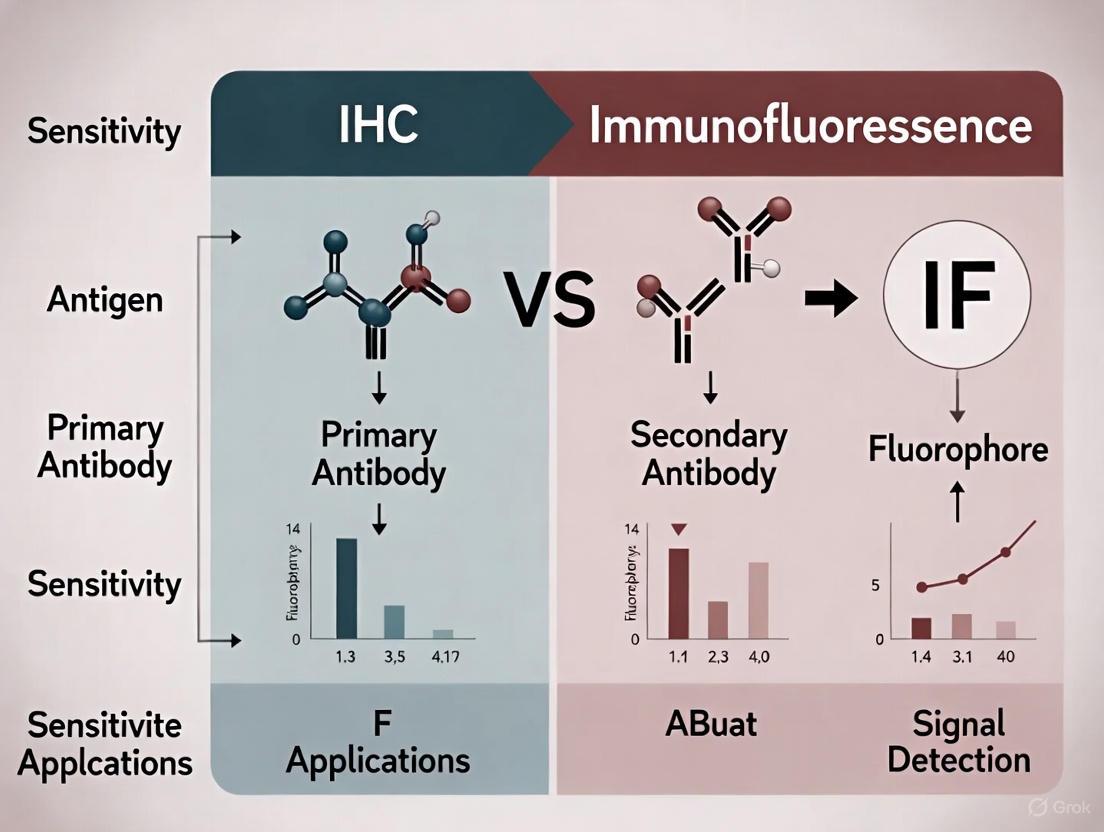
The precise localization and analysis of specific proteins within tissues are fundamental to advancing our understanding of cellular functions, disease mechanisms, and therapeutic development. For researchers, scientists, and drug development professionals, selecting the appropriate technique for visualizing these targets is a critical decision that directly impacts data quality and interpretability. Two of the most pivotal technologies in this domain are Immunohistochemistry (IHC) and Immunofluorescence (IF). IHC uses enzymatic reactions to produce a permanent, precipitating color signal visible by standard light microscopy, while IF utilizes fluorophore-conjugated antibodies to emit light upon excitation, requiring fluorescence microscopy [1] [2]. This guide provides an objective, data-driven comparison of IHC and IF, focusing on their sensitivity, applications, and performance within modern research and diagnostic contexts. The evolution of these techniques, particularly into multiplexed assays, is reshaping biomarker discovery and validation, offering unprecedented insights into the tumor microenvironment and complex disease states [3] [4].
Fundamental Principles and Key Differences
At their core, both IHC and IF rely on the specific binding of an antibody to a target antigen within a tissue sample. However, their detection methodologies and the resulting data diverge significantly. The foundational difference lies in the label and detection system.
Immunohistochemistry (IHC) typically uses enzymes such as Horseradish Peroxidase (HRP) or Alkaline Phosphatase (AP) conjugated to an antibody. When a substrate is added, the enzyme catalyzes a reaction that produces an insoluble, colored precipitate at the antigen site [5]. The most common chromogens are 3,3'-Diaminobenzidine (DAB), which produces a brown stain, and compounds that produce a red stain. This stained sample can be viewed with a standard light microscope and produces a permanent slide [1] [5].
Immunofluorescence (IF) employs fluorophores—chemical compounds that re-emit light upon excitation. These fluorophores are conjugated to antibodies, and when excited by light of a specific wavelength, they emit light of a longer wavelength, which is captured using a fluorescence microscope [2] [6]. Common fluorophores include Fluorescein Isothiocyanate (FITC) and Tetramethylrhodamine Isothiocyanate (TRITC) [2].
The table below summarizes the core technical distinctions:
Table 1: Core Technical Principles of IHC and IF
| Feature | Immunohistochemistry (IHC) | Immunofluorescence (IF) |
|---|---|---|
| Detection Principle | Enzymatic (Chromogenic) | Optical (Fluorescence) |
| Label Type | Enzyme (e.g., HRP, AP) | Fluorophore (e.g., FITC, TRITC) |
| Signal Output | Colored precipitate | Light emission |
| Microscopy Required | Bright-field/Light microscope | Fluorescence/Confocal microscope |
| Permanence of Signal | Permanent; resistant to fading | Temporary; susceptible to photobleaching |
| Primary Application Context | Diagnostic pathology, clinical diagnostics | Research, cell biology, multiplexing |
A critical advancement for both techniques, particularly for IHC, is antigen retrieval. Formalin-fixed, paraffin-embedded (FFPE) tissues, the most common clinical specimen type, undergo protein cross-linking during fixation that can mask target antigens. To restore antibody binding, two main retrieval methods are employed: Heat-Induced Epitope Retrieval (HIER), which uses heat and buffer to break cross-links, and Protease-Induced Epitope Retrieval (PIER), which uses enzymatic digestion [1] [2]. The choice of method must be optimized for each specific antigen-antibody pair.
Comparative Performance and Sensitivity Analysis
Sensitivity—the ability to detect low-abundance antigens—is a paramount consideration in technique selection. The inherent signal amplification mechanisms of IHC and IF differ, leading to distinct performance profiles.
IHC Sensitivity: The indirect IHC method, where a labeled secondary antibody binds to a primary antibody, provides the first level of amplification. Modern detection systems further enhance this through polymer-based conjugates, where multiple enzyme molecules are linked to a single antibody, dramatically increasing the number of chromogen molecules deposited per primary antibody [5]. While highly sensitive for many targets, IHC can be limited by enzyme kinetics and the precipitation reaction.
IF Sensitivity: Indirect IF also offers signal amplification, as multiple secondary antibodies can bind to a single primary. Its sensitivity can be vastly increased using methods like the Tyramide Signal Amplification (TSA) system. TSA uses the enzyme HRP to catalyze the deposition of numerous fluorophore-labeled tyramide molecules at the antigen site, resulting in a very strong signal that is capable of detecting even low-abundance targets with high clarity [3] [4]. However, IF sensitivity can be compromised by photobleaching, the fading of fluorescence upon prolonged light exposure, which requires the use of anti-fade mounting media [2] [6].
The table below summarizes key performance metrics based on experimental and application data:
Table 2: Performance and Sensitivity Comparison
| Parameter | Immunohistochemistry (IHC) | Immunofluorescence (IF) |
|---|---|---|
| Sensitivity | High (amplified by polymer systems) | Very High (especially with TSA amplification) |
| Signal-to-Noise Ratio | Can be affected by endogenous enzyme activity [5] | Can be affected by tissue autofluorescence |
| Spatial Resolution | Good for cellular and subcellular localization | Excellent; enables super-resolution microscopy |
| Multiplexing Capability | Limited (typically 2-3 markers with different chromogens) | High (5-8+ markers with TSA; 30-60+ with cyclical staining) [3] |
| Quantification Ease | Moderate (color deconvolution required) [3] | High (direct spectral separation per channel) [3] |
| Throughput for Routine Diagnostics | High (compatible with automated stainers) [5] | Lower (requires specialized imaging and analysis) |
Supporting experimental data comes from a 2025 prospective cohort study comparing commercial and in-house assays for detecting neuronal autoantibodies. This study demonstrated that in cerebrospinal fluid (CSF), both IFA (Immunofluorescence Assay) and CBA (Cell-Based Assay, often using IF) showed high concordance for key biomarkers. For instance, all samples positive for anti-LGI1 and anti-CASPR2 autoantibodies were successfully detected by both tissue-based IFA and CBA methods, highlighting the robustness of well-validated assays regardless of the core technology [7].
Experimental Protocols and Workflows
A successful experiment depends on a rigorously optimized protocol. While IHC and IF share many preliminary steps, their staining and detection phases differ.
Shared Foundational Steps
- Sample Preparation: Tissues are collected and fixed, most commonly in neutral-buffered formalin, to preserve morphology and prevent degradation. For long-term storage and thin sectioning, tissues are embedded in paraffin (FFPE) or frozen in optimal cutting temperature (OCT) compound [1] [5].
- Sectioning and Mounting: Thin sections (4-5 µm for FFPE) are cut using a microtome (FFPE) or cryostat (frozen) and mounted on glass slides, preferably charged or adhesive-coated to prevent tissue loss [5].
- Deparaffinization and Rehydration: For FFPE sections, paraffin is removed with xylene or xylene-substitutes, followed by a series of ethanol washes to rehydrate the tissue [1].
- Antigen Retrieval: As described in Section 2, HIER or PIER is performed to unmask epitopes [1] [2].
- Blocking: To minimize non-specific background staining, tissues are incubated with a blocking solution. This can be a protein solution like Bovine Serum Albumin (BSA), normal serum from the host species of the secondary antibody, or commercial blocking buffers [2] [6]. For IHC, an additional step to block endogenous peroxidase or phosphatase activity is critical [5].
Staining and Detection Protocols
IHC Staining Protocol (Indirect Method with Polymer Detection) [1] [5]:
- Apply primary antibody, optimized for specific dilution and incubation time (e.g., 30-60 minutes at room temperature).
- Wash slides to remove unbound antibody.
- Apply a polymer-conjugated secondary antibody linked to HRP. The polymer technology allows for multiple enzyme molecules per antibody, enhancing sensitivity.
- Wash slides.
- Apply chromogen substrate (e.g., DAB). The enzymatic reaction produces a visible, insoluble precipitate.
- Counterstain with hematoxylin to provide nuclear detail and tissue context.
- Dehydrate, clear, and mount with a permanent mounting medium.
IF Staining Protocol (Indirect Method) [2] [6]:
- Permeabilization: For intracellular targets, a detergent like Triton X-100 is applied post-fixation to allow antibody penetration. (Note: Methanol fixation inherently permeabilizes cells).
- Apply primary antibody (as optimized).
- Wash slides.
- Apply fluorophore-conjugated secondary antibody. The incubation must be performed in the dark to prevent photobleaching.
- Wash slides thoroughly in the dark to reduce background.
- Counterstain with a nuclear dye like DAPI.
- Mount with an aqueous, anti-fade mounting medium to preserve fluorescence.
Figure 1: Comparative workflow for IHC and IF staining. While initial sample preparation is shared, detection paths diverge after the blocking step. HIER: Heat-Induced Epitope Retrieval; PIER: Protease-Induced Epitope Retrieval.
The Scientist's Toolkit: Essential Research Reagents
The reliability of IHC and IF data is contingent on the quality and appropriate use of key reagents. The following table details essential components for a successful experiment.
Table 3: Essential Reagents for IHC and IF Experiments
| Reagent / Solution | Function | Key Considerations |
|---|---|---|
| Fixatives (Formalin, Methanol) | Preserves tissue architecture and immobilizes antigens. | Formalin cross-links; Methanol precipitates. Over-fixation can mask epitopes [1] [2]. |
| Primary Antibody | Binds specifically to the target antigen. | Monoclonal (high specificity) vs. Polyclonal (high sensitivity). Validation for specific application (IHC/IF) is critical [5] [6]. |
| Detection System (IHC) | Enzyme-linked polymer conjugates for signal generation. | HRP-polymer systems are common. Blocking of endogenous peroxidase is required [5]. |
| Fluorophore (IF) | Emits light upon excitation for detection. | Brightness, photostability, and spectral overlap must be considered. FITC (green) and TRITC (red) are classics [2]. |
| Chromogen (IHC) | Enzyme substrate that produces a colored precipitate. | DAB (brown) is most common; AP-Red is used for double-staining or melanin-rich tissues [5]. |
| Mounting Medium | Preserves sample and prepares for microscopy. | IF requires anti-fade medium to retard photobleaching [6]. |
| Antigen Retrieval Buffer | Unmasks epitopes obscured by fixation. | Citrate (pH 6.0) and EDTA/ Tris (pH 9.0) are common; optimal pH is antigen-dependent [1] [2]. |
Applications in Research and Drug Development
The choice between IHC and IF is often dictated by the application's primary goal, moving from routine single-analyte detection to complex spatial phenotyping.
Diagnostic and Clinical Applications: IHC is the undisputed gold standard in clinical pathology for tumor classification, subtyping, and biomarker assessment (e.g., PD-L1, HER2) due to its compatibility with bright-field microscopy, permanent record, and resemblance to H&E morphology [8] [5]. IF is primarily a research tool but has critical diagnostic niches, such as detecting autoantibodies in autoimmune diseases like autoimmune encephalitis using tissue-based immunofluorescence assays (IFA) [7].
Drug Development and Biomarker Discovery: IHC is routinely used in preclinical and clinical trials to demonstrate drug efficacy by showing target engagement or downstream pharmacological effects (e.g., down-regulation of a phospho-protein) [1] [8]. The integration of digital pathology and artificial intelligence (AI) is revolutionizing IHC, enabling automated quantification of biomarker expression and minimizing interpretive variability [9] [8].
Multiplexing and Spatial Biology: This is where IF, particularly multiplex Immunofluorescence (mIF), excels. mIF allows for the simultaneous detection of 5-8 (or more) markers on a single tissue section, enabling the detailed characterization of complex cellular interactions and functional states within the tumor microenvironment (TME) [3]. Technologies like Tyramide Signal Amplification (TSA) and DNA-barcoded antibodies are at the forefront of this revolution, allowing for high-plex imaging on automated platforms [3] [4]. These spatial biology approaches are generating high-dimensional data that are crucial for identifying novel predictive biomarkers for immunotherapy, such as the density and location of specific T-cell populations [3].
Figure 2: Technique selection guide based on primary application goal. IHC dominates clinical and high-throughput quantitative applications, while IF is preferred for high-resolution and complex multiplexing studies.
IHC and IF are powerful, complementary techniques for protein localization. The decision between them is not a matter of which is universally superior, but which is optimally suited to the specific research or diagnostic question.
IHC remains the cornerstone of diagnostic pathology and is ideal for high-throughput, single-plex biomarker analysis where a permanent record and compatibility with routine laboratory infrastructure are required. Its ongoing integration with digital pathology and AI is enhancing its quantitative power and reproducibility.
IF, particularly in its multiplexed form (mIF), is an indispensable research tool for dissecting complex cellular ecosystems and spatial relationships. Its superior sensitivity and multiplexing capacity make it the technology of choice for advanced biomarker discovery and mechanistic studies in immunology and oncology.
The future of both techniques lies in continued standardization, as championed by organizations like the Society for Immunotherapy of Cancer [3], and the deeper integration of automated, high-plex workflows with sophisticated computational analysis. This synergy will undoubtedly unlock deeper biological insights and accelerate the development of novel therapeutics.
The division between Immunohistochemistry (IHC) and Immunofluorescence (IF) represents a fundamental methodological choice in biomedical research and diagnostics, centered on their distinct detection systems. IHC uses chromogenic enzymes to produce permanent, visible stains under brightfield microscopy, while IF employs fluorescent dyes that emit light upon excitation with specific wavelengths [10] [11]. This distinction in detection chemistry creates a cascade of technical differences that dictate their applications, capabilities, and limitations.
The historical development of these techniques reveals their complementary nature. The foundational work began in the 1940s when Albert Coons developed the first fluorescently conjugated antibody, a fluorescein-labeled anti-pneumococcal antibody that could detect bacteria within macrophages [11]. This pioneering work established the basis for IF. The subsequent development of enzyme-conjugated antibodies in the 1960s, particularly with peroxidase and alkaline phosphatase, paved the way for modern IHC, with technical optimizations such as antigen retrieval methods emerging throughout the 1970s and 1980s [11]. Today, both techniques remain indispensable, with IHC dominating clinical diagnostic workflows and IF enabling advanced multiplexing and spatial biology studies.
The core detection principles create this divide. In IHC, antibodies are conjugated to enzymes like Horseradish Peroxidase (HRP) or Alkaline Phosphatase (AP). These enzymes catalyze reactions with chromogenic substrates such as 3,3'-Diaminobenzidine (DAB) to form insoluble, colored precipitates at the antigen site [12] [10]. In contrast, IF uses fluorophores - molecules that absorb light at specific wavelengths and emit it at longer wavelengths - directly conjugated to antibodies or detected via fluorescent secondary antibodies [13] [11]. This fundamental difference in detection mechanism creates the performance and application divergence explored in this guide.
Figure 1: Fundamental Detection Principles of IHC and IF. IHC relies on enzyme-mediated chromogenic precipitation, while IF depends on fluorophore excitation and emission properties.
Technical Comparison: Detection Chemistry and Performance
Core Detection Mechanisms
The chromogenic detection system in IHC creates permanent stains through enzymatic amplification. When the enzyme-conjugated antibody binds to its target, it catalyzes the conversion of a colorless chromogenic substrate into a colored, insoluble precipitate that deposits at the antigen site [12] [11]. The most common system uses HRP with DAB, producing a brown precipitate that is easily visible under standard brightfield microscopy. This signal remains stable for years, making IHC ideal for archival purposes and clinical diagnostics requiring long-term sample preservation [10].
In contrast, IF detection relies on the photophysical properties of fluorophores. When a fluorophore absorbs photons at its excitation wavelength, electrons jump to a higher energy state; as they return to ground state, they emit photons at a longer wavelength (lower energy) [13]. This Stokes shift between excitation and emission wavelengths allows separation of signals using optical filters. However, this fluorescence is susceptible to photobleaching when fluorophores permanently lose their ability to fluoresce after prolonged light exposure [13] [10]. The signal stability difference represents a key trade-off: IHC provides permanent archives while IF offers greater sensitivity and multiplexing capability.
Performance Metrics and Limitations
Table 1: Direct Comparison of IHC and IF Performance Characteristics
| Parameter | Immunohistochemistry (IHC) | Immunofluorescence (IF) | Ultra-high-plex IF |
|---|---|---|---|
| Detection Chemistry | Chromogenic enzymes (HRP/AP + DAB, AEC) | Direct or secondary fluorophores | Repeated dye cycles with color separation software |
| Maximum Markers/Slide | 1-2 markers | 2-8 markers | 10-60 markers [10] [3] |
| Signal Stability | Permanent, archivable for years | Moderate (photobleaching risk) | Moderate (software-corrected) |
| Sensitivity/Dynamic Range | Moderate | High | Very high |
| Spatial Resolution | Good (crisp morphology aids pathologist review) | Excellent (subcellular precision) | Excellent (single-cell resolution) |
| Equipment Needed | Brightfield microscope | Fluorescence microscope | Advanced scanner + AI analytics [10] |
| Typical Turnaround Time | 3-5 days | 5-7 days | 7-10 days [10] |
| Best Applications | Diagnostic workflows, GLP archiving, morphology assessment | Spatial biology, co-localization, immune cell typing | Tumor microenvironment, complex immunophenotyping [10] [3] |
The sensitivity advantage of IF stems from the direct relationship between light emission and detector sensitivity, unlike IHC's enzymatic amplification which has a ceiling effect [10]. However, IHC provides superior morphological context that pathologists are trained to interpret, as the chromogenic stain can be easily correlated with tissue architecture in a manner similar to conventional H&E staining [10]. This makes IHC particularly valuable for diagnostic applications where tissue morphology is crucial for interpretation.
A significant limitation of traditional IHC is its restricted multiplexing capability. While attempting to detect multiple markers simultaneously, color overlap complicates analysis, typically limiting standard IHC to 1-2 markers per slide [10]. In contrast, IF's spectral separation enables detection of multiple targets through careful fluorophore selection, with traditional IF handling 2-8 markers and advanced platforms like Akoya PhenoCycler-Fusion reaching 10-60 markers on a single slide [10] [3].
Experimental Protocols and Methodologies
Standard IHC Protocol for Single-Marker Detection
The following protocol represents a standardized approach for chromogenic IHC, optimized for formalin-fixed paraffin-embedded (FFPE) tissues [11]:
Tissue Preparation and Sectioning: Cut FFPE tissue sections at 4μm thickness using a microtome and mount on charged slides. Bake slides at 60°C for 30 minutes to enhance adhesion.
Deparaffinization and Rehydration: Immerse slides in xylene (2 changes, 10 minutes each), followed by graded ethanol series (100%, 95%, 70% - 2 minutes each), and finally distilled water.
Antigen Retrieval: Perform heat-induced epitope retrieval using citrate buffer (pH 6.0) or Tris-EDTA buffer (pH 9.0) in a pressure cooker or water bath at 90-95°C for 20 minutes. The choice of buffer depends on the antibody epitope characteristics.
Peroxidase Blocking: Incubate with 3% hydrogen peroxide for 10 minutes to quench endogenous peroxidase activity.
Protein Blocking: Apply serum-free protein block for 10 minutes to reduce non-specific background staining.
Primary Antibody Incubation: Apply optimized primary antibody dilution and incubate for 60 minutes at room temperature or overnight at 4°C.
Secondary Antibody incubation: Apply enzyme-conjugated secondary antibody (typically HRP-polymer systems) for 30 minutes.
Chromogen Development: Incubate with DAB substrate for 3-5 minutes, monitoring development under microscope. Rinse with distilled water to stop reaction.
Counterstaining and Mounting: Counterstain with hematoxylin for 30-60 seconds, dehydrate through graded alcohols and xylene, and mount with permanent mounting medium.
This protocol produces stable, permanent staining suitable for brightfield microscopy and long-term archiving. Validation should include appropriate positive and negative controls to ensure antibody specificity [14].
Standard IF Protocol for Multiplex Detection
The following protocol outlines a standardized approach for multiplex IF, optimized for FFPE tissues [10] [3]:
Tissue Preparation and Sectioning: Cut FFPE tissue sections at 5-7μm thickness and mount on charged slides. The slightly thicker sections compared to IHC help preserve tissue during multiple staining cycles.
Deparaffinization and Rehydration: Same as IHC protocol through xylene and graded ethanol series to distilled water.
Antigen Retrieval: Perform heat-induced epitope retrieval using citrate buffer (pH 6.0) in a pressure cooker at 125°C for 3 minutes, then cool to 90°C.
Autofluorescence Reduction: Optional step using TrueBlack Lipofuscin Autofluorescence Quencher or similar reagent for 30 seconds to reduce background.
Protein Blocking: Apply protein block containing 5% normal serum and 1% BSA for 30 minutes to reduce non-specific binding.
Primary Antibody Incubation: Apply first primary antibody and incubate for 60 minutes at room temperature or overnight at 4°C.
Fluorophore-Conjugated Secondary Antibody: Apply species-specific fluorophore-conjugated secondary antibody for 60 minutes at room temperature, protected from light.
Nuclear Counterstaining: Apply DAPI (0.5μg/mL) for 5 minutes to visualize nuclei.
Mounting: Mount with anti-fade mounting medium to reduce photobleaching.
Image Acquisition: Image using fluorescence microscope with appropriate filter sets for each fluorophore, ideally within 24 hours to minimize signal degradation.
For multiplex IF beyond 3-4 markers, more sophisticated approaches are required, such as tyramide signal amplification (TSA) or iterative staining methods that involve antibody stripping between rounds of staining [3]. These advanced methods require specialized equipment and validation to ensure signal specificity across multiple cycles.
Figure 2: Comparative Workflows for IHC and IF. Note the critical differences in section thickness, detection systems, and mounting methods that reflect their distinct applications.
Research Reagent Solutions and Materials
Table 2: Essential Research Reagents and Materials for IHC and IF
| Category | Specific Reagents/Materials | Function | IHC/IF Application |
|---|---|---|---|
| Fixatives | 10% Neutral Buffered Formalin, Paraformaldehyde (PFA), Ethanol/Methanol | Preserve tissue architecture and antigenicity | Both (choice affects antigen retrieval) |
| Antigen Retrieval Buffers | Citrate Buffer (pH 6.0), Tris-EDTA (pH 9.0) | Reverse formaldehyde cross-linking and expose epitopes | Both (buffer selection is antibody-dependent) |
| Blocking Reagents | Normal Serum, BSA, Serum-Free Protein Block | Reduce non-specific antibody binding | Both |
| Enzymes | Horseradish Peroxidase (HRP), Alkaline Phosphatase (AP) | Catalyze chromogen conversion to colored precipitate | IHC only |
| Chromogenic Substrates | DAB (brown), AEC (red), Vector Blue, Vector Red | Form insoluble colored precipitates at antigen sites | IHC only |
| Traditional Fluorophores | FITC, TRITC, Cy3, Cy5 | Emit fluorescence at specific wavelengths upon excitation | IF only |
| Advanced Fluorophores | Alexa Fluor series, BODIPY, Rhodamine derivatives | High brightness, photostability, and pH resistance | IF only (multiplexing applications) |
| Mounting Media | Permanent Mounting Medium, Anti-fade Mounting Media | Preserve slides and reduce signal degradation | Both (choice critical for signal preservation) |
| Counterstains | Hematoxylin, DAPI, Hoechst | Visualize nuclei and tissue architecture | Both (IHC: hematoxylin; IF: DAPI) |
The selection of appropriate fluorophores is particularly critical for successful IF experiments. Key considerations include the Stokes shift (separation between excitation and emission peaks), quantum yield (emission efficiency), and photostability (resistance to photobleaching) [13] [15]. For multiplex IF, careful spectral separation is essential to minimize cross-talk between channels. The Alexa Fluor series generally offers superior brightness and photostability compared to traditional fluorophores like FITC, while cyanine dyes (Cy3, Cy5) provide narrow emission peaks ideal for multicolor experiments [15].
For IHC, the choice of chromogen depends on the application. DAB produces a permanent, alcohol-insoluble brown precipitate that is ideal for archival material and subsequent analysis. Other chromogens like AEC (red) are alcohol-soluble and require aqueous mounting, but may provide better contrast with certain tissues [11]. The enzyme selection (HRP vs. AP) may be influenced by endogenous enzyme activity in the tissue being studied.
Applications and Experimental Data
Diagnostic Concordance and Validation Studies
The clinical application of IHC is well-established in diagnostic pathology, particularly for biomarker assessment in cancer. A prospective study comparing IHC and Fluorescence In Situ Hybridization (FISH) for HER2 status in breast cancer demonstrated 82% concordance between the methods [16]. However, significant discordance rates were observed in specific subgroups: 30% in IHC 2+ cases, 7.1% in IHC 3+ cases, and 19.2% in IHC 0/1+ cases [16]. This highlights both the utility and limitations of IHC as a screening tool, with FISH serving as a necessary reflex test for ambiguous cases.
The development of virtual staining technologies using artificial intelligence represents an emerging application that bridges both detection methods. Deep generative models can now digitally generate virtual IHC images from H&E-stained samples, potentially offering a cost-effective alternative for biomarker assessment [12]. These approaches frame virtual staining as an image-to-image translation problem, mapping from H&E (source domain) to IHC (target domain) using both paired and unpaired training data [12]. While still in development, such technologies demonstrate how computational methods may eventually augment both IHC and IF workflows.
Multiplexing Capabilities and Spatial Biology
The superior multiplexing capacity of IF enables sophisticated spatial analysis of the tumor microenvironment (TME). Technologies like multiplexed immunohistochemical consecutive staining on single slide (MICSSS) and DNA-barcoded antibody methods now permit detection of 10-60 markers on a single tissue section [3]. This high-plex capability has revealed complex immunophenotypes with clinical significance, such as the density of CD8+CD39+ T cells in non-small cell lung carcinoma and spatial relationships between PD-1+ and PD-L1+ cells in Merkel cell carcinoma [3].
The analytical requirements for multiplex IF data are substantially more complex than for IHC. Analysis pipelines must include color deconvolution (for brightfield multiplex IHC) or spectral unmixing (for multiplex IF), tissue segmentation, cell segmentation, phenotyping, and spatial analysis [3]. These workflows typically require specialized computational tools and validation at each step to ensure data reliability. For multiplex IHC using brightfield microscopy, color deconvolution algorithms separate the contribution of individual chromogens from red, green, blue (RGB) images, generating separate channels for each stain [3].
Practical Application Guidelines
Selection between IHC and IF should be guided by specific research questions and practical constraints:
Choose IHC when:
- Permanent, archivable slides are required for regulatory compliance or clinical diagnostics
- Only 1-2 markers need to be detected simultaneously
- Brightfield microscopy is the only available imaging modality
- Crisp morphology assessment is prioritized for pathologist review
- Lower cost and complexity are essential factors [10]
Choose IF when:
- 3 or more markers need to be detected on the same slide
- Spatial biology and co-localization studies are research priorities
- High sensitivity and dynamic range are required for target detection
- Access to fluorescence imaging systems is available
- Subcellular localization precision is necessary [10]
For drug development applications, the high-plex capability of IF enables comprehensive characterization of the TME and complex immunophenotypes that may predict therapeutic response. The Society for Immunotherapy of Cancer has developed best practice guidelines for multiplex IHC/IF to standardize these applications across laboratories [3].
The detection divide between chromogenic enzymes in IHC and fluorescent dyes in IF represents more than just technical preferences—it reflects fundamental trade-offs between permanence and multiplexing, accessibility and sensitivity, morphology and spatial resolution. IHC remains the workhorse of clinical diagnostics, providing stable, morphologically rich data that integrates seamlessly into pathological assessment. IF enables sophisticated multidimensional analyses that reveal cellular interactions and complex phenotypes within the tissue microenvironment.
The evolving landscape of both technologies points toward increased integration rather than replacement. Computational approaches like virtual staining may eventually bridge these domains, while advanced multiplexing platforms continue to push the boundaries of what can be measured in a single tissue section. For researchers and drug development professionals, the optimal approach often involves leveraging both technologies strategically—using IHC for validated clinical biomarkers and IF for exploratory spatial biology—to comprehensively understand disease mechanisms and therapeutic responses.
In the fields of biomedical research and diagnostics, the accurate detection and quantification of protein biomarkers directly within their native tissue context is fundamental to understanding disease mechanisms and advancing therapeutic development. Two cornerstone techniques—Immunohistochemistry (IHC) and Immunofluorescence (IF)—enable this vital visualization. Despite sharing a common principle of antibody-antigen recognition, their underlying detection chemistries impart distinct performance profiles, particularly regarding inherent sensitivity and dynamic range. These technical characteristics are not merely academic distinctions; they directly influence which biological questions can be reliably answered. This guide provides an objective, data-driven comparison of IHC and IF, framing the discussion within the broader thesis of how detection methodology dictates application suitability, with a focus on the needs of researchers and drug development professionals.
Fundamental Principles and Key Distinctions
At their core, both IHC and IF rely on the specific binding of an antibody to a target antigen. The critical difference lies in the method of signal generation and detection.
- Immunohistochemistry (IHC) utilizes antibodies conjugated to enzymes (such as Horseradish Peroxidase or Alkaline Phosphatase). When a chromogenic substrate (e.g., DAB or AEC) is introduced, the enzyme catalyzes a reaction that produces a colored precipitate at the antigen site. This signal is visible under a standard brightfield microscope and results in a stable, permanent slide that can be archived [17] [10].
- Immunofluorescence (IF) employs antibodies tagged directly or indirectly with fluorescent dyes (fluorophores). When excited by light of a specific wavelength, these dyes emit light of a longer wavelength, creating a visible signal detected by a fluorescence microscope. This approach enables highly multiplexed experiments but is susceptible to photobleaching, where the fluorescent signal fades over time [17].
Table 1: Core Technical Characteristics of IHC and IF
| Parameter | Immunohistochemistry (IHC) | Immunofluorescence (IF) |
|---|---|---|
| Detection Chemistry | Chromogenic enzyme reaction | Fluorescent dye emission |
| Signal Visualization | Brightfield microscope | Fluorescence microscope |
| Signal Stability | Permanent and archivable [10] | Subject to photobleaching [17] |
| Multiplexing Potential | Limited (typically 1-2 markers) [10] | High (2-8+ with traditional IF; 10-60+ with ultra-high-plex platforms) [10] |
| Inherent Resolution | Lower | Higher, enabling superior subcellular localization [17] |
| Best Suited For | Diagnostic workflows, pathologist review, long-term archiving [17] [10] | Spatial biology, co-localization studies, immune cell phenotyping [18] [10] |
Comparative Performance Data: Sensitivity and Dynamic Range in Practice
The theoretical distinctions between IHC and IF translate into measurable differences in assay performance. Sensitivity refers to the lowest concentration of an antigen that can be reliably distinguished from background, while dynamic range defines the span of antigen concentrations over which the assay provides a quantitative response.
Quantitative Evidence from HER2 Assay Development
The challenge of accurately quantifying low-abundance targets is exemplified by HER2 testing in breast cancer. Traditional IHC, while effective for identifying HER2-high amplified cancers, struggles with the limited dynamic range of chromogenic detection, making it difficult to consistently distinguish between low (IHC 1+) and ultra-low (IHC 0) expression levels. This has direct clinical consequences, as this distinction now determines patient eligibility for novel antibody-drug conjugates (ADCs) [19]. One study noted that pathologist concordance for this distinction can be as low as 26%, meaning a patient's treatment could depend more on the assessing pathologist than on the tumor's biology [19].
To overcome these limitations, a High-Sensitivity HER2 (HS-HER2) quantitative assay was developed. This method moves beyond subjective pathologist scoring to objective measurement in attomoles per square millimeter (amol/mm²). In a prospective validation study:
- The HS-HER2 assay demonstrated a coefficient of variation below 10%, indicating high precision and reproducibility [20].
- The assay revealed that 71% of cases traditionally scored as IHC=0 actually had HER2 expression levels above the assay's limit of quantification, highlighting the superior sensitivity of quantitative methods over conventional IHC scoring [20].
- This work underscores a broader shift in the field: moving from treating IHC as a qualitative "stain" to regarding it as a quantitative laboratory assay, a transition that requires calibration standards and rigorous analytic validation similar to other diagnostic disciplines like ligand binding assays [21] [19].
The Multiplexing Advantage of Immunofluorescence
The dynamic range of an experiment is also a function of how many targets can be measured simultaneously in a single sample. Here, IF holds a distinct advantage. While IHC is typically limited to 1-2 markers per slide due to color overlap, traditional IF can easily accommodate 2-8 markers [10]. Furthermore, advanced platforms like the Akoya PhenoCycler-Fusion push this further, allowing for the simultaneous detection of 10 to 60 protein biomarkers on a single slide [10]. This ultra-high-plex capability provides a vast "data range," enabling researchers to comprehensively characterize complex cellular microenvironments, such as the tumor immune landscape, without consuming precious sample material across multiple serial sections.
Detailed Experimental Protocols
To illustrate how the inherent properties of these techniques are realized in practice, below are detailed methodologies for a key quantitative IHC protocol and a multiplex IF workflow.
Protocol: High-Sensitivity Quantitative HER2 IHC Assay
This protocol is adapted from a validation study for a quantitative HER2 assay [19].
Objective: To objectively quantify HER2 protein expression in formalin-fixed paraffin-embedded (FFPE) breast cancer tissue sections in units of amol/mm².
Materials & Reagents:
- FFPE Tissue Sections: Cut at 4 μm thickness.
- Calibration Cell Line Microarray (CMA): Contains cell lines with HER2 concentrations predetermined by mass spectrometry [19].
- Primary Antibody: Validated anti-HER2 antibody.
- Detection System: Chromogenic detection kit (e.g., HRP-DAB).
- Whole-Slide Scanner: For high-resolution digital imaging.
- Image Analysis Software: For quantitative analysis of stain intensity.
Methodology:
- Sample Preparation: Co-stain a batch of patient FFPE sections and the calibration standard CMA slide.
- Slide Scanning: Digitize all stained slides using a whole-slide scanner at a consistent resolution.
- Image Analysis: Use software to quantify the chromogenic signal intensity in the tumor regions of patient samples.
- Calibration: Generate a standard curve by plotting the known HER2 concentration (amol/mm²) of the calibration cell lines against their measured signal intensities.
- Quantification: Interpolate the signal intensity from the patient's tumor against the standard curve to determine the absolute HER2 concentration.
Data Interpretation: This method transforms subjective scoring (0, 1+, 2+, 3+) into a continuous, objective quantitative measurement, directly addressing the dynamic range limitations of conventional IHC for low-abundance targets [19].
Protocol: Multiplex Immunofluorescence with Cyclic Staining
This protocol outlines the principle behind advanced multiplex IF methods like those used in the ROSIE AI framework [18].
Objective: To simultaneously visualize the expression and spatial distribution of dozens of protein biomarkers in a single FFPE tissue section.
Materials & Reagents:
- FFPE Tissue Sections: Cut at 5-7 μm thickness, slightly thicker than for IHC to preserve tissue [10].
- Antibody Panels: Primary antibodies for multiple targets, validated for IF.
- Fluorophore-Conjugated Secondary Antibodies: Or tyramide signal amplification (TSA) reagents.
- Fluorescence Microscope or Scanner: Equipped with multiple filter sets for different fluorophores.
- CODEX or Similar System: For co-detection by indexing or other cyclic staining platforms [18].
Methodology:
- Staining Cycle 1: Apply a first set of primary antibodies, followed by fluorophore-conjugated secondary antibodies or TSA reaction.
- Imaging: Image the slide to capture the signal from the first set of markers.
- Fluorophore Inactivation: Gently remove or chemically inactivate the fluorophores without damaging the tissue or the antigens.
- Repetition: Repeat steps 1-3 with a new set of antibodies for different targets.
- Image Alignment and Analysis: Computational alignment of all imaging cycles to generate a composite, highly multiplexed image for cell phenotyping and spatial analysis [18].
Data Interpretation: This cyclic approach overcomes the physical limitation of spectral overlap, allowing for the detection of dozens of markers. The resulting data is rich in spatial context, enabling the identification of complex cell phenotypes and their interactions within the tissue microenvironment.
Essential Research Reagent Solutions
The execution of high-quality IHC and IF experiments relies on a suite of key reagents and tools.
Table 2: Key Research Reagent Solutions for IHC and IF
| Reagent / Tool | Function | Considerations for Use |
|---|---|---|
| Validated Primary Antibodies | Specifically binds the target antigen of interest. | Critical to select antibodies validated for the specific application (IHC or IF) and sample type (e.g., FFPE, frozen) [22]. |
| Chromogenic Substrates (DAB, AEC) | Enzyme substrate that produces a colored precipitate in IHC. | DAB provides a permanent, insoluble stain. Requires careful handling as a potential carcinogen. |
| Fluorophores (e.g., FITC, TRITC) | Fluorescent dye that emits light upon excitation in IF. | Prone to photobleaching. Panel design must consider spectral overlap to minimize bleed-through [17]. |
| Calibration Standards | Provides a reference for converting signal intensity to quantitative units. | Essential for quantitative IHC assays (e.g., HER2); enables inter-laboratory reproducibility and analytic rigor [21] [19]. |
| Antigen Retrieval Buffers | Unmasks epitopes cross-linked during formalin fixation. | Citrate and Tris-EDTA are common; optimal buffer and pH are antigen-dependent and require optimization. |
| Image Analysis Software | Quantifies signal intensity, cell counts, and spatial relationships. | For IHC, can outperform pathologist readout in accuracy for quantitative tasks; for IF, enables complex multiplex data deconvolution [21] [18]. |
Visualizing Workflows and Relationships
The following diagrams illustrate the core workflows of IHC and IF, as well as the logical decision process for selecting the appropriate technique.
IHC and IF Core Workflow Comparison
Technique Selection Logic
The technical comparison between IHC and IF reveals a landscape defined by trade-offs. IHC offers permanence, simplicity, and seamless integration into diagnostic workflows, but its utility is constrained by limited multiplexing capability and a subjective, often narrow dynamic range for quantitative applications. IF provides superior sensitivity, a wider effective dynamic range for detecting expression levels, and unparalleled capacity for multiplexing, which is crucial for dissecting complex biological systems, though it requires more sophisticated instrumentation and faces challenges with signal permanence.
The emerging thesis is that the choice between IHC and IF is not about finding a universal "best" technique, but rather about aligning the tool with the question. For diagnostic pathology and archival studies requiring long-term sample stability, IHC remains foundational. For discovery-phase research, spatial biology, and detailed immune profiling, IF and its ultra-high-plex successors are indispensable. The future of protein detection in tissues lies in the continued push towards quantification, standardization, and integration. The development of calibrated IHC assays and computational tools like ROSIE, which can predict protein expression from H&E images, blurs the lines between these techniques, pointing toward a future where the combined strengths of both methods will power a deeper, more quantitative understanding of disease biology [18] [21] [19].
The study of complex tissue microenvironments, particularly in immuno-oncology and drug development, has long been hampered by technological limitations. Traditional immunohistochemistry (IHC), while foundational in pathology, operates within a constrained "one-marker-per-slide" paradigm that provides limited insight into the intricate cellular ecosystems driving disease progression and therapeutic response [8]. The evolution from single-plex assays to multiplexed immunohistochemistry (mIHC) and ultimately to ultra-high-plex immunofluorescence (IF) represents a transformative shift in how researchers visualize, quantify, and understand spatial biology. This progression is fundamentally reshaping biomarker discovery and validation by enabling comprehensive profiling of complex immunophenotypes and spatial relationships within the tumor microenvironment (TME) [3]. The driving thesis behind this technological evolution is that fluorescence-based multiplexing offers superior sensitivity, dynamic range, and multiplexing capacity compared to traditional chromogenic detection, thereby providing previously unattainable insights into disease mechanisms and treatment effects [10] [11]. For researchers and drug development professionals, understanding this evolution is critical for selecting appropriate platforms that balance practical constraints with the necessary biological depth for their specific applications.
Historical Foundations: From Single-Plex IHC to Multiplexed Approaches
The journey toward multiplexed tissue analysis began with foundational techniques that established the core principles of antibody-based antigen detection. Immunofluorescence itself dates to the 1940s, when Albert H. Coons and colleagues developed fluorescein-labeled antibodies to detect pneumococcal antigens in infected tissues [8]. This pioneering work demonstrated the potential of antibody-based detection but remained technically challenging for widespread adoption. Concurrently, the development of enzyme-conjugated antibodies in the 1960s, particularly with horseradish peroxidase (HRP) and alkaline phosphatase (AP), provided more accessible and stable detection methods that became the cornerstone of traditional IHC [11] [8].
The limitations of single-plex assays became increasingly apparent as researchers sought to understand complex biological systems. Traditional IHC, while excellent for detecting single antigens with clear morphological context, proved inadequate for studying cell-cell interactions, heterogeneous cell populations, and complex protein co-expression patterns [17] [10]. The initial breakthrough in multiplexing came with sequential staining approaches that allowed limited detection of 2-3 markers, though these were often hampered by antibody cross-reactivity and signal overlap issues [23]. A significant conceptual advance was the development of tyramide signal amplification (TSA) in the 1990s, which provided the sensitivity and signal confinement necessary for true multiplexed detection by enabling iterative rounds of staining, imaging, and signal inactivation [23]. This technological progression established the foundation for contemporary ultra-high-plex platforms, enabling researchers to move beyond simple marker detection toward comprehensive cellular cartography.
Technical Comparison of Multiplexing Platforms
The landscape of multiplexing technologies spans a continuum from basic chromogenic multiplexing to sophisticated cyclic fluorescence approaches, each with distinct advantages, limitations, and appropriate applications. Understanding these technical differences is essential for selecting the optimal platform for specific research questions.
Table 1: Comparison of Multiplexing Platforms and Their Capabilities
| Platform Type | Max Markers per Section | Detection Chemistry | Imaging Area | Key Applications | Primary Limitations |
|---|---|---|---|---|---|
| Single-Plex IHC | 1-2 | Chromogenic enzymes (HRP/AP + DAB, AEC) | Whole slide | Diagnostic pathology, archival studies | Limited multiplexing; moderate sensitivity [10] |
| Multiplex IHC | 3-5 | Simultaneous/sequential chromogenic without marker removal | Whole slide | Basic cell typing, limited co-localization | Spectral overlap; semi-quantitative [3] [23] |
| Multiplex IF | 5-8 (TSA-based); 30-60 (non-TSA cyclical) | Cyclical stain/stripping, TSA amplification, or DNA barcodes | Up to whole slide | Spatial biology, immune cell interactions | Photobleaching risk; specialized equipment needed [3] [10] |
| MICSSS | 10+ | Iterative immunostaining, scanning, and removal | Whole slide | Deep phenotyping across tissue architectures | Time-intensive; complex protocol optimization [3] |
| Digital Spatial Profiling | 40-50 | UV-cleavable fluorescent DNA tags | ROI (0.28 mm², tiling possible) | Targeted transcriptome/proteome with spatial context | Limited field of view; specialized instrumentation [3] |
The transition from chromogenic to fluorescence-based detection represents a critical inflection point in multiplexing capabilities. Chromogenic IHC, while producing stable, archivable slides compatible with standard brightfield microscopy, faces fundamental limitations in multiplexing capacity due to color spectral overlap and the semi-quantitative nature of optical density measurements [10] [23]. In contrast, fluorescence detection enables superior sensitivity and dynamic range through spectral separation, allowing researchers to distinguish multiple markers simultaneously through discrete emission wavelengths [11]. This fluorescence advantage is further enhanced by signal amplification technologies like TSA, which can improve sensitivity by up to 100-fold compared to conventional methods through covalent, spatially restricted deposition of fluorophores [23]. For ultra-high-plex applications, cyclic approaches that involve repeated rounds of staining, imaging, and fluorophore inactivation or antibody stripping have pushed multiplexing boundaries to 60+ markers on a single tissue section, enabling unprecedented depth in cellular phenotyping and spatial analysis [3] [24].
Figure 1: The Technical Evolution of Multiplexing Platforms
Experimental Protocols and Methodological Considerations
Implementing robust multiplex IF assays requires careful attention to protocol optimization, validation, and quality control across the entire workflow. The following section details key methodological considerations for generating high-quality, reproducible multiplex IF data.
Sample Preparation and Validation
Proper tissue handling begins with appropriate fixation to preserve morphological detail while maintaining antigenicity. Formalin-based fixatives (10% neutral buffered formalin or 4% paraformaldehyde) provide excellent tissue penetration and morphological preservation through methylene cross-links between proteins, though overfixation can mask epitopes and require antigen retrieval [11]. For multiplex IF, tissue sections of 4-5μm thickness are recommended, with careful attention to avoiding folds, tears, or debris during sectioning [24] [10]. Antigen retrieval is particularly critical for formalin-fixed paraffin-embedded (FFPE) tissues, with heat-induced epitope retrieval (HIER) using citrate or Tris-EDTA buffers at pH 6.0 or 9.0 being most common [10] [25]. Validation should include both positive controls (tissues or cell lines with known antigen expression) and negative controls (omission of primary antibody, isotype controls) to establish assay specificity and sensitivity [8] [23]. For ultra-high-plex panels, antibody validation should be performed initially as single-plex stains under the intended experimental conditions to verify specificity, optimal dilution, and subcellular localization before combining into multiplex panels [3] [23].
Staining Protocols for Varying Multiplex Levels
The complexity of staining protocols escalates significantly with increasing plex level, requiring different approaches and quality control measures at each tier.
Table 2: Staining Methodologies Across Multiplexing Levels
| Multiplex Level | Staining Approach | Signal Detection | Key Quality Metrics | Optimal Use Cases |
|---|---|---|---|---|
| Low-Plex (2-4 markers) | Simultaneous primary antibody application | Fluorophore-conjugated secondary antibodies | Signal-to-noise ratio; spectral cross-talk | Basic co-localization studies; diagnostic applications |
| Mid-Plex (5-8 markers) | Sequential staining with gentle stripping | TSA amplification with fluorophores | Batch-to-batch variation; stripping efficiency | Immune cell phenotyping; tumor-stroma interactions |
| High-Plex (10-30 markers) | Iterative cycles of staining/imaging | DNA-barcoded antibodies; fluorophore cycling | Marker intensity stability; registration accuracy | Comprehensive TME mapping; cellular neighborhood analysis |
| Ultra-High-Plex (30-60+ markers) | Automated cyclic staining systems | Oligonucleotide cleavage & detection | Tissue integrity throughout cycles; imaging artifacts | Systems-level biology; biomarker discovery; clinical trial analysis |
For mid-to-high-plex experiments employing TSA, the protocol typically involves: (1) initial antigen retrieval and blocking; (2) application of primary antibody against first target; (3) HRP-conjugated secondary antibody incubation; (4) tyramide-fluorophore conjugation and deposition; (5) antibody stripping via low-pH buffer or heat treatment; and (6) repetition of steps 2-5 for subsequent targets [23]. Each cycle requires rigorous validation to ensure complete antibody removal while preserving tissue integrity and antigenicity for subsequent rounds. For ultra-high-plex approaches using DNA barcoding, the process involves labeling primary antibodies with oligonucleotide barcodes, followed by sequential hybridization with complementary fluorescent reporters across multiple cycles [3]. Throughout all protocols, careful panel design is essential, considering species/isotype compatibility, epitope stability across staining cycles, and fluorophore spectral characteristics to minimize cross-talk [23].
Image Acquisition and Analysis Workflows
Image acquisition for multiplex IF requires specialized instrumentation and standardized approaches to ensure data quality. Whole-slide imaging is increasingly preferred over region of interest (ROI) selection to capture tissue heterogeneity and enable automated hotspot detection, though it demands significant computational resources [3]. For fluorescence-based multiplexing, image acquisition protocols must define appropriate microscope objectives, exposure times for each filter set, and z-stacking parameters if needed [3]. Spectral unmixing is critical for resolving fluorophore emission spectra, particularly when using TSA-based approaches with overlapping emission profiles [3] [23]. Following acquisition, image analysis workflows typically involve: (1) color deconvolution or spectral unmixing to generate individual marker channels; (2) tissue and cell segmentation to identify nuclear, cytoplasmic, and membrane boundaries; (3) phenotyping based on marker expression thresholds; and (4) spatial analysis to quantify cell-cell interactions and organizational patterns [3]. Verification of analysis algorithms is essential, particularly for cell segmentation and phenotyping steps, through comparison with pathologist annotation or other validated methods [3].
Figure 2: Comprehensive Workflow for Multiplex IF Analysis with Quality Control Checkpoints
Quality Control and Artifact Management
The complexity of multiplex IF workflows introduces multiple potential sources of artifacts that can compromise data quality and interpretation. Effective quality control (QC) measures are essential throughout the entire process, from tissue preparation to final analysis. Tissue folds, optical aberrations, and staining artifacts such as antibody aggregates can create discrete clusters in single-cell feature space that obscure true biological signals [24]. Similarly, imaging artifacts including out-of-focus regions, tile stitching errors, and fluorescence bleed-through can significantly impact downstream analysis [3] [24]. In cyclic multiplexing approaches, additional artifacts such as tissue loss between rounds and registration errors from tissue movement must be monitored [24].
Advanced computational tools like CyLinter have been developed specifically to identify and remove data associated with these imaging artifacts [24]. This software operates within the Napari image viewer platform and enables interactive quality control by flagging regions affected by folds, debris, antibody aggregates, and other technical artifacts that dramatically impact single-cell analysis [24]. Implementation of such tools is particularly valuable for archival specimens, which are often more susceptible to artifacts due to prolonged storage [24]. Additional QC measures should include batch-to-batch correction to account for technical variation across different staining runs and verification of cell segmentation algorithms through comparison with manual annotation [3]. These comprehensive quality control approaches are essential for generating robust, reproducible data, particularly in multi-institutional studies where harmonization across platforms and laboratories is challenging [3].
Essential Research Reagent Solutions
Successful implementation of multiplex IF requires careful selection and validation of core reagents that form the foundation of reliable assays. The following table details essential materials and their functions within the multiplex IF workflow.
Table 3: Essential Research Reagents for Multiplex Immunofluorescence
| Reagent Category | Specific Examples | Function | Key Considerations |
|---|---|---|---|
| Primary Antibodies | Recombinant monoclonal antibodies; validated clones | Target antigen recognition | Specificity, lot-to-lot consistency, host species [23] |
| Signal Amplification Reagents | Tyramide conjugates (TSA); polymer systems | Signal enhancement | Sensitivity, spatial resolution, compatibility with multiplex cycles [23] |
| Fluorophores | Alexa Fluor dyes; Cyanine dyes | Signal generation | Spectral properties, brightness, photostability [11] [23] |
| Antigen Retrieval Buffers | Citrate buffer (pH 6.0); Tris-EDTA (pH 9.0) | Epitope unmasking | pH optimization for specific antigens [10] [25] |
| Blocking Reagents | Normal serum; protein blocks; Fab fragments | Reduction of non-specific binding | Compatibility with multiple antibody species [25] |
| Nuclear Counterstains | DAPI; Hoechst stains | Cell segmentation and identification | Spectral separation from marker channels [25] |
| Mounting Media | ProLong Diamond; Vectashield | Slide preservation and signal maintenance | Anti-fade properties; compatibility with imaging [10] |
For ultra-high-plex panels, antibody validation is particularly critical and should include testing on control tissues with known expression patterns, verification of subcellular localization, and assessment of performance under the specific fixation and retrieval conditions to be used in the final assay [23]. Panel design must carefully consider species and isotype compatibility when using secondary detection methods, with optimal panels utilizing primary antibodies from different species to minimize cross-reactivity [23]. For fluorescent detection, fluorophore selection requires attention to spectral overlap, with sufficient separation between emission peaks to enable clear discrimination during imaging and analysis [23]. The emergence of DNA-barcoded antibodies has been particularly transformative for ultra-high-plex applications, as they enable highly multiplexed detection through sequential hybridization approaches while minimizing spectral constraints [3].
Applications and Impact on Biomedical Research
The evolution of multiplexing technologies has opened new frontiers in biomedical research, particularly in immuno-oncology, neuroscience, and inflammatory disease research. In cancer immunotherapy development, multiplex IF has enabled the identification of complex biomarkers that predict treatment response with unprecedented accuracy. For example, quantification of intratumoral CD8+CD39+ cells or the density of CD8+FoxP3+ T cells in non-small cell lung carcinoma has demonstrated area under the curve (AUC) values of approximately 0.8 for predicting response to anti-PD-(L)1 therapies, outperforming traditional single-plex biomarkers like PD-L1 IHC [3]. Similarly, combinatorial biomarkers incorporating multiple cell populations have shown superior predictive value in advanced melanoma [3]. These applications highlight how multiplex IF moves beyond simple cell counting to reveal functional relationships between cell types within the tissue architecture.
The technology has proven equally transformative for understanding disease mechanisms through detailed characterization of the tumor microenvironment (TME). Multiplex IF has enabled categorization of TMEs into distinct geographic "immunotypes" based on the spatial organization and functional orientation of immune cells, providing insights into immune escape mechanisms and potential therapeutic vulnerabilities [3]. In neuroscience, multiplex IF has illuminated complex cell-type interactions in neurodegenerative diseases, while in infectious disease research, it has revealed spatial aspects of host-pathogen interactions [8]. The ability to simultaneously assess immune cell densities, functional marker expression, and spatial distributions within specific tissue compartments (e.g., tumor core vs. invasive margin) provides a systems-level understanding of disease biology that was previously unattainable with sequential single-plex approaches [3] [10]. As these technologies continue to mature, they are increasingly being applied in clinical trial contexts to identify patient subsets most likely to respond to targeted therapies and to understand mechanisms of treatment resistance [24].
Future Perspectives and Concluding Remarks
The evolution from single-plex to ultra-high-plex IF represents a paradigm shift in how researchers approach tissue-based research, moving from reductionist analysis of individual components toward systems-level understanding of cellular ecosystems. This progression has been driven by continuous advances in detection chemistries, imaging platforms, and computational analysis tools that have collectively expanded multiplexing capabilities while improving quantification accuracy and reproducibility. The integration of digital pathology and artificial intelligence represents the next frontier in this evolution, enabling automated interpretation of complex staining patterns and extraction of subtle morphological features that may not be apparent through manual analysis [8]. As these technologies mature, we can anticipate increased standardization and harmonization across platforms, facilitating multi-institutional studies and potentially supporting regulatory decision-making [3].
Despite these advances, challenges remain in making ultra-high-plex technologies accessible to broader research communities, standardizing analytical approaches, and managing the computational demands of whole-slide, high-plex image analysis [3] [24]. The future will likely see continued innovation in both wet-lab methodologies and computational tools, with particular emphasis on integrating multiplex protein detection with transcriptomic and genomic data to create comprehensive molecular portraits of tissue organization and function [24]. For researchers and drug development professionals, understanding this technological evolution is essential for selecting appropriate platforms that balance practical constraints with the necessary biological depth for specific applications. As multiplex IF continues to evolve toward clinical implementation, establishing robust validation frameworks and quality control standards will be paramount for ensuring that these powerful technologies deliver on their promise to transform both basic research and clinical practice.
For researchers in drug development and biomedical sciences, choosing between brightfield and fluorescence microscopy is a critical decision that impacts experimental design, data quality, and resource allocation. This guide provides an objective comparison of both techniques, focusing on their hardware requirements, performance characteristics, and applications in immunohistochemistry (IHC) and immunofluorescence (IF).
Core Technical Specifications
The fundamental differences between brightfield and fluorescence microscopy begin with their basic optical configurations and hardware requirements.
Basic Equipment Requirements for Brightfield and Fluorescence Microscopy
Brightfield Microscopy Equipment
- Light Source: Standard halogen or LED transmitted light source
- Optics: Conventional objectives (e.g., 20x Plan Apochromat), no specialized filters required
- Detector: Standard color CMOS or CCD camera sufficient
- Sample Requirements: Typically requires staining with chromogenic dyes like hematoxylin and eosin (H&E) for contrast [8] [26]
Fluorescence Microscopy Equipment
- Light Source: High-intensity sources (lasers, mercury/xenon arc lamps, or high-power LEDs) with specific wavelengths [27]
- Optics: High numerical aperture (NA) objectives, specialized filter sets (excitation/emission/dichroic) [28] [27]
- Detector: Sensitive detectors (sCMOS cameras, PMTs, or GaSP detectors) with high quantum efficiency [28] [27]
- Sample Requirements: Fluorophore-conjugated antibodies or fluorescent proteins required for specific labeling [11]
Performance Comparison & Experimental Data
Direct comparisons of brightfield and fluorescence microscopy reveal significant differences in their analytical capabilities, particularly for mechanism of action (MoA) studies and cellular analysis.
Table 1: Quantitative Performance Comparison for MoA Prediction
| Performance Metric | Brightfield Microscopy | Fluorescence Microscopy | Experimental Context |
|---|---|---|---|
| MoA Prediction Accuracy | Comparable to fluorescence | Reference standard | Deep learning models predicting 10 MoA classes [29] |
| Cellular Contrast | Low native contrast | High specific contrast | U2OS cells, 48h compound treatment [29] |
| Information Content | Additional temporal information in live cells | Limited by phototoxicity | Brightfield superior for live-cell time-lapse [29] |
| Multiplexing Capacity | Limited | 3-5 targets (IHC), 5-60+ targets (IF) | Dependent on staining approach [3] |
| Phototoxicity | Minimal | Significant concern | Fluorescence dyes can be toxic to cells [29] |
Table 2: Experimental Considerations for Imaging Applications
| Parameter | Brightfield Microscopy | Fluorescence Microscopy |
|---|---|---|
| Live-Cell Compatibility | Excellent | Limited due to phototoxicity and dye cytotoxicity [29] |
| Spatial Resolution | Diffraction-limited | Diffraction-limited, with super-resolution techniques available [28] |
| Cost & Complexity | Lower | Higher (specialized filters, light sources, detectors) [29] [28] |
| Sample Preparation | Simpler | More complex (fixation, permeabilization, staining) [11] |
| Throughput | High | Moderate (potential for photobleaching) [29] |
Experimental Protocols & Methodologies
Brightfield Image Analysis for Cellular Segmentation
Advanced computational approaches can extract meaningful data from brightfield images, despite their inherent low contrast:
- Z-stack Acquisition: Capture multiple focal planes (typically 6-20 z-slices) at regular intervals [30]
- Contrast Enhancement Projection: Calculate variation measures (standard deviation, interquartile range) across z-dimension to create high-contrast 2D projection images [30]
- Automated Segmentation: Use CellProfiler or deep learning models (U-Net) for cell identification and segmentation [29] [30]
- Validation: Compare results with fluorescent whole-cell stains to verify accuracy [30]
Fluorescence Microscopy Standardization Protocol
For quantitative fluorescence imaging, standardization is essential for reproducibility:
- System Calibration: Regular measurement of illumination power using calibrated power meters [28]
- Spatial Resolution Assessment: Use sub-diffraction sized fluorescent beads (100 nm) to determine point-spread function [28]
- Detector Characterization: Evaluate sensitivity, linearity, and signal-to-noise ratio using reference materials [28]
- Reference Materials: Implement fluorescent-patterned glass slides or DNA-origami probes for routine benchmarking [28]
Research Reagent Solutions
Table 3: Essential Reagents for Microscopy Applications
| Reagent/Category | Function | Brightfield Examples | Fluorescence Examples |
|---|---|---|---|
| Nuclear Stains | Identifies cell locations | Hematoxylin [8] | DAPI, Sytox Green, Hoechst stains [26] [30] |
| Cytoplasmic Stains | Visualizes cell boundaries | Eosin Y [8] [26] | Phalloidin (actin stain) [30] |
| Fixation Methods | Preserves tissue architecture | Formalin, paraformaldehyde [11] | Formaldehyde, methanol [11] |
| Mounting Media | Preserves samples for imaging | Aqueous mounting media | Anti-fade reagents (Prolong Diamond) [27] |
| Antibody Types | Target-specific detection | Enzyme-conjugated (HRP) [8] | Fluorophore-conjugated (Alexa Fluor dyes) [11] |
Advanced Applications & Workflow Integration
The choice between brightfield and fluorescence microscopy often depends on the specific research application and experimental workflow.
Decision Workflow for Microscope Selection Based on Research Application
Brightfield Dominant Applications
- Live-Cell Time-Lapse Experiments: Superior for extended imaging due to minimal phototoxicity [29]
- 3D Histology: Combined with tissue clearing techniques for volumetric analysis of large specimens [26]
- Virtual Staining: Machine learning approaches to predict fluorescent patterns from brightfield images [31] [32]
Fluorescence Dominant Applications
- Multiplexed Target Detection: Simultaneous visualization of multiple cellular targets using spectral separation [3] [11]
- Super-Resolution Imaging: Techniques such as STED and SIM that overcome diffraction limits [28]
- Dynamic Process Tracking: Real-time monitoring of molecular interactions and organelle dynamics [32]
Both brightfield and fluorescence microscopy offer distinct advantages for different research scenarios. Brightfield microscopy provides a cost-effective, live-cell compatible solution that, when enhanced with computational tools, can achieve performance comparable to fluorescence for applications like MoA prediction [29]. Fluorescence microscopy remains essential for high-specificity multiplexed detection and subcellular localization studies, despite its higher complexity and potential phototoxicity [29] [28]. The emerging trend of combining both modalities, using brightfield for primary imaging and fluorescence for validation or specific targeting, represents a powerful approach that maximizes the strengths of both techniques while mitigating their respective limitations [31] [32].
Strategic Applications: Choosing IHC or IF for Diagnostics and Complex Research
Immunohistochemistry (IHC) remains a cornerstone technique in clinical diagnostics, providing critical insights into disease biology by visualizing protein expression within the context of intact tissue architecture. This guide objectively compares IHC's performance against immunofluorescence (IF) and other alternatives, supported by experimental data and validation protocols relevant to researchers and drug development professionals.
Technique Comparison: IHC vs. Immunofluorescence (IF)
The choice between IHC and IF is fundamental and depends on the experimental or diagnostic goals. The core difference lies in their detection methods: IHC uses enzymes to produce a stable, colored precipitate, while IF uses fluorescent dyes that emit light at specific wavelengths [17] [33] [25].
Table: Core Technical and Operational Comparison of IHC and IF.
| Parameter | Immunohistochemistry (IHC) | Immunofluorescence (IF) |
|---|---|---|
| Detection Chemistry | Chromogenic enzymes (e.g., HRP/AP with DAB) [10] [25] | Fluorophores (e.g., FITC, TRITC) [33] [10] |
| Detection Microscope | Brightfield microscope [10] | Fluorescence microscope [33] [10] |
| Signal Duration | Permanent and archivable [17] [10] | Temporary; subject to photobleaching [17] [33] |
| Multiplexing Capacity | Limited, typically 1-2 markers [10] | High; traditional IF (2-8 markers), ultra-high-plex IF (10-60 markers) [10] |
| Resolution | Lower resolution for fine structures [33] | High resolution, ideal for subcellular localization [17] [33] |
| Best Applications | Diagnostic pathology, regulatory archiving, crisp morphology review [17] [10] | Spatial biology, co-localization studies, tumor microenvironment analysis [17] [10] |
Experimental Data and Validation Protocols
Robust validation is paramount for deploying IHC in clinical trials and diagnostics. The following data and methodologies illustrate the rigorous processes involved.
Clinical-Grade IHC Assay Validation (NCI-MATCH Trial)
The NCI-MATCH (EAY131) trial established a comprehensive validation framework for therapy-guiding IHC assays [34]. The multi-step protocol ensures analytical validity and reproducibility.
- Primary Antibody Selection: The process begins with a thorough understanding of the target protein and its gene. Antibodies are selected based on peer-reviewed data demonstrating sensitivity and specificity, with preference for commercial vendors adhering to Good Manufacturing Practices to ensure supply continuity and minimal lot-to-lot variation [34].
- Assay Optimization: This step determines the optimal antibody dilution, antigen retrieval conditions (e.g., pH of retrieval solution), and incubation time. The goal is to find the combination that produces the optimal signal-to-noise ratio, often using automated staining platforms for consistency [34].
- Interpretation Criteria and Reporting: Validation includes defining precise interpretation guidelines incorporating biological expectations (e.g., nuclear vs. cytoplasmic staining). To avoid ambiguity, results are reported descriptively (e.g., "loss of expression" or "retained expression" for tumor suppressors like PTEN) rather than simply "positive" or "negative" [34].
Table: Validated Assay Conditions from the NCI-MATCH Trial. [34]
| Biomarker | Clone | Host | Vendor | Dilution |
|---|---|---|---|---|
| PTEN | 6H2.1 | Mouse | Dako | 1:100 |
| RB | LM95.1 | Mouse | EMD Millipore/Calbiochem | 1:30 |
| MLH1 | G168-728 | Mouse | Millipore Sigma/Cell Marque | 1:300 |
| MSH2 | FE11 | Mouse | EMD Millipore/Calbiochem | 1:100 |
Calibration for Reproducibility (CASI-01 Study)
A major challenge in IHC, particularly for low-abundance targets like HER2-low in breast cancer, is inter-laboratory variability. The international CASI-01 study demonstrated that calibration using reference standards dramatically improves accuracy and reproducibility. The study found that without calibration, HER2 assay results were highly variable, but calibrated IHC enhanced test reliability and analytical sensitivity, ensuring patients eligible for targeted therapies are correctly identified [21].
AI-Powered IHC Prediction from H&E Stains
Emerging deep learning models can predict IHC biomarker status directly from hematoxylin and eosin (H&E)-stained whole slide images (WSIs), offering a faster and less tissue-consuming alternative. One study developed models for five IHC biomarkers (P40, Pan-CK, Desmin, P53, Ki-67) in gastrointestinal cancers [35].
- Methodology: An automated pipeline, HEMnet, was used to align IHC and H&E WSIs from the same tissue block, transferring IHC labels to the H&E images. A semi-supervised deep learning model (Mean Teacher framework with a ResNet-50 backbone) was then trained on 415,463 tiles extracted from 134 WSIs to predict IHC positivity [35].
- Performance Data: The models achieved high accuracy, demonstrating the potential of AI as an assistive tool in diagnostics [35].
Table: Performance of Deep Learning Models for IHC Biomarker Prediction. [35]
| Biomarker | Area Under the Curve (AUC) | Accuracy |
|---|---|---|
| P40 | 0.96 | 90.81% |
| Pan-CK | 0.90 | 83.64% |
| Desmin | 0.93 | 83.04% |
| P53 | 0.95 | 86.84% |
| Ki-67 | 0.94 | 85.07% |
Another AI framework, DuoHistoNet, which integrates both H&E and IHC WSIs, achieved an AUROC exceeding 0.97 for predicting MSI/MMRd status in colorectal cancer and 0.96 for PD-L1 status in breast cancer. The model's predictions were superior to PD-L1 IHC alone in stratifying patients with improved outcomes on pembrolizumab immunotherapy [36].
The Scientist's Toolkit: Key Reagent Solutions
Successful IHC experimentation relies on a suite of critical reagents, each with a specific function.
Table: Essential Reagents for IHC Experiments.
| Reagent / Material | Function | Key Considerations |
|---|---|---|
| Primary Antibody | Binds specifically to the target antigen of interest. | Monoclonal vs. polyclonal; vendor reliability; validation for IHC on FFPE tissue [34]. |
| Secondary Antibody (conjugated) | Binds to the primary antibody, carrying the detection label. Amplifies signal. | Host species must be against the host of the primary antibody; conjugated with enzyme or fluorophore [33]. |
| Chromogenic Substrate (e.g., DAB) | Enzyme (e.g., HRP) converts this substrate into an insoluble, colored precipitate at the antigen site. | Provides a permanent stain; choice impacts contrast and stability [10] [25]. |
| Antigen Retrieval Buffer | Reverses formaldehyde-induced cross-links, "unmasking" epitopes for antibody binding. | Critical for FFPE tissue; choice of citrate vs. Tris-EDTA buffer depends on the antibody [10] [25]. |
| Blocking Serum | Reduces nonspecific background staining by occupying reactive sites on the tissue. | Typically a normal serum from the same species as the secondary antibody [33]. |
IHC Workflow and HER2 Signaling
The following diagram illustrates the key steps in a standard indirect IHC protocol, from sample preparation to imaging.
IHC is crucial for assessing signaling pathways in cancer. The HER2/PI3K/AKT pathway is a prime example where IHC analysis directly impacts treatment decisions.
IHC maintains a vital role in clinical diagnostics and biomarker validation due to its permanence, compatibility with routine pathology workflows, and crisp morphological context. For studies requiring high-plex analysis and superior resolution for co-localization, IF is the more powerful technique. The ongoing integration of rigorous calibration standards and artificial intelligence promises to further enhance the precision, reproducibility, and analytical depth of IHC, solidifying its role in the era of precision medicine.
The tumor immune microenvironment (TIME) is a dynamic, multifaceted ecosystem composed of tumor cells, diverse immune populations—including tumor-infiltrating lymphocytes (TILs), macrophages, and dendritic cells—as well as non-immune stromal components that work together to modulate anti-tumor immunity [37]. The spatial distribution and complex interactions between these cellular components critically influence cancer progression, immune evasion, and response to therapy. Immunofluorescence (IF) has emerged as a pivotal technique for spatial biology, enabling researchers to visualize and quantify these intricate relationships within their native architectural context. This guide objectively compares IF with immunohistochemistry (IHC) for studying the TIME, providing experimental data and methodologies to inform technique selection for cancer research and drug development.
Technical Comparison: IHC vs. IF
Core Principles and Detection Chemistry
Immunohistochemistry (IHC) relies on antibody-epitope interactions to detect proteins in tissue sections, visualized through enzyme-conjugated antibodies (e.g., HRP or AP) that generate colored precipitates at the reaction site when exposed to specific substrates like DAB or AEC [11] [25]. This chromogenic detection produces permanent stains viewable under a standard brightfield microscope.
Immunofluorescence (IF) also uses antibody-antigen binding but employs fluorophore-conjugated antibodies that emit light at specific wavelengths when excited by appropriate light sources [17] [11]. Detection requires specialized fluorescence microscopy, but enables superior multiplexing capabilities through simultaneous use of multiple fluorophores with non-overlapping emission spectra.
Performance Characteristics and Applications
Table 1: Technical comparison between IHC, traditional IF, and ultra-high-plex IF
| Feature | IHC | IF (2–8-plex) | Ultra-high-plex IF (10–60 plex) |
|---|---|---|---|
| Detection Chemistry | Chromogenic enzyme (HRP/AP + DAB, AEC) | Direct or secondary fluorophores | Repeated dye cycles with color separation software |
| Max Markers/Slide | 1–2 markers | 2–8 markers | 10–60 (e.g., Akoya PhenoFusion platform) |
| Signal Stability | Permanent, archivable | Moderate (photobleaching risk) | Moderate (software-corrected) |
| Sensitivity / Dynamic Range | Moderate | High | Very high |
| Equipment Needed | Brightfield microscope | Fluorescence microscope | Advanced scanner + AI analytics |
| Best Application | Diagnostic workflows, GLP archiving | Spatial biology, co-localization | Tumor microenvironment & complex panels |
| Typical Turnaround | 3–5 days | 5–7 days | 7–10 days |
Table 2: Practical considerations for technique selection
| Parameter | IHC | IF |
|---|---|---|
| Archivable | Yes | Limited (digital archive recommended) |
| Co-localization | Limited | Excellent |
| Cost/Complexity | – | |
| Multiplexing Capacity | Low | High |
| Resolution | Moderate | High |
IF Applications in Tumor Microenvironment Research
Mapping Intratumoral Heterogeneity
IF enables detailed spatial analysis of immune cell distribution across different tumor regions. A landmark study in oesophageal squamous cell carcinoma (ESCC) demonstrated this capability by examining CD8+ T cells, PD-1+ T cells, and PD-L1 expression across three distinct intratumoral locations: surface (Surf), center (Cent), and invasive front (Inv) [38]. The research revealed significant spatial heterogeneity in PD-L1 expression rates, with lower positivity at the invasive front (12.0%) compared to the tumor center (18.2%, P = 0.012) [38]. Furthermore, high CD8+ and PD-1+ T cell densities correlated with better overall survival specifically in Surf and Cent regions, but not in Inv areas, highlighting the critical importance of spatial context in prognostic biomarker evaluation [38].
Figure 1: Spatial Heterogeneity in Tumor Immune Microenvironment. Immune marker expression (CD8, PD-1, PD-L1) varies significantly across tumor regions, with differential impact on overall survival (OS).
Analyzing Immune Checkpoint Biomarkers
IF multiplexing provides unique capabilities for simultaneous evaluation of multiple immunotherapy targets. Research comparing the tumor immune microenvironments between stage III and IV non-small cell lung cancer (NSCLC) demonstrated strong correlation between PD-L1 protein detection by IHC and CD274 gene expression (n = 295, P < 2.2e-16, ⍴ = 0.74) [39]. The study also revealed stage-specific differences, with CTLA4 expression significantly increased in stage III tumors (P = 1.32e-04), while stage IV tumors showed enhanced metabolic pathway activity and increased macrophage infiltration (P = 0.0214) [39]. Such multidimensional analyses are ideally suited for multiplex IF, which can simultaneously detect PD-L1, CTLA4, and macrophage markers alongside metabolic readouts.
Advanced Multiplexing for Cellular Neighborhoods
Ultra-high-plex IF platforms enable unprecedented dissection of cellular communities within the TIME. Technologies like Akoya's PhenoCycler-Fusion can simultaneously detect 10-60 protein markers on a single tissue section [10]. This capability allows researchers to identify specialized cellular neighborhoods and interaction networks between tumor cells, immune populations, and stromal components—revealing how specific spatial arrangements correlate with treatment response and patient outcomes.
Experimental Protocols for TIME Analysis
Standard Multiplex IF Workflow
Figure 2: Standard Multiplex IF Workflow. Key steps from tissue preparation to image analysis.
Sample Preparation Protocol:
- Fixation: Use 4% paraformaldehyde (PFA) for optimal tissue preservation and antigen retention [11]. Perfusion fixation is preferred for animal tissues, while immersion fixation suffices for human biopsies.
- Sectioning: Cut tissue sections at 5-7 µm thickness for IF (slightly thicker than standard IHC sections) to preserve tissue architecture during multiple staining cycles [10].
- Antigen Retrieval: Perform heat-induced epitope retrieval (HIER) using citrate (pH 6.0) or Tris-EDTA (pH 9.0) buffer, optimized for each antibody target [11] [25].
- Blocking: Incubate with 2-5% normal serum from secondary antibody host species, supplemented with 1% BSA and 0.1% Triton X-100 for 1 hour at room temperature [11].
Staining Protocol:
- Primary Antibodies: Incubate with carefully titrated antibody cocktails for 1-2 hours at room temperature or overnight at 4°C. Include negative controls without primary antibodies [10].
- Secondary Detection: Apply species-specific fluorophore-conjugated secondary antibodies for 1 hour at room temperature, protected from light. For multiplexing, use cross-adsorbed secondaries to minimize cross-reactivity [25].
- Counterstaining: Include DAPI (0.5-1 µg/mL) for nuclear visualization.
- Mounting: Use commercial antifade mounting media to reduce photobleaching. Seal edges with clear nail polish.
Validation and Quality Control
Antibody Validation: Validate all antibodies for IF applications using appropriate controls, including knockout tissues or cell lines when available. Compare staining patterns with established markers and published literature [10].
Image Acquisition: Acquire images using consistent exposure settings across compared samples. For quantitative comparisons, include reference standards for fluorescence intensity calibration. Use confocal microscopy for superior optical sectioning or slide scanners for whole-slide analysis.
Analysis Pipeline: Employ automated image analysis platforms (e.g., Visiopharm, HALO) for objective quantification. Segment tissue into relevant compartments (tumor parenchyma, stroma, invasive margin) and quantify marker expression within each region.
Research Reagent Solutions
Table 3: Essential research reagents for IF-based spatial biology
| Reagent Category | Specific Examples | Function | Application Notes |
|---|---|---|---|
| Fixatives | 4% Paraformaldehyde, 10% Neutral Buffered Formalin | Preserve tissue architecture and antigenicity | PFA preferred for IF; avoid over-fixation [11] |
| Antigen Retrieval Reagents | Citrate Buffer (pH 6.0), Tris-EDTA (pH 9.0) | Restore antigen accessibility | pH optimization critical for different epitopes [25] |
| Blocking Reagents | Normal Serum, BSA, Triton X-100 | Reduce non-specific antibody binding | Use serum from secondary antibody host species [11] |
| Primary Antibodies | Anti-CD8, Anti-PD-L1, Anti-CK, Anti-CD68 | Target protein detection | Validate for IF on specific tissue types [38] |
| Fluorophore-conjugated Secondaries | Alexa Fluor 488, 555, 647, NorthernLights | Signal amplification and detection | Select non-overlapping emission spectra [25] |
| Nuclear Counterstains | DAPI, Hoechst stains | Nuclear visualization | Essential for cellular segmentation |
| Mounting Media | ProLong Gold, Vectashield with DAPI | Preserve fluorescence and reduce bleaching | Antifade compounds extend signal longevity [17] |
| Automation Platforms | Leica Bond RX, Akoya PhenoCycler-Fusion | Standardized staining | Essential for reproducible high-plex workflows [10] |
Emerging Technologies and Future Directions
Artificial Intelligence and Deep Learning
AI-based approaches are revolutionizing IF image analysis. Recent developments include deep learning models that can predict IHC biomarker expression directly from H&E-stained whole slide images, achieving AUCs between 0.90-0.96 for markers including P40, Pan-CK, Desmin, P53, and Ki-67 [40]. In validation studies, these AI-generated IHC results showed substantial concordance with conventional IHC across most markers, supporting their potential as assistive tools in diagnostic workflows [40].
Standardization Initiatives
The Consortium for Analytic Standardization in Immunohistochemistry (CASI) addresses critical assay validation needs, as demonstrated in their CASI-01 study focusing on HER2-low testing [41]. This research highlighted how conventional IHC assays, while accurate for determining HER2 overexpression (3+), exhibited poor dynamic range for detecting HER2-low expression—a limitation overcome by enhanced analytic sensitivity IHC assays combined with image analysis, which achieved a six-fold improvement (p = 0.0017) [41]. Similar standardization efforts are emerging for multiplex IF to ensure reproducible, clinically actionable results.
Integrated Spatial Omics
The future of TIME analysis lies in integrating multiplex IF with spatial transcriptomics and proteomics. This multi-modal approach can simultaneously characterize protein localization, gene expression, and cellular metabolism within preserved tissue architecture, providing unprecedented insights into the functional states of immune cells in their native microenvironmental context.
In the fields of immuno-oncology, neuroscience, and drug development, understanding the complex composition and spatial organization of cells within their native tissue microenvironment is paramount. Conventional immunohistochemistry (IHC), long considered a gold standard, is fundamentally limited by its capacity to visualize only one or two biomarkers on a single tissue section [42] [8]. This represents a significant drawback in an era of personalized medicine, where stratifying patients and predicting responses to therapies like immune checkpoint inhibitors often requires analyzing multiple cell populations and their functional states simultaneously [42]. The limited multiplexing capacity of traditional IHC is particularly problematic when tissue is scarce, such as with core biopsies, potentially causing patients to miss opportunities to benefit from targeted treatments [42].
Multiplex Immunofluorescence (mIF) has emerged as a transformative technology that overcomes these limitations. By enabling the simultaneous detection of numerous biomarkers on a single tissue section, mIF provides a high-resolution, quantitative view of the tumor immune microenvironment (TIME) and other complex biological systems [42] [23]. This capability allows researchers to perform deep co-localization studies—precisely determining where multiple proteins are located in relation to each other within and between cells—and to conduct complex cell phenotyping, identifying rare immune cell subsets and their functional states based on combinatorial marker expression [43] [3]. The power of multiplexing lies not only in detecting multiple markers but also in preserving the precious spatial relationships between cells, which is critical for understanding cell-cell interactions, immune cell exclusion, and the functional architecture of tissues [43]. This guide objectively explores the multiplexing power of IF, comparing its performance with other methodologies and detailing the experimental protocols that make advanced spatial analysis possible.
Technical Comparison: mIF Versus Alternative Multiplexing Techniques
The landscape of multiplexed tissue imaging has diversified significantly, with several platforms now available. The choice of technology involves trade-offs between plex level, spatial resolution, equipment needs, and data complexity. The table below provides a structured comparison of the primary multiplexing techniques used in research and clinical applications.
Table: Comparison of Multiplex Tissue Imaging Technologies
| Technology | Maximum Plex Capacity | Detection Chemistry | Spatial Resolution & Data Output | Key Applications & Strengths |
|---|---|---|---|---|
| Conventional IHC [10] | 1-2 markers | Chromogenic enzymes (HRP/AP) | Brightfield microscopy; subjective, semi-quantitative analysis | Diagnostic pathology, morphological assessment |
| Multiplex IHC (mIHC) [3] | 3-5 markers | Sequential chromogenic reactions | Whole-slide brightfield imaging; limited quantitative capacity | Visualizing multiple cell lineages with standard equipment |
| Multiplex IF (mIF) - Fluorescence-Based [23] [10] | 5-8 markers (TSA-based); 30-60 (cyclic) | Fluorophores, Tyramide Signal Amplification (TSA) | High-resolution fluorescence imaging; quantitative, single-cell data | Co-localization, spatial biology, immune cell phenotyping |
| Multiplexed IHC Consecutive Staining (MICSSS) [3] | 10+ markers | Iterative chromogenic staining and stripping | Whole-slide brightfield imaging; quantitative data from serial scans | High-plex imaging on brightfield platforms |
| Imaging Mass Cytometry (IMC) [43] [3] | ~40 markers | Antibodies tagged with elemental metal reporters | Mass spectrometry imaging; highly quantitative, subcellular resolution | Deep phenotyping without spectral overlap, high-dimensional analysis |
| Digital Spatial Profiling (DSP) [3] | 40-50 markers | UV-cleavable fluorescent DNA tags | Region-of-Interest (ROI) analysis; numerical count data | Targeted profiling of pre-defined tissue compartments |
Analysis of Comparative Performance
The data reveals a clear trade-off between the familiarity and permanence of chromogenic methods and the high-plex, quantitative nature of fluorescence and mass-based detection. Conventional IHC remains sufficient for simple, diagnostic questions requiring 1-2 markers [10]. However, for research questions centered on complex cell phenotyping and co-localization—such as characterizing the spatial organization of immune cells in the TIME—mIF and IMC offer superior capabilities.
The high plex capacity of mIF (exceeding 60 markers with some cyclic platforms) directly enables the identification of complex cell phenotypes. For instance, distinguishing a cytotoxic T-cell (CD3+, CD8+), an exhausted T-cell (CD3+, CD8+, PD-1+), and a regulatory T-cell (CD3+, CD4+, FOXP3+) requires at least 5-6 markers, which is only feasible with multiplexed approaches [42] [3]. Furthermore, fluorescence-based detection provides a wider dynamic range and higher sensitivity compared to chromogenic methods, allowing for better detection of low-abundance targets [23] [10]. Technologies like IMC and DSP circumvent the issue of fluorescence spectral overlap and photobleaching, with IMC offering the unique advantage of virtually no background autofluorescence [43] [3]. However, mIF remains the most accessible high-plex technology for most laboratories, with protocols like Tyramide Signal Amplification (TSA) providing robust signal amplification for detecting challenging targets [23].
Experimental Protocols for Key mIF Applications
Workflow for Sequential mIF with Tyramide Signal Amplification
The TSA-based mIF protocol is a widely adopted method for achieving high-plex capability on standard fluorescence scanners. Its robustness stems from the covalent deposition of fluorophores, which allows for antibody stripping without signal loss.
Table: Key Reagent Solutions for TSA-based mIF
| Reagent/Material | Function | Key Considerations |
|---|---|---|
| Formalin-Fixed Paraffin-Embedded (FFPE) Tissue Sections (4-5 µm) [10] | Standard tissue substrate for analysis | Thinner sections (4 µm) preferred for IHC; slightly thicker (5-7 µm) can benefit mIF. |
| Primary Antibodies [23] | Bind specifically to target antigens | Rigorous validation for IHC/IF on FFPE tissue is critical. Recombinant monoclonal antibodies ensure lot-to-lot consistency. |
| Tyramide Signal Amplification (TSA) Reagents [23] | Provide extreme signal amplification | Fluorophore-conjugated tyramides are activated by HRP, leading to covalent deposition and permanent tissue labeling. |
| HRP-Conjugated Secondary Antibodies [23] | Bind to primary antibodies and catalyze TSA reaction | Species-specific; the HRP enzyme activates the tyramide substrate. |
| Antigen Retrieval Buffers (e.g., Citrate, Tris-EDTA) [10] | Unmask epitopes cross-linked by formalin fixation | Buffer choice and heating method (water bath, pressure cooker, steamer) require optimization for each antibody. |
| Antibody Stripping Buffer [23] | Removes primary/secondary antibodies after each round | Must be harsh enough to remove antibodies but gentle enough to preserve TSA signal and tissue morphology. |
Detailed Stepwise Protocol:
- Tissue Preparation and Deparaffinization: Cut FFPE tissue sections at a thickness of 5 µm. Bake slides, then deparaffinize and rehydrate through a series of xylene and graded ethanol washes [23] [8].
- Antigen Retrieval: Perform heat-induced epitope retrieval (HIER) using a validated buffer (e.g., citrate pH 6.0 or Tris-EDTA pH 9.0) and an appropriate heating method. Allow the slides to cool slowly to room temperature [8].
- Blocking: Block endogenous peroxidases and phosphatases. Incubate the tissue with a protein block (e.g., serum or BSA) to reduce non-specific antibody binding [23].
- Primary Antibody Incubation: Apply the first primary antibody, optimized to the correct dilution in antibody diluent. Incubate according to validated conditions (time and temperature) [23].
- TSA Detection: Apply the corresponding HRP-conjugated secondary antibody. Then, incubate with the fluorophore-conjugated tyramide working solution. The HRP catalyzes the covalent deposition of the tyramide-fluorophore complex at the site of the antigen [23].
- Antibody Stripping: After image acquisition for this marker, apply a stripping buffer (e.g., a solution containing SDS and β-mercaptoethanol) to remove the primary and secondary antibody complexes. The covalently bound tyramide signal remains intact [23].
- Iterative Staining: Repeat steps 4 through 6 for each subsequent marker in the panel. The order of antibodies must be optimized, with sensitive or critical markers stained early in the cycle.
- Counterstaining and Mounting: After the final cycle, apply a nuclear counterstain (e.g., DAPI) and mount the slides with an anti-fade mounting medium [10].
- Image Acquisition: Scan the slide using a high-resolution fluorescence slide scanner, capturing each channel with specific exposure times to avoid signal saturation [3].
TSA mIF Workflow: This diagram illustrates the cyclical staining, imaging, and stripping process of Tyramide Signal Amplification (TSA)-based multiplex immunofluorescence, enabling high-plex analysis on a single tissue section.
Computational Analysis Pipeline for Phenotyping and Spatial Analysis
The raw image data generated by mIF requires sophisticated computational pipelines for single-cell analysis and spatial quantification. The TRACERx-PHLEX pipeline provides a robust, modular framework for this purpose [43].
Detailed Stepwise Protocol:
- Image Pre-processing and Unmixing: Acquired multispectral images undergo color deconvolution (for brightfield mIHC) or spectral unmixing (for fluorescence mIF) to separate the signal of individual markers from autofluorescence and correct for spectral overlap [3].
- Cell Segmentation: This critical step defines the boundaries of individual cells. A common and accurate approach uses a deep learning model (e.g., a U-Net++) trained on a large, manually annotated dataset to identify nuclei. The nuclear mask is then expanded or used as a seed for a secondary algorithm (e.g., in CellProfiler) to define the whole-cell boundary using membrane or cytoplasmic markers [43].
- Cell Phenotyping: A cell-by-marker intensity matrix is extracted from the segmentation masks. Automated cell-type annotation (e.g., using the TYPEx module) then assigns a cell subtype to each cell based on a user-provided definition file (e.g., "CD3+CD8+FOXP3-" = Cytotoxic T-cell). This step often involves a probabilistic model to stratify cells by major lineage and a statistical method to call marker positivity [43].
- Spatial Analysis: With cells identified and phenotyped, spatial metrics can be calculated. This includes simple metrics like cell densities within tissue compartments (tumor vs. stroma) and complex relational metrics, such as measuring the minimum distance between different cell types or calculating "cellular barrier scores" that quantify the occlusion of tumor cells by stromal cells [43].
mIF Data Analysis Pipeline: This linear workflow outlines the key computational steps to transform raw multiplex images into quantitative, single-cell spatial data.
Supporting Experimental Data and Validation
The clinical and research utility of mIF is underscored by its ability to generate predictive biomarkers with high accuracy. For instance, in the context of cancer immunotherapy, a meta-analysis showed that mIF/IHC assays had an area under the curve (AUC) on the order of 0.8 for predicting response to anti-PD-1/PD-L1 therapies, outperforming other modalities like PD-L1 IHC alone or gene expression signatures (AUC ~0.65-0.7) [3]. An AUC of 0.8 is a benchmark associated with potential companion diagnostics.
Specific biomarker examples validated by mIF include:
- The density of CD8+CD39+ T cells within the tumor parenchyma predicted response in non-small cell lung carcinoma (NSCLC) patients [3].
- The ratio of CD8+FoxP3+ T-cell densities served as a predictive biomarker in NSCLC [3].
- A combinatorial biomarker incorporating the densities of CD8+FoxP3+PD-1low/mid+ and CD163+PD-L1− cells was predictive in patients with advanced melanoma [3].
From a technical validation perspective, the reproducibility of computational pipelines is critical. The Pixie pipeline, which performs pixel-level clustering, introduced a "cluster consistency score" to quantify reproducibility across different random initializations of its algorithm. An analysis of a lymph node dataset demonstrated a strong overall cluster consistency score of 2.07 ± 0.32, indicating that pixel assignments were largely stable across replicate runs [44]. This highlights the maturity and robustness of modern mIF analysis workflows.
Multiplex Immunofluorescence represents a significant leap forward in spatial biology, offering unparalleled power for co-localization studies and complex cell phenotyping. When compared to conventional IHC and other multiplexing techniques, mIF provides a superior combination of high plex capacity, quantitative sensitivity, and spatial resolution. The experimental protocols, centered on TSA and iterative staining, are well-established and can be robustly implemented to profile the tumor immune microenvironment and other complex tissues. The resulting high-dimensional data, when processed through standardized computational pipelines like TRACERx-PHLEX [43], yields biologically and clinically actionable insights, such as predictive biomarkers for immunotherapy. As the field moves towards clinical translation, the standardization of staining, analysis, and data-sharing guidelines, as championed by organizations like the Society for Immunotherapy of Cancer [3], will be crucial. For researchers and drug developers aiming to decipher cellular complexity in situ, mIF is an indispensable tool that provides a deep, data-rich view of disease biology.
In the realm of biomedical research and diagnostic pathology, the visualization of proteins within their native tissue context is paramount. Immunohistochemistry (IHC) and Immunofluorescence (IF) are two cornerstone techniques that enable this visualization, each with distinct methodological approaches and applications. While both techniques leverage the specific binding of antibodies to target antigens, their detection chemistries—chromogenic for IHC and fluorescent for IF—fundamentally shape their workflows, capabilities, and ideal use cases [17]. This guide provides an objective comparison of the typical project timelines and procedural workflows for IHC and IF, offering researchers a practical framework for selecting the appropriate technique based on experimental goals, resource constraints, and required turnaround.
Core Principles and Detection Chemistry
The primary distinction between IHC and IF lies in their detection and visualization methods. IHC uses antibodies conjugated to enzymes (such as Horseradish Peroxidase - HRP or Alkaline Phosphatase - AP). When a substrate is added, these enzymes produce a colored, insoluble precipitate that is visible under a standard brightfield microscope [17] [10]. The resulting slides are permanent and can be archived for many years, which is a significant advantage for diagnostic pathology and regulatory submissions [10].
In contrast, IF uses antibodies directly conjugated to fluorophores or detected by fluorophore-labeled secondary antibodies. These fluorophores emit light of a specific wavelength upon excitation by light of a shorter wavelength, creating a signal that is captured using a fluorescence microscope [17] [2]. This approach allows for superior multiplexing, enabling the simultaneous detection of multiple targets (typically 2-8, and up to 60 with specialized platforms) on a single slide [10].
The following table summarizes the key characteristics stemming from these different detection chemistries.
Table 1: Fundamental Differences Between IHC and IF
| Parameter | Immunohistochemistry (IHC) | Immunofluorescence (IF) |
|---|---|---|
| Detection Chemistry | Enzyme-based (e.g., HRP/AP) with chromogenic substrates [10] | Fluorophore-conjugated antibodies [2] |
| Visualization | Brightfield microscope [10] | Fluorescence microscope [17] [10] |
| Signal Output | Colored precipitate (e.g., brown, red) [45] | Light emission at specific wavelengths [2] |
| Multiplexing Capacity | Limited (typically 1-2 markers per slide) [10] | High (2-8 markers; up to 60 with ultra-high-plex) [10] |
| Signal Stability | Permanent, archivable for years [17] [10] | Moderate; susceptible to photobleaching [17] [10] |
| Primary Applications | Diagnostic pathology, research with crisp morphology [17] [10] | Spatial biology, co-localization studies, multiplexed target analysis [17] [10] |
Comparative Workflow Analysis
The workflows for IHC and IF share several foundational steps but diverge in key areas related to detection and imaging. A thorough understanding of each step is critical for planning and accurately forecasting project timelines.
Shared Initial Steps
The initial stages of tissue preparation are largely identical for both techniques and constitute a significant portion of the pre-analytical phase.
- Tissue Preparation: Tissue samples are fixed, most commonly in formalin, to preserve structure and prevent degradation [45] [46]. They are then embedded in a supporting medium—paraffin for formalin-fixed paraffin-embedded (FFPE) blocks or OCT compound for frozen tissues—and sectioned into thin slices (typically 4-5 µm for IHC, 5-7 µm for IF) using a microtome or cryostat [45] [10] [46].
- Deparaffinization/Rehydration: For FFPE tissues, the paraffin wax must be removed with xylene, and the sections are rehydrated through a series of ethanol washes to prepare for aqueous solutions [45] [2].
- Antigen Retrieval: Formalin fixation can mask target epitopes through protein cross-linking. To restore antibody binding, a retrieval step is performed. This is typically done using Heat-Induced Epitope Retrieval (HIER), where slides are heated in a buffer (e.g., citrate or Tris-EDTA), or less commonly, Protease-Induced Epitope Retrieval (PIER) [45] [46] [2].
- Blocking: To minimize non-specific antibody binding, tissue sections are incubated with a blocking agent such as bovine serum albumin (BSA), normal serum, or commercial protein-blockers [45] [6] [46].
- Primary Antibody Incubation: The section is incubated with a primary antibody specific to the target antigen. The antibody concentration and incubation time (which can range from one hour to overnight) require careful optimization for each assay [45] [6].
Divergent Detection and Visualization Steps
After primary antibody incubation, the protocols for IHC and IF diverge based on their detection methods.
For IHC (Chromogenic Detection):
- Detection: An enzyme-labeled polymer (e.g., HRP-polymer) or a biotinylated secondary antibody followed by an enzyme-streptavidin complex is applied. The enzyme then catalyzes a reaction with a chromogen substrate (e.g., DAB, which produces a brown precipitate) to generate a visible color [45] [46].
- Counterstaining: Tissues are counterstained with hematoxylin, which stains nuclei blue, providing morphological context [45] [46].
- Mounting: Slides are dehydrated, cleared, and mounted with a non-aqueous, permanent mounting medium for long-term preservation [45].
For IF (Fluorescence Detection):
- Detection: A fluorophore-conjugated secondary antibody, specific to the host species of the primary antibody, is applied. Multiple secondary antibodies can bind to a single primary antibody, amplifying the signal [6] [2].
- Counterstaining: Nucleic acids are stained with a fluorescent dye, such as DAPI (blue), to label cell nuclei [6].
- Mounting: Slides are mounted with an aqueous, anti-fade mounting medium to reduce photobleaching and preserve the fluorescence signal. The medium often includes the counterstain [6].
The following diagram illustrates the core procedural pathways for both techniques, highlighting their shared and unique steps.
Diagram 1: Comparative IHC and IF Workflows.
Turnaround Time and Practical Performance Metrics
Turnaround time is a critical practical consideration for project planning. While individual lab performance varies, typical timelines can be established based on institutional data and service provider specifications.
Table 2: Typical Turnaround Times for IHC and IF Projects
| Technique | Typical Total Turnaround | Key Time-Consuming Steps | Notes & Special Considerations |
|---|---|---|---|
| IHC | 3-5 days [10] | Overnight fixation (~1 day) [47]; Primary antibody incubation (1 hour to overnight); Special stains add 1-2 days [47]. | Well-established, streamlined protocols in most labs. Rushed services may be available. |
| IF | 5-7 days [10] | All steps shared with IHC; Potential for longer protocol optimization; Image acquisition and deconvolution can be complex. | Direct IF on fresh skin biopsies can be faster (1-3 days) [48]. Multiplexing and image analysis increase time. |
The data indicates that a standard IHC project generally has a shorter turnaround than a standard IF project. This is largely due to IHC's longer history and standardization in diagnostic and research pipelines, whereas IF protocols, especially for multiplexing, often require more optimization and complex image analysis [17] [10]. It is important to note that these are estimates for complete projects; simple, single-plex assays for both techniques can often be completed more quickly.
The Scientist's Toolkit: Essential Research Reagent Solutions
Successful execution of IHC and IF experiments relies on a suite of essential reagents and materials. The following table details key items and their functions within the experimental workflow.
Table 3: Essential Reagents and Materials for IHC and IF
| Item | Function | Application in IHC/IF |
|---|---|---|
| Formalin | Cross-linking fixative that preserves tissue morphology by creating protein cross-links [45]. | Used for initial tissue fixation in both IHC and IF [45] [2]. |
| Primary Antibodies | Immunoglobulin molecules that bind specifically to the target antigen of interest [45]. | The core reagent for both techniques; must be validated for the specific application (IHC or IF) [6]. |
| Chromogenic Substrates (DAB, AEC) | Enzymatic substrates that produce an insoluble colored precipitate when acted upon by HRP or AP [45] [25]. | Used for signal detection and visualization in IHC [10]. |
| Fluorophores (e.g., FITC, TRITC) | Chemical compounds that absorb light at one wavelength and emit light at a longer, specific wavelength [6] [2]. | Conjugated to secondary antibodies for signal detection in IF [2]. |
| Mounting Media | A solution used to embed and preserve the tissue section under a coverslip. | IHC: Non-aqueous, permanent media [45]. IF: Aqueous, anti-fade media to reduce photobleaching [6]. |
| Blocking Serum | A protein-rich solution (e.g., BSA, normal serum) used to occupy non-specific binding sites on the tissue [45] [6]. | Critical for reducing background signal in both IHC and IF [46] [2]. |
The choice between IHC and IF is not a matter of one technique being superior to the other, but rather which is best suited to answer a specific research question given project constraints.
Choose IHC if: Your priority is a permanent, archivable record; your lab is equipped with only a brightfield microscope; you require crisp morphology for pathologist review; you are targeting only 1-2 markers; and you need a relatively fast, cost-effective turnaround for diagnostic or simple research applications [17] [10].
Choose IF if: Your research question requires the detection of three or more targets simultaneously (multiplexing) on the same slide; you are studying protein co-localization or complex spatial relationships within the tumor microenvironment; you have access to fluorescence microscopy and image analysis expertise; and superior sensitivity and a wider dynamic range are needed [17] [10].
Ultimately, IHC remains the workhorse for clinical diagnostics and single-target morphological analysis, while IF offers powerful capabilities for complex, multi-parameter research studies. By understanding their respective workflows and timelines, researchers can make an informed decision that optimizes resources and effectively advances their scientific objectives.
Microsatellite Instability (MSI) and Mismatch Repair (MMR) deficiency have emerged as crucial predictive biomarkers in oncology, primarily for identifying patients who may benefit from immunotherapy. MSI refers to a hypermutable condition caused by the failure of the DNA mismatch repair system, characterized by the accumulation of insertion or deletion mutations in short, repetitive DNA sequences known as microsatellites. The MMR system, comprising key proteins MLH1, MSH2, MSH6, and PMS2, normally corrects these replication errors; when compromised, it leads to MMR deficiency (dMMR) and the MSI-high (MSI-H) phenotype. The clinical significance of MSI-H/dMMR status has expanded beyond hereditary cancer screening to become a tumor-agnostic biomarker for immune checkpoint inhibitor response, making accurate detection methodologies increasingly important in precision oncology.
Two primary methodological approaches dominate clinical testing: Immunohistochemistry (IHC), which detects the presence or absence of MMR proteins, and Next-Generation Sequencing (NGS), which directly identifies microsatellite instability at the DNA level. While IHC remains widely used due to its accessibility and cost-effectiveness, NGS offers a more comprehensive genomic profile. This case study examines the comparative performance of these techniques, their complementary strengths, and optimal implementation strategies within the broader context of diagnostic immunohistochemistry applications and limitations.
Technical Methodologies & Experimental Protocols
Immunohistochemistry (IHC) Protocol for MMR Protein Detection
IHC serves as an indirect method for assessing MSI status by visualizing the expression of MMR proteins in tumor tissue nuclei. The standard protocol involves several critical steps that significantly impact result interpretation [49] [50] [51]:
Tissue Processing: Formalin-fixed, paraffin-embedded (FFPE) tumor tissues are sectioned at 4μm thickness and mounted on charged slides. Proper fixation time (typically 6-72 hours in 10% neutral buffered formalin) is essential for epitope preservation and preventing false-negative results.
Antibody Staining: Automated staining systems (e.g., Dako OMNIS) utilize primary antibodies targeting the four core MMR proteins: MLH1 (clone ES05), MSH2 (clone FE11), MSH6 (clone EP49), and PMS2 (clone EP51). Optimal antibody dilution, incubation time, and antigen retrieval methods are validated for each laboratory protocol.
Interpretation Criteria: Tumor cells are assessed for nuclear staining compared to internal positive controls (non-neoplastic stromal or inflammatory cells). Loss of expression is defined as complete absence of nuclear staining in tumor cells despite preserved staining in internal controls. Indeterminate cases with weak or heterogeneous staining present diagnostic challenges.
The IHC methodology provides several advantages, including spatial context that allows correlation with tumor morphology and identification of heterogeneous protein loss. However, limitations include inability to detect non-truncating mutations that produce functionally impaired but antigenically intact proteins, and technical variability in tissue processing and antibody performance.
Next-Generation Sequencing (NGS) Protocol for MSI Detection
NGS-based MSI detection directly assesses genomic instability by analyzing multiple microsatellite loci spread across the genome. The workflow incorporates multiple quality control checkpoints to ensure reliable results [52] [53] [54]:
DNA Extraction and Quality Control: DNA is extracted from FFPE tissue sections using commercial kits (e.g., QIAamp DNA FFPE Tissue Kit). Quality assessment measures include DNA concentration (≥50ng input recommended), fragment size distribution, and purity indices. Degraded samples may require specialized library preparation protocols.
Library Preparation and Target Enrichment: Two primary approaches are employed: (1) Amplicon-based methods (e.g., TruSight Oncology 500) use PCR to amplify targeted regions, and (2) Hybridization capture-based methods (e.g., AVENIO CGP Kit) use biotinylated probes to enrich genomic regions of interest. Both approaches typically target 100+ microsatellite loci alongside cancer-associated genes.
Sequencing and Bioinformatics Analysis: Sequencing platforms (e.g., Illumina NextSeq 500, MGI DNBSEQ-G50RS) generate short reads that are aligned to reference genomes. Specialized algorithms (e.g., MSIsensor, MSIDRL) analyze microsatellite loci for length variations, applying specific thresholds to classify MSI status. For example, the VariantPlex Solid Tumor Focus v2 panel classifies samples as MSI-H when >30% of loci are unstable and MSS when <20% are unstable.
NGS methodology offers the advantage of simultaneous profiling of multiple genomic biomarkers beyond MSI, including tumor mutation burden (TMB), single nucleotide variants (SNVs), and gene fusions, from limited tissue material. However, it requires sophisticated bioinformatics infrastructure and expertise for proper implementation and interpretation.
Comparative Performance Data
Concordance Studies Between IHC and NGS
Multiple studies have directly compared the performance of IHC and NGS for MSI/MMR assessment across various cancer types. The findings demonstrate generally high concordance with informative discordant cases that highlight the complementary nature of these approaches.
A 2025 comparative analysis of 139 tumor samples revealed a strong correlation between IHC-based MMR protein loss and NGS-based MSI detection [49] [50] [51]. Among 12 tumors classified as MSI-H by NGS, 10 exhibited corresponding MMR protein loss on IHC. However, two MSI-H tumors (a mucinous adenocarcinoma of omental origin and a mucinous colon adenocarcinoma) retained MMR protein expression by IHC, demonstrating scenarios where NGS provides complementary detection of MSI status. No MMR-deficient tumors by IHC were classified as microsatellite stable by NGS, suggesting IHC has high specificity but potentially lower sensitivity for MSI detection in certain contexts.
A large-scale retrospective study of 35,563 Chinese pan-cancer cases further validated NGS-based MSI testing, demonstrating its applicability across diverse tumor types [52]. The study developed a novel algorithm (MSIDRL) that analyzed 100 carefully selected microsatellite loci, achieving robust performance compared to traditional methods. This extensive dataset provided important insights into MSI-H prevalence across different cancers, with the highest rates observed in endometrial, gastric, and colorectal cancers.
Diagnostic Accuracy Across Tumor Types
The performance of MSI detection methods varies significantly across different cancer types, reflecting tissue-specific biological characteristics.
Table 1: Performance Characteristics of MSI Detection Methods by Cancer Type
| Cancer Type | Testing Method | Sensitivity | Specificity | Concordance Rate | Key Observations |
|---|---|---|---|---|---|
| Colorectal Cancer | NGS vs. PCR | 93-97% | 97-99% | 97-99.4% [52] [54] | High concordance in traditional Lynch-associated cancers |
| Non-Colorectal Cancers | NGS vs. PCR | 87-96% | 94-99% | 96.6% [52] [54] | Slightly lower concordance in diverse cancer types |
| Pan-Cancer | NGS vs. IHC | 83.3% | 100% | 92.1% [49] [50] | Two discordant MSI-H cases with retained MMR protein expression |
| Non-Small Cell Lung Cancer | NGS vs. Standard Methods | 80-99% for various mutations | 97-99% [55] [56] | Varies by mutation type | Lower sensitivity for fusions vs. point mutations |
A comprehensive meta-analysis of 56 studies involving 7,143 advanced NSCLC patients demonstrated the high accuracy of NGS for detecting actionable mutations in tissue samples, with 93% sensitivity and 97% specificity for EGFR mutations, and 99% sensitivity and 98% specificity for ALK rearrangements [55]. In liquid biopsy applications, NGS showed excellent performance for detecting EGFR, BRAF V600E, KRAS G12C, and HER2 mutations (80% sensitivity, 99% specificity) but had limited sensitivity for detecting ALK, ROS1, RET, and NTRK rearrangements in circulating tumor DNA.
Operational Considerations: Turnaround Time and Tissue Requirements
Practical implementation factors significantly influence the choice between IHC and NGS testing methodologies in clinical practice.
Table 2: Operational Characteristics of MSI/MMR Testing Methods
| Parameter | Immunohistochemistry (IHC) | Next-Generation Sequencing (NGS) | PCR-Based MSI Testing |
|---|---|---|---|
| Turnaround Time | 1-2 days [57] | 4-19 days [55] [53] | 1-2 days [57] |
| Tissue Requirements | 1-2 FFPE sections | ≥50ng DNA from FFPE [53] | Tumor and normal DNA |
| Capital Equipment Costs | Moderate (automated stainers) | High (sequencers, computing) | Moderate (PCR, electrophoresis) |
| Technical Expertise | Pathology-trained personnel | Bioinformaticians, molecular biologists | Molecular biology technicians |
| Multiplexing Capability | Limited (sequential staining) | High (simultaneous assessment of multiple biomarkers) | Targeted (MSI status only) |
Notably, laboratories implementing in-house NGS testing have demonstrated significant turnaround time improvements. One study reported reducing reporting time from 3 weeks with outsourced testing to just 4 days with optimized in-house NGS workflows [53] [58]. Liquid biopsy approaches using NGS have shown even shorter turnaround times (8.18 days) compared to tissue-based testing (19.75 days) in NSCLC [55], highlighting the potential for more rapid clinical decision-making.
Complementary Clinical Applications
Scenarios Favoring IHC Testing
IHC remains the preferred initial testing approach in several clinical contexts due to its accessibility, cost-effectiveness, and unique analytical strengths [49] [50] [57]:
First-Line Screening in High-Prevalence Cancers: For colorectal and endometrial carcinomas, where MSI-H prevalence exceeds 10-15%, IHC provides a cost-effective screening tool with rapid results that guide initial therapeutic decisions.
Lynch Syndrome Identification: IHC offers mechanistic insights by identifying which specific MMR protein is lost, directly informing germline testing strategies. For example, loss of MSH2/MSH6 suggests possible Lynch syndrome related to MSH2 mutations, while isolated MLH1 loss with PMS2 retention is unlikely to represent Lynch syndrome.
Resource-Limited Settings: In laboratories without access to advanced molecular infrastructure, IHC provides a practical solution for MMR status assessment using existing pathology platforms and expertise.
Tissue-Sparing Situations: When minimal tissue is available for focused diagnostic questions, IHC can be performed on very small biopsy specimens while preserving tissue for subsequent molecular testing if needed.
Scenarios Favoring NGS Testing
NGS offers distinct advantages in complex diagnostic situations that require comprehensive genomic profiling [49] [52] [54]:
Cases with Equivocal IHC Results: When IHC staining patterns are ambiguous (weak, heterogeneous, or technically suboptimal), NGS provides a definitive assessment of MSI status through direct genomic evaluation.
Pan-Cancer Immunotherapy Selection: For cancer types beyond colorectal and endometrial origins, NGS offers standardized assessment across diverse malignancies, overcoming the limitations of tumor type-specific IHC interpretation criteria.
Comprehensive Biomarker Profiling: When tissue is limited, NGS enables simultaneous evaluation of MSI, tumor mutation burden (TMB), gene fusions, and specific mutations in a single assay, maximizing information from small samples.
Detection of Non-Truncating MMR Mutations: NGS can identify MSI-H status caused by non-truncating MMR mutations that produce dysfunctional but antigenically intact proteins, which would be missed by IHC [52].
Clinical Trial Enrollment: NGS facilitates eligibility determination for multiple biomarker-driven trials through comprehensive genomic profiling beyond MSI status alone.
Integrated Testing Algorithms
The complementary strengths of IHC and NGS support the development of optimized testing algorithms that maximize diagnostic accuracy while considering resource utilization. Based on current evidence, several integrated approaches have demonstrated clinical utility.
The diagnostic workflow above illustrates how IHC and NGS can be strategically deployed based on clinical context, tissue availability, and initial test results. This algorithm emphasizes efficient resource utilization while maintaining high diagnostic accuracy through orthogonal confirmation of discordant cases.
For laboratories implementing NGS as a primary testing modality, establishing appropriate thresholds for MSI classification is critical. One real-world study of 331 cancer patients recommended an MSI score cut-off of ≥13.8% for classifying tumors as MSI-H, with a borderline group (MSI scores ≥8.7% to <13.8%) where integration of TMB data improved classification accuracy [54]. This refined approach acknowledges the biological continuum of microsatellite instability and optimizes test performance through multi-parameter assessment.
Essential Research Reagents and Materials
Successful implementation of MSI/MMR testing protocols requires specific reagent systems and technical components that ensure assay reliability and reproducibility.
Table 3: Essential Research Reagents for MSI/MMR Testing
| Reagent Category | Specific Examples | Function and Application | Technical Notes |
|---|---|---|---|
| IHC Antibodies | MLH1 (clone ES05), MSH2 (clone FE11), MSH6 (clone EP49), PMS2 (clone EP51) [50] [51] | Detection of MMR protein expression in tumor nuclei | Automated staining systems recommended for consistency |
| NGS Library Preparation Kits | AVENIO CGP Kit (Roche), TruSight Oncology 500 (Illumina), VariantPlex Solid Tumor Focus v2 (ArcherDx) [50] [54] | Target enrichment and sequencing library construction | Hybridization capture vs. amplicon-based approaches offer different advantages |
| DNA Extraction Kits | QIAamp DNA FFPE Tissue Kit (Qiagen) [56] | Nucleic acid isolation from archival tissue | DNA quality assessment critical for success |
| Reference Standards | HD701 Multiplex Reference Material [53] | Assay validation and quality control | Enables determination of limit of detection (2.9% VAF) |
| Bioinformatics Tools | MSIsensor, MSIDRL, Sophia DDM [52] [53] [54] | MSI classification from sequencing data | Custom algorithms may require validation for specific populations |
The selection of appropriate reagents and platforms should consider intended application, sample types, and available infrastructure. For IHC testing, standardized control tissues with known MMR protein expression patterns are essential for daily quality assurance. For NGS testing, reference materials with defined mutation profiles at varying allele frequencies enable accurate determination of assay sensitivity and limit of detection, which is particularly important for detecting subclonal MSI events.
The comparative analysis of IHC and NGS for MSI/MMR testing reveals a complementary relationship rather than a competitive one between these methodologies. IHC maintains important advantages in accessibility, cost-effectiveness, and provision of spatial context within tumor tissue, while NGS offers comprehensive genomic profiling, objective scoring metrics, and applicability across diverse cancer types.
The optimal testing approach depends on multiple factors, including clinical context, tissue availability, resource constraints, and therapeutic questions. For many diagnostic laboratories, a reflexive testing algorithm that begins with IHC and reserves NGS for equivocal cases or those requiring comprehensive profiling represents a pragmatic strategy that balances diagnostic accuracy with efficient resource utilization. As precision oncology continues to evolve, with expanding indications for immunotherapy across cancer types, the strategic integration of IHC and NGS methodologies will remain essential for optimal patient selection and treatment outcomes.
Optimizing Results: Troubleshooting Common IHC and IF Challenges
This guide provides a detailed comparison of critical sample preparation techniques in immunohistochemistry (IHC) and immunofluorescence (IF), focusing on how fixation, antigen retrieval, and section thickness impact assay sensitivity and application suitability.
Fixation Methods: Balancing Morphology and Antigenicity
Table 1: Comparison of Tissue Fixation Methods
| Fixation Method | Mechanism | Best For | Impact on Sensitivity | Key Limitations |
|---|---|---|---|---|
| Formalin/Paraformaldehyde (PFA) [11] | Cross-links proteins via methylene bridges, preserving structure but potentially masking epitopes. | FFPE tissues; long-term sample storage; excellent morphology. [11] [59] | Can reduce sensitivity by masking epitopes; often requires antigen retrieval. [11] [60] | Over-fixation causes excessive cross-linking; requires optimization of time and pH. [11] |
| Acetone [61] | Precipitates proteins by disrupting hydrophobic interactions and dehydrating the sample. | Frozen sections; labile antigens; fast protocols. [61] [62] | Higher sensitivity for some antigens due to lack of cross-linking. [61] | Poorer preservation of cellular ultrastructure compared to cross-linking fixatives. [11] |
| Ethanol/Methanol [11] | Precipitates proteins by altering dielectric points and disrupting hydrogen bonding. | Cytoplasmic and nuclear antigens in cell smears (ICC). [11] [59] | Incompatible with heat-induced antigen retrieval, which can limit signal for some targets. [11] | Can cause tissue hardening and shrinkage; not ideal for all tissue types. [11] |
Experimental Insights into Fixation
The choice of fixative directly dictates the need for and type of antigen retrieval. A study comparing formalin and ethanol fixation in pancreas tissue demonstrated that insulin staining was almost entirely abolished following ethanol fixation, whereas somatostatin staining was unaffected. This highlights that the optimal fixative is target-specific and must be determined empirically [11]. For frozen sections, a common protocol involves fixation with 4% paraformaldehyde for 8 minutes at 2-8°C or for 20 minutes at -20°C, followed by thorough washing [62].
Figure 1: Fixation methods determine downstream antigen retrieval needs. Cross-linking fixatives like formalin often require retrieval, while precipitating fixatives like acetone may allow direct staining.
Antigen Retrieval: Reversing Fixation-Induced Epitope Masking
Table 2: Comparison of Antigen Retrieval Methods
| Retrieval Method | Principle | Protocol Example | Advantages | Disadvantages & Data |
|---|---|---|---|---|
| Heat-Induced Epitope Retrieval (HIER) [60] | Uses heat (95-100°C) in buffer to break methylene cross-links formed during formalin fixation. | Microwave in citrate pH 6.0 or Tris-EDTA pH 9.0 buffer at 95°C for 8-12 minutes. [60] | Broad range of antigens, especially nuclear; less tissue morphology disruption. [60] | Overheating can damage antigens/tissues. In one study, HIER caused frequent section detachment. [63] |
| Proteolytic-Induced Epitope Retrieval (PIER) [60] | Uses enzymes (e.g., proteinase K, trypsin) to digest proteins around epitopes. | 30 µg/mL Proteinase K in Tris/HCl pH 6.0 for 90 min at 37°C. [63] | Gentler on tissue morphology; effective for difficult-to-recover epitopes. [60] | Can destroy antigen and morphology if over-digested. Demonstrated superior staining for CILP-2 in cartilage. [63] |
| Combined HIER/PIER [63] | Sequential application of heat and enzymatic retrieval. | HIER (95°C, 10 min) followed by PIER (Proteinase K, 37°C, 90 min). [63] | Theoretical synergy of both methods. | No improvement over PIER alone for CILP-2; heat reduced PIER's positive effect. [63] |
Quantitative Evidence in Antigen Retrieval Selection
A direct comparison of antigen retrieval methods for detecting cartilage intermediate layer protein 2 (CILP-2) in osteoarthritic cartilage provided quantitative performance data [63]. The semi-quantitative assessment of staining extent revealed that:
- PIER alone yielded the best staining results for the CILP-2 glycoprotein.
- The combination of HIER followed by PIER did not enhance staining and, in fact, frequently led to section detachment from slides, compromising the sample integrity.
- The study concluded that enzymatic retrieval (PIER) was the most effective method for this particular matrix protein in the given experimental setting [63].
The pH of the retrieval buffer is also a critical factor. Antibody performance can be classified into types based on pH sensitivity: Stable Type (minimal pH effect, e.g., PCNA), V Type (good staining at high and low pH, poor at mid-pH, e.g., Ki-67), and Increasing Type (staining improves with pH, e.g., HMB45) [60].
Figure 2: Antigen retrieval workflows. HIER uses heat and buffer, while PIER uses enzymes to expose masked epitopes.
Section Thickness and Tissue Processing: IHC vs. IF Requirements
Table 3: Sectioning and Processing for IHC vs. IF
| Parameter | IHC (FFPE) | IF (Multiplex) | Frozen Sections (IHC/IF) |
|---|---|---|---|
| Typical Thickness | 4 µm for crisp morphology for pathologist review. [63] [10] | 5-7 µm to preserve tissue and provide more biomarkers for imaging. [10] | 5-15 µm, with 5-10 µm being common. [61] [62] |
| Tissue Processing | Dehydration, clearing, paraffin embedding, de-waxing, rehydration. [59] | Similar to IHC, but autofluorescence must be considered. [17] | Rapid freezing in O.C.T. compound; no embedding/dewaxing. [61] [62] |
| Impact on Multiplexing | Limited to 1-2 markers by default due to color overlap. [10] [59] | Enables 2-60+ markers via fluorescent dyes and cyclic staining/imaging. [10] [64] | Suitable for multiplex IF; retains more labile antigens but morphology is less precise. [59] |
Workflow Implications
The choice between FFPE and frozen processing is often dictated by the need to balance morphological preservation with antigen preservation. FFPE processing, while superior for histology, can be harsh and destroy sensitive epitopes. In contrast, frozen section preparation skips fixation and dehydration, better preserving enzyme and antigen function [61]. For high-plex IF imaging, thicker sections (5-7 µm) are recommended to provide a sufficient volume of tissue for detecting multiple biomarkers while avoiding damage during processing [10].
The Scientist's Toolkit: Essential Research Reagent Solutions
Table 4: Key Reagents for Sample Preparation
| Reagent Category | Specific Examples | Function in Protocol |
|---|---|---|
| Fixatives [11] [62] | 10% Neutral Buffered Formalin, 4% Paraformaldehyde (PFA), Acetone (-20°C) | Preserves tissue architecture and prevents degradation; choice dictates downstream retrieval. |
| Antigen Retrieval Buffers [60] | Sodium Citrate (10 mM, pH 6.0), Tris-EDTA (1 mM, pH 9.0) | Breaks protein cross-links formed during fixation; pH critical for success. |
| Proteolytic Enzymes [63] [60] | Proteinase K, Trypsin, Pepsin | Digests proteins surrounding masked epitopes for Proteolytic-Induced Epitope Retrieval (PIER). |
| Embedding Media [61] [62] | O.C.T. Compound | Supports tissue during cryostat sectioning for frozen samples. |
| Blocking Agents [63] [62] | Bovine Serum Albumin (BSA), Normal Serum (e.g., Horse, Donkey) | Reduces non-specific background staining by occupying reactive sites. |
| Detection Reagents | HRP/DAB, Fluorescently-labeled secondary antibodies (e.g., Alexa Fluor conjugates) | Generates visible signal (chromogenic or fluorescent) for target localization. |
Mastering sample preparation is fundamental to success in IHC and IF. The experimental data confirms that no single method is universally superior. The optimal protocol must be empirically determined based on the specific target antigen, tissue type, and desired application. For critical targets like CILP-2 in cartilage, PIER may be unequivocally better, while for many nuclear antigens, HIER remains the gold standard. Similarly, the choice between FFPE and frozen sections, and the corresponding section thickness, involves a direct trade-off between superior morphology and enhanced antigenicity or multiplexing capability. A deep understanding of these comparative principles enables researchers to rationally design robust and sensitive staining protocols.
Immunohistochemistry (IHC) and Immunofluorescence (IF) are foundational techniques in biomedical research and diagnostics, enabling the visualization of protein expression within tissues and cells. While both rely on antibody-antigen interactions, they differ significantly in their detection methods: IHC uses enzymatic reactions to produce a permanent colored precipitate, whereas IF utilizes fluorescent dyes that emit light under specific wavelengths [10] [17]. A critical challenge common to both techniques is optimizing the signal-to-noise ratio. Issues like no signal, high background, and non-specific binding can compromise data integrity. This guide objectively compares the performance of IHC and IF in resolving these staining issues, supported by experimental data and detailed protocols.
Understanding IHC and IF: Core Principles and Comparison
The choice between IHC and IF significantly influences the experimental workflow, required equipment, and potential applications. The table below provides a comparative overview of their core characteristics.
Table 1: Key Characteristics of IHC and IF
| Feature | Immunohistochemistry (IHC) | Immunofluorescence (IF) |
|---|---|---|
| Detection Chemistry | Enzymes (e.g., HRP/AP) with chromogenic substrates (e.g., DAB) [10] | Fluorophores conjugated to antibodies [10] |
| Signal Stability | Permanent, archivable for years [10] [17] | Moderate; susceptible to photobleaching [10] [17] |
| Equipment | Standard brightfield microscope [10] | Fluorescence microscope or advanced scanner [10] |
| Multiplexing Capacity | Limited (typically 1-2 markers) [10] | High (2-8 markers with traditional IF; 10-60 with ultra-high-plex platforms) [10] |
| Resolution & Quantitation | Lower resolution; semi-quantitative analysis [65] [17] | Higher resolution; better suited for quantitative analysis and co-localization studies [65] [17] |
| Best For | Diagnostic pathology, regulatory archiving, crisp morphology [10] | Spatial biology, immune cell analysis, tumor microenvironment, co-localization [10] |
Troubleshooting Staining Issues: Causes and Experimental Solutions
Problem 1: No or Weak Signal
A lack of expected staining is a common frustration that can stem from multiple points in the experimental pipeline.
Table 2: Troubleshooting No or Weak Signal
| Cause | Supporting Evidence | Experimental Solution & Protocol |
|---|---|---|
| Suboptimal Antigen Retrieval | Heat-induced epitope retrieval (HIER) is critical for formalin-fixed tissues. Microwave oven retrieval shows clearly superior performance compared to water baths [66]. | Protocol: Use HIER with 10 mM sodium citrate (pH 6.0) or Tris-EDTA (pH 9.0). Heat in a microwave for 8-15 minutes or a pressure cooker for 20 minutes. The optimal buffer and method are antibody-dependent and should be validated [66] [67]. |
| Antibody Potency or Dilution | Primary antibodies can lose potency due to degradation, contamination, or repeated freeze-thaw cycles. Incorrect dilution is a major cause of failure [68]. | Protocol: Always include a known positive control. Titrate the primary antibody to determine the optimal concentration. For CST antibodies, incubate overnight at 4°C as per validated protocols. Ensure antibodies are aliquoted and stored properly [66] [68]. |
| Inefficient Detection System | Polymer-based detection reagents provide enhanced sensitivity compared to avidin-biotin-based systems [66]. | Protocol: Switch to a polymer-based detection system (e.g., SignalStain Boost IHC Detection Reagents). Avoid biotin-based systems if endogenous biotin is high. Ensure detection reagents are fresh and not expired [66]. |
Problem 2: High Background Staining
High background obscures specific signal and is often related to inadequate blocking or endogenous activities.
Table 3: Troubleshooting High Background Staining
| Cause | Supporting Evidence | Experimental Solution & Protocol |
|---|---|---|
| Inadequate Blocking | Non-specific binding sites must be blocked before primary antibody incubation. Serum, BSA, or commercial blocking buffers are used to occupy these sites [69] [70]. | Protocol: Block with 1X TBST containing 5% normal serum from the secondary antibody species for 30 minutes at room temperature. For IF, using the same blocking buffer to dilute antibodies can help [69] [66]. |
| Endogenous Enzyme Activity | Tissues like kidney, liver, and red blood cells contain endogenous peroxidases that react with HRP substrates [70] [68]. | Protocol (Peroxidase): Quench with 3% H2O2 in methanol or water for 10-15 minutes before primary antibody incubation [66] [68]. |
| Endogenous Biotin | Kidney, liver, and brain tissues are high in endogenous biotin, which binds to (strept)avidin in detection systems [66] [70]. | Protocol: Use an avidin/biotin blocking kit or, preferably, switch to a polymer-based detection system that avoids biotin entirely [66] [70]. |
| Secondary Antibody Cross-Reactivity | Secondary antibodies can bind to endogenous immunoglobulins in the tissue, especially in mouse-on-mouse studies [66] [68]. | Protocol: Always run a no-primary-antibody control. Use Fab fragment secondary antibodies and ensure the blocking serum matches the species of the secondary antibody [66] [70]. |
Problem 3: Non-Specific Binding and Autofluorescence
Non-specific binding refers to antibody binding to sites other than the target epitope. In IF, autofluorescence can mimic this specific signal.
- Non-Specific Antibody Binding: This can be caused by over-fixation, which masks the epitope and promotes hydrophobic/ionic interactions, or by using a primary antibody concentration that is too high [68]. Solution: Titrate the primary antibody to the lowest concentration that gives a strong specific signal. Adding NaCl (0.15-0.6 M) to the antibody diluent can reduce ionic interactions [68].
- Autofluorescence in IF: Aldehyde fixatives (e.g., formalin) can induce autofluorescence, and some tissues contain intrinsic fluorescent compounds [70] [68]. Solution: Treat tissues with autofluorescence quenching dyes such as Sudan black or pontamine sky blue [70]. Alternatively, use fluorophores that emit in the near-infrared range (e.g., Alexa Fluor 750), as tissues have less autofluorescence in this spectrum [68].
Experimental Protocols for Optimal Staining
Standard IHC Protocol with Critical Optimization Steps
The following workflow outlines a robust IHC protocol for paraffin-embedded tissues, integrating key optimization steps to prevent common issues [66] [67].
Enhanced Signal-to-Noise Protocol for Immunofluorescence
This protocol incorporates a specialized Antibody Signal Enhancer (ASE) solution to improve the signal-to-noise ratio in IF, as demonstrated in published studies [71].
The Scientist's Toolkit: Essential Research Reagent Solutions
The following table lists key reagents and their specific functions in optimizing IHC and IF experiments, as derived from the cited methodologies.
Table 4: Essential Reagents for Resolving Staining Issues
| Reagent | Function | Application & Note |
|---|---|---|
| Normal Serum | Blocks non-specific binding sites by providing unrelated antibodies and proteins. | Must be from the same species as the secondary antibody [69] [70]. |
| Bovine Serum Albumin (BSA) | A common protein used in blocking buffers to compete for non-specific binding sites [69]. | Often used at 1-5% (w/v). A component of many commercial and homemade buffers [69]. |
| Sodium Borohydride | Reduces aldehyde-induced autofluorescence by breaking fluorescent Schiff bases [68]. | Particularly useful for formalin-fixed tissues. Use ice-cold (1 mg/mL) in PBS [68]. |
| Hydrogen Peroxide (H₂O₂) | Quenches endogenous peroxidase activity, reducing background in HRP-based IHC [66] [68]. | Typically used at 3% for 10-15 minutes. Dilute in methanol or RODI water [66]. |
| Levamisole | Inhibits endogenous alkaline phosphatase (AP) activity [70] [68]. | Essential when using AP-based detection systems. Does not inhibit the bacterial AP used in some kits [70]. |
| Antibody Signal Enhancer (ASE) | A defined solution (glycine, Triton, Tween, H₂O₂) that increases specific antibody signal [71]. | Used to dilute primary antibodies. Similar in function to commercial enhancers like Pierce Immunostain Enhancer (PIE) [71]. |
| Polymer-Based Detection Reagents | Non-biotin detection systems using a dextran backbone conjugated to multiple enzyme molecules. | Provides high sensitivity and avoids background from endogenous biotin [66] [70]. |
Success in IHC and IF requires a systematic approach to troubleshooting. Key differentiators between the techniques, such as the permanence of IHC and the multiplexing capability of IF, should guide the initial choice of method [10] [17]. However, regardless of the technique, fundamental practices are universal: rigorous optimization of antigen retrieval, empirical determination of antibody concentrations, and the implementation of appropriate blocking strategies and controls [69] [66]. By understanding the underlying causes of staining artifacts and applying the targeted experimental solutions and protocols detailed in this guide, researchers can generate reliable, high-quality data that pushes forward both basic research and diagnostic accuracy.
In the comparative landscape of immunohistochemistry (IHC) and immunofluorescence (IF), antibody optimization emerges as a fundamental determinant of assay success. While both techniques rely on antibody-antigen interactions, their distinct detection chemistries—chromogenic for IHC and fluorescent for IF—demand tailored approaches to titration, diluent selection, and incubation strategies. The choice between IHC and IF often hinges on application requirements: IHC provides permanent, archivable slides ideal for diagnostic pathology, while IF offers superior multiplexing capabilities and sensitivity for spatial biology research [17] [10]. Within this context, proper antibody optimization becomes paramount for generating reproducible, high-quality data in both clinical and research settings, directly impacting the reliability of findings in drug development and basic science.
Core Principles: IHC vs. IF Detection Systems
The fundamental difference between IHC and IF lies in their detection methodologies. IHC typically uses enzyme-conjugated antibodies (e.g., horseradish peroxidase or alkaline phosphatase) that convert substrates into visible, colored precipitates at the antigen site [25]. This chromogenic reaction produces a permanent stain viewable with standard brightfield microscopy. In contrast, IF employs fluorophore-conjugated antibodies that emit light at specific wavelengths when excited by special lighting, requiring fluorescence microscopy for visualization [17] [10].
This distinction in detection chemistry creates different optimization priorities. IHC optimization often focuses on maximizing signal-to-noise ratio while preserving tissue morphology, whereas IF optimization emphasizes balancing signal intensity against background fluorescence and mitigating photobleaching [72]. The table below summarizes key comparative characteristics:
Table 1: Fundamental Differences Between IHC and IF Detection Systems
| Parameter | Immunohistochemistry (IHC) | Immunofluorescence (IF) |
|---|---|---|
| Detection Chemistry | Enzyme-mediated chromogenic reaction | Fluorophore emission |
| Signal Stability | Permanent, archivable for years | Moderate, prone to photobleaching |
| Microscope Requirements | Brightfield microscope | Fluorescence microscope |
| Multiplexing Capacity | Limited (typically 1-2 markers) | High (typically 2-8+ markers) |
| Sensitivity/Dynamic Range | Moderate | High to Very High |
| Best Applications | Diagnostic workflows, regulatory archiving | Spatial biology, co-localization studies |
Antibody Titration Strategies
Titration represents the most critical step in antibody optimization, determining both assay sensitivity and specificity. The optimal dilution maximizes specific signal while minimizing background, and differs significantly between IHC and IF due to their distinct detection sensitivities.
Fundamental Titration Principles
For both IHC and IF, initial titration experiments should test a range of antibody concentrations, typically through serial dilutions [72]. A common starting point is 1μg/mL for purified antibodies or 1:100 to 1:1000 for antiserum [72]. However, the optimal dilution must be determined empirically for each antibody-antigen pair and should be established alongside proper positive and negative controls [73].
For IHC, the ideal dilution produces strong specific staining with minimal background, preserving the ability to clearly discern tissue morphology. For IF, optimal titration achieves bright specific fluorescence without bleed-through between channels in multiplex experiments [72]. The enhanced sensitivity of IF often requires higher dilutions (more dilute antibody) compared to IHC applications.
Comparative Titration Data
Recent studies highlight how titration requirements differ between IHC and IF, particularly in demanding applications like HER2-low detection in breast cancer. The CASI-01 study revealed that conventional FDA-cleared HER2 IHC assays demonstrated variability in detection thresholds between laboratories, ranging from 30,000 to 60,000 HER2 molecules per cell [41]. While these assays showed high accuracy for identifying HER2 overexpression (3+), with 85.7% sensitivity and 100% specificity, they exhibited poor dynamic range for detecting HER2-low expression (1+ or ultra-low) [41].
In contrast, IF-based approaches with enhanced analytic sensitivity combined with image analysis achieved a six-fold improvement in dynamic range for detecting HER2-low scores [41]. This demonstrates how IF's inherent sensitivity advantages necessitate different titration strategies, particularly for low-abundance targets.
Table 2: Comparative Titration and Performance Data for IHC vs. IF
| Parameter | IHC | IF |
|---|---|---|
| Typical Primary Antibody Incubation | 30-60 minutes at room temperature [73] | 1-2 hours at room temperature or overnight at 4°C [72] |
| Detection Threshold Range | 30,000-60,000 molecules/cell (HER2 example) [41] | Enhanced sensitivity for low-abundance targets |
| Dynamic Range | Limited for low-expression targets [41] | 6-fold improvement for HER2-low vs. IHC [41] |
| Multiplexing Limitations | Color overlap complicates deep multiplexing [10] | Spectral unmixing enables 10-60 plex [3] |
Diluent and Buffer Composition
The composition of antibody diluents significantly impacts antibody binding efficiency and specificity in both IHC and IF.
Protein-Based Blocking Agents
For both techniques, antibodies should be diluted in blocking buffer rather than plain PBS to reduce non-specific binding [72]. Common protein blockers include 1%-5% Bovine Serum Albumin (BSA), non-fat dry milk, or normal serum [73] [72]. The critical consideration is that blocking proteins must not originate from the species in which the primary antibody was raised [72]. For example, if using a mouse primary antibody with a goat anti-mouse secondary, normal goat serum would be appropriate for blocking.
Normal serum from the same species as the secondary antibody at concentrations of 5%-10% is often ideal for blocking Fc receptor-mediated non-specific binding [73]. Recently, commercial mixes of synthetic peptides have also gained popularity for both IHC and IF applications [73].
Specialized Considerations by Technique
For IHC, commercial antibody diluents specifically formulated for chromogenic detection are available. These are optimized to preserve enzyme activity while minimizing non-specific background. Non-fat dry milk should be avoided in avidin-biotin complex (ABC) systems as it contains endogenous biotin that causes background staining [73].
For IF, diluents often include additives to stabilize fluorophores and reduce photobleaching. Additionally, for intracellular targets, permeabilization agents like Triton X-100 may be incorporated into buffers to facilitate antibody access [72]. The choice of detergent depends on the target localization: mild reagents (Digitonin, Saponin) for cytosolic targets, and stronger non-ionic detergents (0.1%-0.2% Triton X-100) for targets within interior membranes [72].
Incubation Strategies
Incubation parameters—including time, temperature, and methodology—profoundly influence antibody binding efficiency and specificity.
Time and Temperature Optimization
Primary antibody incubation conditions differ notably between IHC and IF. For IHC, typical primary antibody incubation ranges from 30-60 minutes at room temperature [73]. In contrast, IF often employs longer incubations of 1-2 hours at room temperature or overnight at 4°C [72], leveraging the temperature sensitivity of antibody binding to improve specificity for challenging targets.
Secondary antibody incubation generally requires 30-60 minutes at room temperature for both techniques [73] [72]. However, IF protocols necessitate working in the dark from the secondary antibody step onward to prevent fluorophore photobleaching.
Methodological Considerations
Incubation should be performed in a humidity chamber to prevent evaporation and antibody concentration, particularly for long incubations [11]. Adequate washing between steps is crucial—typically three washes of 5 minutes each with appropriate buffers (TBS-T or PBS) [73] [72]. For IF, extensive washing after primary antibody incubation is especially critical to reduce nonspecific binding of secondary antibodies [72].
For multiplex IF experiments, sequential staining may be employed, where all blocking, primary, and secondary incubations are completed for one antigen before performing them for the next [72]. This approach requires careful optimization to prevent antibody cross-reactivity and epitope damage during multiple retrieval cycles.
Experimental Protocols for Optimization
Protocol 1: Checkerboard Titration for Primary Antibodies
This fundamental protocol applies to both IHC and IF optimization:
- Prepare serial antibody dilutions covering a broad range (e.g., 1:50, 1:100, 1:200, 1:500, 1:1000) in appropriate blocking buffer.
- Apply to tissue sections or cells with known antigen expression, including positive and negative controls.
- Follow standard IHC or IF protocols with consistent incubation times and temperatures.
- Evaluate staining for each dilution, assessing signal intensity, background, and specificity.
- Select the optimal dilution that provides strong specific signal with minimal background.
Protocol 2: Multiplex IF Panel Optimization
For complex multiplex IF panels (4+ markers), a systematic approach ensures compatibility:
- Validate each antibody individually using Protocol 1 to establish optimal singleplex conditions.
- Test antibody pairs for potential cross-reactivity using isotype-specific secondary antibodies.
- Establish staining sequence considering antigen abundance and antibody compatibility.
- Validate multiplex panel with controls for each marker to confirm specific staining without bleed-through.
- Implement spectral unmixing if necessary to separate overlapping fluorescence signals [3].
Research Reagent Solutions
Successful antibody optimization requires specific reagents tailored to each technique. The table below outlines essential materials and their functions:
Table 3: Essential Research Reagents for Antibody Optimization
| Reagent Category | Specific Examples | Function in Optimization |
|---|---|---|
| Fixatives | 2-4% Paraformaldehyde, Methanol, Acetone [72] | Preserve tissue architecture and antigenicity |
| Permeabilization Agents | Triton X-100, Digitonin, Saponin [72] | Enable antibody access to intracellular targets |
| Blocking Reagents | BSA (1-5%), Normal Serum (5-10%), Commercial Synthetic Mixes [73] [72] | Reduce non-specific antibody binding |
| Detection Enzymes | Horseradish Peroxidase (HRP), Alkaline Phosphatase (AP) [25] | Chromogenic signal generation in IHC |
| Fluorophores | FITC, TRITC, Alexa Fluor conjugates [10] | Fluorescent signal generation in IF |
| Chromogenic Substrates | DAB, AEC [25] | Produce visible precipitate in IHC |
| Mounting Media | Antifade mounting media [72] | Preserve fluorescence and reduce photobleaching in IF |
| Antigen Retrieval Solutions | Citrate buffer, Tris-EDTA [73] | Unmask epitopes cross-linked by fixation |
Advanced Applications and Future Directions
Antibody optimization strategies are evolving to meet demands for increased multiplexing and quantification. In IHC, techniques like Multiplexed Immunohistochemical Consecutive Staining on Single Slide (MICSSS) enable assessment of 10+ markers through iterative staining, imaging, and stripping cycles [3]. For IF, approaches using DNA-barcoded antibodies permit detection of 30-60 markers on a single slide [3].
The integration of digital pathology and artificial intelligence is revolutionizing antibody optimization and validation. AI algorithms can automatically quantify biomarker expression, minimizing subjectivity and variability in interpretation [9]. These technologies are particularly valuable for standardizing HER2-low assessment, where conventional IHC assays show limited dynamic range [41].
Antibody optimization through careful titration, diluent selection, and incubation strategy development remains essential for both IHC and IF applications. The distinct detection chemistries of these techniques demand tailored approaches—IHC prioritizes morphological preservation and signal permanence, while IF emphasizes multiplexing capacity and sensitivity. As precision medicine advances with therapies targeting increasingly subtle molecular differences, such as HER2-low breast cancers, optimized immunodetection assays with appropriate dynamic range and sensitivity will become ever more critical. By applying the systematic optimization strategies outlined here, researchers can ensure reliable, reproducible results that advance both basic research and clinical diagnostics.
Immunofluorescence (IF) is a powerful technique that enables researchers to visualize the intricate distribution of proteins and other antigens within cells and tissues with high specificity and resolution. By harnessing antibodies conjugated to fluorescent dyes, or fluorophores, IF allows for the simultaneous detection of multiple targets, a process known as multiplexing, providing a comprehensive view of complex biological processes [17] [2]. However, the very property that makes IF so valuable—fluorescence—is inherently unstable. Photobleaching, the irreversible destruction of a fluorophore upon exposure to light, represents a fundamental limitation of the technique [74] [75].
This phenomenon poses a significant threat to the integrity of experimental data, particularly in quantitative studies where consistent signal intensity is paramount. Photobleaching can lead to a loss of image clarity, reduced signal-to-noise ratio, and ultimately, inaccurate conclusions [74] [75]. As such, combating photobleaching is not merely a technical optimization but a essential prerequisite for ensuring the reliability and reproducibility of IF experiments, especially when compared to more stable chromogenic detection methods used in Immunohistochemistry (IHC) [17] [10]. This guide provides a comprehensive overview of the strategies and reagents essential for preserving signal stability in IF.
Understanding the Mechanisms of Photobleaching
At its core, photobleaching is a photochemical process. When a fluorophore absorbs a high-energy photon, it enters an excited singlet state. This state is transient, typically lasting only a few nanoseconds, before the fluorophore returns to its ground state by emitting a lower-energy, longer-wavelength photon, which is detected as fluorescence [74]. However, a rarer and more consequential event can occur: the excited molecule can undergo a spin conversion into a long-lived triplet state [74] [76].
While in this triplet state, the fluorophore is highly reactive and can participate in chemical reactions that permanently destroy its ability to fluoresce. A primary mechanism of this destruction involves interaction with molecular oxygen (O₂), leading to the generation of highly destructive reactive oxygen species (ROS) like singlet oxygen [74] [77] [76]. These ROS can break covalent bonds within the fluorophore molecule, causing irreversible damage and signal loss. Factors that accelerate photobleaching include high photon flux (intense light), prolonged exposure time, and the use of fluorophores with slower diffusion rates or inherent low photostability [74] [75].
The following diagram illustrates the photobleaching pathway alongside the normal fluorescence cycle.
Strategic Approaches to Minimize Photobleaching
A multi-pronged strategy is most effective for mitigating photobleaching. The table below summarizes the core approaches, their underlying principles, and key experimental considerations.
Table 1: Comprehensive Strategies for Minimizing Photobleaching in IF
| Strategy Category | Specific Method | Principle of Action | Experimental Considerations |
|---|---|---|---|
| Microscopy & Image Acquisition | Reduce light intensity/exposure [74] [75] | Lowers frequency of excitation-emission cycles, reducing fluorophore stress. | Use neutral-density (ND) filters; focus using transmitted light; minimize exposure time [75]. |
| Use lower-energy photons [74] | Decreases the energy load per photon, extending fluorophore lifespan. | Adjust laser power or use light sources with longer wavelengths where possible. | |
| Chemical Environment | Use antifade mounting media [74] [75] | Contains ROS scavengers and oxygen-depleting agents to protect fluorophores. | Essential for fixed-cell imaging; effectiveness varies by fluorophore [75]. |
| Deplete oxygen [74] [76] | Removes the primary reactant (O₂) responsible for ROS generation. | Highly effective for fixed samples; anoxia significantly reduces bleaching rates [76]. Not suitable for live cells [74]. | |
| Incorporate antioxidants [74] | Scavenges ROS before they can damage the fluorophore. | Examples: ascorbic acid, n-Propyl gallate (nPG). Often included in commercial antifade reagents. | |
| Fluorophore Selection | Choose photostable dyes [74] [75] | Inherent molecular structure is more resistant to photochemical destruction. | Alexa Fluor dyes are engineered for high photostability; avoid inherently unstable fluorophores. |
| Minimize spectral overlap in multiplexing [74] | Prevents unnecessary excitation-emission cycles of non-target dyes. | Select dye panels with minimal spectral crosstalk; use sequential imaging if applicable. |
Detailed Experimental Protocols for Signal Preservation
Protocol 1: Using Antifade Mounting Media for Fixed Samples
This protocol is critical for preserving fluorescence in fixed cells and tissue sections, enabling long-term storage and repeated imaging.
- Sample Preparation: Complete all IF staining steps, including final washes [2].
- Mounting: Prior to applying a coverslip, place a small drop (e.g., 10-50 µL depending on coverslip size) of commercial antifade mounting medium directly onto the stained tissue section or cells on the slide [75].
- Coverslip Application: Gently lower a clean coverslip onto the slide, avoiding air bubbles.
- Curing and Storage: Allow the mounting medium to set according to the manufacturer's instructions. This may involve allowing it to air-harden or polymerize. Store the slides flat, in the dark, at 4°C or as recommended [75].
- Note: The efficacy of antifade media can vary between fluorophores. It may be necessary to test different formulations to identify the optimal one for your specific dye panel [75].
Protocol 2: Optimizing Microscope Settings to Reduce Photon Flux
This protocol should be applied during image acquisition to extend the usable imaging window.
- Focus with Transmitted Light: Locate the area of interest and achieve initial focus using brightfield or phase-contrast illumination instead of fluorescence [75].
- Employ Neutral-Density (ND) Filters: Insert ND filters into the light path to attenuate the intensity of the excitation light reaching the sample [75].
- Minimize Exposure Time: Set the detector (camera) exposure time to the minimum required to obtain a clear signal. Use binning if appropriate to further reduce exposure [75].
- Acquire Images Promptly: Once the exposure settings are optimized, acquire the final images as quickly as possible to limit cumulative light exposure.
Advanced Approach: Oxygen Depletion for Demanding Applications
For experiments requiring extensive Z-stacking or time-lapse imaging of fixed samples, creating an anoxic environment can provide superior protection [76].
- Prepare Scavenging System: Use an oxygen scavenging system such as glucose oxidase and catalase (GOC) in the mounting medium [74].
- Seal the Sample: After mounting, seal the edges of the coverslip with nail polish or a commercial sealant to prevent oxygen diffusion back into the medium.
- Validation: This method is highly effective for fixed samples but is incompatible with live mammalian cells due to disruption of normal physiology [74].
The following workflow diagram integrates these strategies into a practical, step-by-step procedure.
The Scientist's Toolkit: Essential Reagents for Stable Imaging
A successful and robust IF experiment relies on a suite of specialized reagents. The table below details the key materials required for implementing the photobleaching mitigation strategies discussed.
Table 2: Key Research Reagent Solutions for Combating Photobleaching
| Reagent / Material | Function / Purpose | Key Examples & Notes |
|---|---|---|
| Photostable Fluorophores | Engineered dyes that resist photobleaching, allowing for longer and more quantitative imaging. | Alexa Fluor series, Cyanine dyes (e.g., Cy3, Cy5) [74]. Select dyes based on your microscope's laser lines and filter sets. |
| Antifade Mounting Media | Specialized media that preserves fluorescence by scavenging ROS and reducing oxygen. | Commercial products like ProLong Gold, Vectashield. Performance is dye-dependent; testing is recommended [74] [75]. |
| Oxygen Scavenging Systems | Chemically depletes oxygen in the mounting medium, dramatically reducing photobleaching. | Glucose Oxidase/Catalase (GOC) system. Best for fixed samples [74]. |
| Antioxidants | Chemical additives that quench ROS, providing an additional layer of protection. | Ascorbic acid, n-Propyl gallate (nPG). Can be added to mounting media [74]. |
| Neutral-Density (ND) Filters | Microscope filters that uniformly reduce the intensity of excitation light. | A set of ND filters (e.g., 25%, 50%, 75% transmission) is essential for optimizing light levels [75]. |
IHC vs. IF: A Comparative Lens on Signal Stability
The challenge of photobleaching must be contextualized within the broader choice of detection techniques. Immunohistochemistry (IHC), which uses enzyme-based chromogenic detection, offers a stark contrast to IF in terms of signal stability.
- IHC Signal Permanence: IHC relies on enzymes like HRP to catalyze the precipitation of a colored chromogen (e.g., DAB) at the antigen site. This precipitate is highly stable and resistant to degradation by light [17] [10]. The resulting slides can be stored for years and viewed repeatedly on a standard brightfield microscope without signal loss, making IHC the gold standard for clinical diagnostics and archival purposes [17] [10] [78].
- IF Signal Lability: As detailed throughout this guide, IF signals are inherently transient and susceptible to photobleaching. This requires careful handling, specialized equipment, and often digital archiving of images as the primary permanent record [10] [78].
The choice between IHC and IF, therefore, involves a direct trade-off. IHC provides permanent, archivable signals ideal for single-plex biomarker validation and diagnostic workflows. In contrast, IF offers superior multiplexing capability and sensitivity but demands active management of signal stability [17] [10] [78]. For researchers requiring multiplexed data, the strategies outlined herein are not optional but are foundational to achieving data quality that rivals the permanence of IHC.
In the comparative landscape of Immunohistochemistry (IHC) and Immunofluorescence (IF), the discussion often centers on sensitivity, multiplexing capability, and instrumentation [17] [10]. However, the foundational element that underpins the validity of any data generated by either technique is the consistent and correct use of experimental controls. Without proper controls, it is impossible to distinguish specific signal from artifact, compromising data integrity and confounding the accurate comparison of IHC and IF sensitivity [79] [80]. This guide details the essential controls required to generate reliable, interpretable, and publication-quality data for both IHC and IF.
Core Control Experiments: Purpose and Implementation
Controls are designed to answer specific questions about an experiment's validity. The table below summarizes the critical controls for IHC and IF, their shared purposes, and key implementation details.
Table 1: Essential Controls for IHC and IF Experiments
| Control | Primary Purpose | Key Implementation Details | Applicability |
|---|---|---|---|
| Positive Control | Verifies the entire staining protocol is functioning correctly [81] [80]. | A cell or tissue sample known to express the target antigen [81] [82]. | IHC & IF |
| Negative Tissue Control | Identifies non-specific binding and false-positive signals [81] [79]. | A cell or tissue known not to express the target (e.g., knockout samples) [82] [79]. | IHC & IF |
| No-Primary Antibody Control | Confirms observed staining is not caused by non-specific binding of the secondary antibody [81] [79]. | The primary antibody is omitted and replaced with buffer or an isotype control [81] [80]. | IHC & IF (Indirect methods) |
| Isotype Control | Checks that observed staining is not due to non-specific interactions of the immunoglobulin with the tissue [81] [82]. | A non-immune antibody of the same isotype and concentration as the primary antibody is used [81] [80]. | IHC & IF |
| Absorption Control | Demonstrates the specificity of the primary antibody for its target antigen [81] [80]. | The primary antibody is pre-absorbed (blocked) with an excess of its immunizing peptide before application [81] [82]. | IHC & IF |
| Endogenous Background Control | Detects inherent signal in the sample not attributable to antibodies, such as autofluorescence [81] [82]. | The sample is fixed and processed but not incubated with any primary or secondary antibodies before imaging [82] [80]. | Primarily IF |
The relationship between these controls and the experimental workflow is logical and sequential, as illustrated below.
Detailed Experimental Protocols for Key Controls
No-Primary Antibody Control Protocol
This control is critical for indirect IHC and IF methods, where a labeled secondary antibody is used for detection [79].
Workflow:
- Sample Preparation: Begin with serial tissue sections or cultured cell samples on slides. For FFPE tissues, this includes standard steps of deparaffinization, rehydration, and antigen retrieval [8].
- Blocking: Incubate all sections with a blocking solution (e.g., serum or protein block) to minimize non-specific binding.
- Primary Antibody Application:
- Washing: Wash all sections with a buffer like PBS or TBS-T.
- Secondary Antibody & Detection:
- Apply the enzyme-conjugated (for IHC) or fluorophore-conjugated (for IF) secondary antibody to all sections, including the control.
- For IHC, proceed with chromogen development (e.g., DAB) and counterstaining (e.g., hematoxylin) [8] [25].
- For IF, proceed with nuclear counterstaining (e.g., DAPI) and mounting with an anti-fade medium [17].
- Interpretation: The control section should show no specific staining. Any significant signal indicates non-specific binding of the secondary antibody, requiring further optimization of the secondary antibody dilution, blocking solution, or washing stringency [79] [80].
Positive and Negative Tissue Control Protocol
These controls validate the specificity of the primary antibody itself and the overall assay conditions.
Workflow:
- Sample Selection:
- Positive Control: Select a tissue or cell line with well-established, abundant expression of the target protein. Datasheets for validated antibodies often suggest appropriate positive controls [82] [79].
- Negative Control: Use a tissue or cell line known to lack the target protein. Genetically modified knockout cell lines are the gold standard [82] [79].
- Parallel Processing: The positive control, negative control, and experimental unknown samples must be processed in an identical manner. This includes using the same batches of fixative, antibodies, buffers, and detection reagents, and ensuring staining is performed simultaneously [81].
- Staining and Analysis:
- Process all samples through the full IHC or IF protocol.
- Expected Outcome:
- Positive Control: Must show clear, specific staining. A lack of signal indicates a fundamental failure of the protocol or reagent degradation [80].
- Negative Control: Must show an absence of specific staining. The presence of signal indicates the primary antibody is binding non-specifically, and its specificity or concentration must be re-evaluated [81] [79].
Isotype Control Protocol
This control is particularly important when working with monoclonal antibodies.
Workflow:
- Preparation: On a serial section of the experimental sample, apply a non-immune immunoglobulin.
- Application: This immunoglobulin should be of the same isotype (e.g., IgG1, IgG2A), concentration, and host species as the primary antibody of interest [81] [82].
- Processing: The rest of the staining protocol (secondary antibody application, detection, etc.) is followed exactly as for the experimental section.
- Interpretation: The resulting staining from the isotype control represents the background caused by non-specific immunoglobulin-tissue interactions. The specific signal in the experimental section should be distinctly stronger than this background [80].
The Researcher's Toolkit: Essential Reagents and Materials
Table 2: Key Research Reagent Solutions for IHC/IF Controls
| Item | Function in Control Experiments |
|---|---|
| Validated Primary Antibodies | The core reagent for experimental staining; validation for the specific application (IHC or IF) is critical for reliability [10]. |
| Species-Matched Isotype Controls | Non-immune immunoglobulins used in the isotype control to identify antibody-specific background [81] [82]. |
| Blocking Peptides / Immunogens | The specific antigen used to pre-absorb the primary antibody for the absorption control, proving antibody specificity [81] [79]. |
| Pre-adsorbed Secondary Antibodies | Secondary antibodies processed to reduce cross-reactivity with non-target serum proteins, minimizing false positives in the no-primary control [80]. |
| Tissue Microarrays (TMAs) | Slides containing dozens of different tissue cores, invaluable for screening antibody specificity and identifying positive/negative control tissues efficiently [64]. |
| Knockout Cell Lines or Tissues | The gold standard for a negative tissue control, providing definitive evidence of antibody specificity by lacking the target antigen [82] [79]. |
The choice between IHC and IF is dictated by experimental goals—IHC for permanent, archivable samples compatible with brightfield microscopy, and IF for superior multiplexing and sensitivity [17] [10]. However, the reliability of data from both techniques is entirely dependent on rigorous controls. Positive, negative, and no-primary antibody controls are not optional; they are the bedrock of experimental integrity. By systematically implementing these controls, researchers can make confident, accurate comparisons of protein expression and localization, ensuring that their conclusions about sensitivity and application are built on a foundation of validated, trustworthy data.
Validation and Selection: Ensuring Reproducibility and Choosing Your Method
The choice between Immunohistochemistry (IHC) and Immunofluorescence (IF) is a critical decision point in biomedical research, particularly in drug development and diagnostic marker discovery. While both techniques leverage the specific binding of antibodies to antigens to visualize target distribution within biological samples, their underlying detection chemistries create a significant trade-off between morphological clarity and multiplexing capability [17]. The ongoing research thesis on IHC versus IF sensitivity and applications centers on this fundamental compromise. IHC, which uses enzyme-based chromogenic reactions (e.g., DAB) to produce a permanent, colored precipitate [83] [25], excels in preserving tissue context and is the undisputed cornerstone of diagnostic pathology [17] [84]. In contrast, IF, which relies on fluorophore-labeled antibodies emitting light upon excitation [25], provides superior sensitivity, dynamic range, and the unique capacity for multiplexing, making it indispensable for elucidating complex cellular interactions and spatial biology within the tumor microenvironment [10] [3]. This guide provides a detailed, objective comparison to inform researchers and scientists in selecting the optimal technique for their specific experimental goals.
Side-by-Side Technical Comparison
The following parameters are crucial for making an informed decision between IHC and IF. This comparison synthesizes core operational differences with practical experimental considerations.
Table 1: Core Technical and Operational Comparison of IHC vs. IF
| Parameter | Immunohistochemistry (IHC) | Immunofluorescence (IF) |
|---|---|---|
| Detection Chemistry | Enzymatic (e.g., HRP, AP) + chromogen (e.g., DAB) [17] [25] | Fluorophores (e.g., Alexa Fluor dyes) [25] |
| Signal Type | Permanent, colored precipitate [84] | Light emission at specific wavelengths [17] |
| Visualization Instrument | Brightfield microscope [78] | Fluorescence microscope [17] |
| Maximum Markers per Slide (Typical) | 1-2 (single-plex); up to ~5 with multiplex IHC [10] [3] | 2-8 (traditional IF); 10-60+ with ultra-high-plex platforms [10] [3] |
| Sensitivity & Dynamic Range | Moderate [10] | High to Very High [10] [78] |
| Signal Stability | High (permanent, archivable for years) [10] [84] | Moderate (subject to photobleaching; requires digital archiving) [17] [10] |
| Tissue Morphology | Excellent (crisp, intuitive for pathologists) [10] [84] | Good (can be compromised by autofluorescence) [84] |
| Co-localization Studies | Limited [84] | Excellent [10] [84] |
| Typical Turnaround Time | 3-5 days [10] | 5-7 days (longer for complex multiplexing) [10] |
| Relative Cost & Complexity | Lower cost per slide; simpler workflow [78] [59] | Higher cost per slide; requires specialized equipment and expertise [17] [78] |
Table 2: Experimental and Practical Considerations
| Consideration | Immunohistochemistry (IHC) | Immunofluorescence (IF) |
|---|---|---|
| Best Applications | Diagnostic pathology, biomarker validation, studies requiring excellent tissue morphology and permanent records [17] [78] | Multiplexing, spatial biology, co-localization, immune cell phenotyping, tumor microenvironment (TME) analysis [10] [3] [78] |
| Sample Compatibility | Formalin-Fixed Paraffin-Embedded (FFPE) tissues, frozen sections [83] [25] | FFPE tissues, frozen sections, cultured cells, 3D models [59] |
| Key Limitations | Limited multiplexing, lower sensitivity for low-abundance targets, color overlap in multiplexing [10] [78] | Photobleaching, tissue autofluorescence (especially in FFPE), requires specialized and costly equipment [17] [84] |
| Data Output | Visually intuitive, qualitative to semi-quantitative data [59] | Highly quantitative data, suitable for high-content and automated analysis [10] |
Experimental Protocols and Methodologies
The validity of any IHC or IF experiment hinges on robust, reproducible protocols. The following workflows detail the critical steps shared by both techniques, as well as their distinct detection phases.
Diagram 1: Core Experimental Workflow for IHC and IF
Detailed Protocol for Key Steps
Sample Preparation (Shared): For FFPE tissues, fixation in 10% neutral buffered formalin for 24-48 hours is standard to preserve tissue architecture and antigenicity [25]. Antigen Retrieval is a critical step to reverse the cross-links formed by formalin fixation and expose epitopes. This is typically achieved using heat-induced epitope retrieval (HIER) with citrate or Tris-EDTA buffer at a pH of 6.0 or 9.0, optimized for the specific antibody [10] [25]. Blocking with normal serum or a commercial protein block reduces non-specific binding of antibodies [25].
IHC-Specific Detection: After primary antibody incubation, a horseradish peroxidase (HRP)-conjugated secondary antibody is applied. The critical step is the enzymatic reaction where HRP converts the chromogen, 3,3'-Diaminobenzidine (DAB), into an insoluble brown precipitate at the site of antigen-antibody binding [25] [84]. The reaction is stopped by immersing the slides in water. A hematoxylin counterstain is then applied to visualize nuclei, providing crucial morphological context [84].
IF-Specific Detection: Fluorophore-conjugated secondary antibodies (e.g., Alexa Fluor 488, 555, 647) are used for detection. To mitigate photobleaching (the fading of fluorescence upon light exposure), slides must be mounted with an anti-fade mounting medium and stored in the dark [17] [84]. A DAPI counterstain is used to fluorescently label nuclei [25]. A critical quality control step is managing autofluorescence, which can be addressed by using frozen sections, quenching techniques, or signal amplification to overpower the background [84].
The Scientist's Toolkit: Essential Research Reagents and Materials
Successful IHC and IF experiments depend on a suite of reliable reagents and materials. The following table details the core components of the research toolkit.
Table 3: Essential Research Reagent Solutions
| Item | Function/Description | Key Considerations |
|---|---|---|
| Primary Antibodies | Bind specifically to the target antigen of interest. | Clone specificity, validation for IHC/IF and sample type (FFPE/frozen), and recommended dilution are critical [85] [25]. |
| Secondary Antibodies (Conjugated) | Bind to the primary antibody and carry the detection label. | Must be raised against the host species of the primary antibody. Conjugated to enzymes (HRP for IHC) or fluorophores (for IF) [25]. |
| Chromogens (e.g., DAB) | Enzyme substrates that yield a colored, insoluble precipitate in IHC. | DAB is the most common (brown); other colors (red, purple, green) are available for multiplexing [10] [84]. |
| Fluorophores | Fluorescent dyes that emit light upon excitation in IF. | Alexa Fluor dyes are preferred for brightness and photostability. Choice depends on microscope filter availability [10] [84]. |
| Antigen Retrieval Buffers | Solutions used to unmask epitopes cross-linked by fixation. | Citrate (pH 6.0) and Tris-EDTA (pH 9.0) are standard; optimal buffer and pH are antibody-dependent [10] [25]. |
| Blocking Serum | Reduces non-specific antibody binding to minimize background. | Typically normal serum from the species in which the secondary antibody was raised [25]. |
| Counterstains | Provide contrast and visualize cellular structures. | IHC: Hematoxylin (nuclei, blue) [84]. IF: DAPI (nuclei, blue) [25]. |
| Mounting Media | Preserves the sample and prepares it for microscopy. | IHC: Non-aqueous, permanent mounting media [84]. IF: Aqueous-based, anti-fade media to retard photobleaching [17]. |
Decision Matrix and Application Guidance
Selecting between IHC and IF is not a matter of which technique is superior, but which is most appropriate for the specific research question, available resources, and intended data output.
Strategic Decision Pathways
The following diagram outlines the key decision criteria to guide researchers in selecting the optimal technique.
Diagram 2: Decision Workflow for Technique Selection
Application Scenarios
Choose IHC if: Your work is oriented toward diagnostic pathology or requires a permanent, archivable slide record for Good Laboratory Practice (GLP) or regulatory submission [10]. It is also the preferred choice when tissue morphology is paramount for interpretation and when laboratory access is limited to a standard brightfield microscope [78] [84].
Choose IF if: Your research question involves multiplexing three or more markers on a single slide to study complex cell populations or interactions within the tumor microenvironment (TME) [10] [3]. IF is also unequivocally superior for studying the co-localization of proteins within the same cellular compartment and for detecting low-abundance targets due to its higher sensitivity and dynamic range [10] [78] [84].
Combine Techniques: The most powerful approach for a comprehensive analysis often involves using both techniques on sequential tissue sections from the same sample. This strategy can provide complementary data: IHC offers morphological context from an experienced pathologist, while IF delivers deep, multiplexed phenotypic information [17].
For researchers and drug development professionals, the long-term stability of experimental samples is not merely a matter of storage—it is a fundamental requirement for data integrity, regulatory compliance, and longitudinal studies. The choice between immunohistochemistry (IHC) and immunofluorescence (IF) carries significant implications for how biological data is preserved over time. IHC creates permanent physical slides that can be stored for years and are readily compatible with diagnostic workflows and regulatory submissions [10]. In contrast, IF produces signal-labile samples prone to photobleaching, making digital archiving of the acquired images not just beneficial but essential for data preservation [10]. This comparison guide examines the technical foundations, experimental data, and practical considerations of these divergent archival approaches within the broader context of IHC versus IF sensitivity and applications research.
Core Technical Comparison: Physical vs. Digital Preservation
The archival methods for IHC and IF stem from their fundamental detection chemistries. IHC uses enzyme-based chromogenic reactions that precipitate permanent color stains, while IF relies on fluorescent dyes whose signals fade over time.
Table 1: Fundamental Archival Properties of IHC and IF
| Parameter | IHC (Chromogenic) | IF (Fluorescent) |
|---|---|---|
| Detection Chemistry | Enzymes (HRP/AP) + chromogens (DAB, AEC) [10] | Fluorophores (e.g., Alexa Fluor, Cyanine) [23] |
| Signal Nature | Permanent color precipitate [10] | Emitted light (subject to photobleaching) [10] |
| Primary Archival Method | Physical slide storage [10] | Digital image storage [10] |
| Morphology Preservation | Excellent, crisply defined under brightfield [10] | Good, but dependent on imaging quality and tissue thickness [10] |
| Regulatory Acceptance | High, ideal for GLP and diagnostic use [10] | Growing, but requires rigorous validation [3] |
IHC: The Paradigm of Physical Permanence
IHC leverages chromogenic substrates like 3,3'-Diaminobenzidine (DAB) that form highly stable, insoluble precipitates at the antigen site [11]. This reaction creates a permanent chemical record resistant to fading, allowing slides to be re-examined decades later with standard brightfield microscopy. This permanence is a key reason IHC remains the gold standard in clinical diagnostics and histopathology [8].
IF: The Necessity of Digital Migration
IF signals are inherently ephemeral. Fluorophores undergo photobleaching upon repeated exposure to excitation light, leading to irreversible signal loss [10] [23]. While mounting media can slow this process, it cannot prevent it indefinitely. Consequently, the archival value of IF experiments shifts from the physical slide to the digitally acquired image, making robust digital pathology infrastructure critical [86].
Quantitative Data and Experimental Evidence
Table 2: Comparative Archival Performance Data
| Metric | IHC | IF | Source / Context |
|---|---|---|---|
| Signal Stability Duration | Years to decades (physical slide) [10] | Moderate (digital archive recommended) [10] | iHisto Comparison |
| Multiplexing Capacity | 1-2 markers by default [10] | 2-8+ markers (Traditional IF); Up to 60 (Ultra-high-plex) [10] | iHisto & Abcam Guides |
| Typical Turnaround Time | 3-5 days [10] | 5-7 days (Standard); 7-10 days (Ultra-high-plex) [10] | iHisto Averages |
| Sensitivity / Dynamic Range | Moderate [10] | High to Very High [10] | iHisto Comparison |
| AI-Based Classification Accuracy | Pooled sensitivity: 0.97, specificity: 0.82 (for HER2 1+/2+/3+ vs. 0) [87] | Not explicitly quantified in search results for archival | Meta-analysis, npj Digital Medicine |
The high sensitivity and specificity of AI applied to IHC slides, as demonstrated in HER2 scoring, underscore the enduring analytical value of well-preserved physical samples [87]. For IF, the stability of the digital archive is paramount. Whole-slide imaging (WSI) scanners create these archives by digitizing entire slides at high resolution, typically at 20x or 40x magnification [86]. A key consideration is that "doubling the magnification from a 20x scan to 40x increases the file size by approximately 4 times," impacting storage solutions [86]. The JPEG2000 compression standard is commonly used to manage these large file sizes without significantly affecting subsequent morphological analysis [86].
Methodological Workflows: From Staining to Archiving
The following workflows detail the standard pathways for creating and preserving IHC and IF data, highlighting critical steps that impact archival outcomes.
Detailed IHC Protocol for Permanent Slides
1. Tissue Sectioning and Preparation:
- Use 4 µm thick sections for optimal morphology and light transmission [10].
- Employ formalin-fixed, paraffin-embedded (FFPE) tissues or frozen sections with appropriate fixation (e.g., 10% neutral buffered formalin) to preserve antigenicity and tissue architecture [11].
2. Chromogenic Staining:
- Perform antigen retrieval using citrate or EDTA-based buffers suitable for the target epitope [10].
- Apply primary antibody followed by enzyme-conjugated secondary antibody (e.g., HRP-polymer) [23].
- Develop signal with DAB chromogen, which produces an insoluble, stable brown precipitate [23] [11].
- Counterstain with hematoxylin to provide nuclear detail [11].
3. Slide Preservation:
- Dehydrate slides through graded alcohols and xylene to remove all moisture.
- Coverslip using a permanent, non-aqueous mounting medium.
- Store slides in dark, low-humidity conditions at room temperature; properly stored DAB-stained slides are stable for decades [10].
Detailed IF Protocol with Digital Archiving
1. Tissue Sectioning and Preparation:
- Use slightly thicker sections (5-7 µm) to preserve tissue integrity during multiple staining/imaging cycles [10].
- Optimize fixation to reduce autofluorescence (e.g., avoid glutaraldehyde) [11].
2. Fluorescence Staining:
- Apply fluorophore-conjugated primary antibodies or use secondary detection with highly cross-adsorbed antibodies to minimize non-specific binding [23].
- For multiplexing, carefully select fluorophores with minimal spectral overlap (e.g., Alexa Fluor series) and validate using controls [23].
- Use antifade mounting media to retard photobleaching.
3. Digital Archiving via Whole-Slide Imaging:
- Use a calibrated digital slide scanner with a fluorescence module [86].
- Acquire images at 20x magnification for most analyses, or 40x for high-resolution needs, recognizing the 4x file size increase [86].
- For multiplex IF, employ spectral unmixing to distinguish overlapping fluorophores [3] [86].
- Save images in standard formats (e.g., TIFF or proprietary formats with JPEG2000 compression) and implement a secure, backed-up digital storage system with metadata tracking [86].
The Scientist's Toolkit: Essential Reagent Solutions
Table 3: Key Reagents for IHC and IF Archival Workflows
| Reagent / Material | Function | Application Notes |
|---|---|---|
| DAB (3,3'-Diaminobenzidine) | Chromogen for IHC producing an insoluble, permanent brown precipitate [23]. | The gold standard for permanent IHC archives; requires careful handling as a suspected carcinogen [11]. |
| HRP-Polymer System | Signal amplification method for IHC linking multiple enzyme molecules to a dextran backbone [23]. | Increases sensitivity without biotin-avidin systems, reducing background; ideal for permanent archives. |
| Tyramide Signal Amplification (TSA) | Highly sensitive enzymatic amplification for IF using HRP to deposit fluorophore-tyramide conjugates [23]. | Enables high-plex IF; the covalent deposition is more stable than standard IF but still requires digital archiving. |
| Antifade Mounting Medium | Aqueous mounting medium containing reagents that slow fluorophore photobleaching [23]. | Critical for prolonging the usable life of physical IF slides before and during imaging. |
| JPEG2000 Compression | A compression standard based on discrete wavelet transforms [86]. | The current standard for compressing whole-slide images, balancing file size reduction with data preservation for digital archives. |
The choice between IHC's physical archival and IF's digital archival is not a matter of superiority but of strategic alignment with research goals, infrastructure, and regulatory needs.
Choose IHC for Physical Archival When: Your research requires permanent, regulatorily-compliant physical evidence [10], you need to maintain compatibility with standard pathological assessment using brightfield microscopy [10] [8], your multiplexing needs are limited (1-2 markers) [10], or your laboratory lacks sophisticated fluorescence imaging infrastructure [10].
Choose IF with Digital Archival When: Your research questions demand high-plex biomarker detection (3+ markers) on a single tissue section [10], you are investigating spatial relationships within the tumor microenvironment [10] [3], you have access to fluorescence imaging systems and computational analysis tools [10], and you can implement a robust digital pathology infrastructure for long-term data management [86].
For the most complex research questions, a hybrid approach may be optimal: using IHC for key archival markers and leveraging IF's multiplexing power for deep phenotypic analysis, with the understanding that the IF data must be diligently digitized and stored to ensure its long-term scientific value.
For researchers and drug development professionals navigating the choice between Immunohistochemistry (IHC) and Immunofluorescence (IF), the cost-benefit analysis extends beyond the simple upfront cost per slide. While IHC often presents a lower initial cost per slide, IF typically delivers a significantly lower cost per marker in multiplexed studies, offering greater data density and richer biological insights for the investment. The decision ultimately hinges on the specific experimental goals, required multiplexing capability, and available laboratory infrastructure.
In biomedical research and diagnostic development, IHC and IF are cornerstone techniques for visualizing protein distribution within tissues. IHC uses enzymes like Horseradish Peroxidase (HRP) to produce a colored precipitate at the antigen site, visible under a standard brightfield microscope. [25] In contrast, IF utilizes fluorochrome-conjugated antibodies that emit light at specific wavelengths when excited by special lighting, requiring a fluorescence microscope for detection. [17] [25] A common misconception is that the technique with the lower sticker price per slide is more economical. However, the true cost efficiency is revealed when calculating the cost per marker, a metric that becomes critically important in studies requiring the simultaneous detection of multiple targets, such as in complex tumor microenvironment analyses.
Quantitative Cost Comparison: A Tale of Two Metrics
The most straightforward cost comparison lies in the upfront expenses associated with preparing and staining a single slide.
- IHC: Generally has a lower upfront cost per slide. Staining is typically performed for 1-2 markers per slide, and the process can be completed with standard laboratory equipment. [10]
- IF: Carries a moderate to high upfront cost per slide. This is due to the need for specialized and often expensive fluorescence microscopy equipment, and fluorophores that are prone to photobleaching, potentially requiring digital archiving. [17] [10]
However, the economic landscape shifts dramatically when the experimental goal requires detecting multiple proteins. The following table breaks down the key cost and performance metrics.
Table 1: Direct Comparison of IHC and IF Based on Cost and Performance Metrics
| Feature | IHC | IF (2–8‑plex) | Ultra-high-plex IF (10–60 plex) |
|---|---|---|---|
| Max markers/slide | 1–2 markers | 2–8 markers | 10–60 markers [10] |
| Upfront Cost / Slide | Low | Moderate to High | High [10] |
| Cost per Marker | Higher for multiplexing | Lower for multiplexing | Lowest at high plex [10] |
| Signal Stability | Permanent, archivable [17] [10] | Moderate (photobleaching risk) [17] | Moderate (software‑corrected) [10] |
| Equipment Needed | Brightfield microscope [10] | Fluorescence microscope [17] [10] | Advanced scanner + AI analytics [10] |
Analysis: While a single-plex IHC slide is cheaper than a multiplex IF slide, the cost per marker for IHC increases linearly with each additional target because each marker requires a separate slide and staining process. IF, by contrast, allows for the detection of multiple markers on a single slide. Therefore, for a study aiming to detect 6 different markers, it would require 3-6 individual IHC slides, multiplying the cost of reagents, labor, and precious sample. The same data could be captured on a single IF slide, drastically reducing the cost per marker and conserving limited tissue samples. [10]
Experimental Protocols: Validating Sensitivity and Quantification
The cost discussion is intrinsically linked to performance, particularly sensitivity and quantification, which can affect the overall value of the data obtained.
Protocol for Quantitative Immunofluorescence (QIF) Standardization
Objective: To standardize QIF for linear and reproducible protein quantification, achieving results comparable to mass spectrometry. [88]
Methodology:
- Tissue Microarray (TMA) Construction: Representative tumor areas or cell line pellets are formalin-fixed and paraffin-embedded (FFPE) and arrayed into a recipient block. [88]
- Antibody Titration: The primary antibody (e.g., EGFR D38B1) is tested at multiple concentrations (e.g., five dilutions covering two orders of magnitude) on serial TMA sections. [88]
- Signal-to-Noise Optimization: A titration curve is plotted using the average signal from the highest 10% of scores and the noise from the lowest 10% of scores in patient tumors. The concentration with the highest signal-to-noise ratio is defined as the objectively optimal titer. [88]
- Multiplex Staining: Slides are deparaffinized, and antigen retrieval is performed. They are then incubated with a cocktail of primary antibodies (e.g., the target antibody and a cytokeratin antibody to define an epithelial mask). [88]
- Detection and Quantification: A mixture of fluorescently-labeled secondary antibodies and tyramide signal amplification (e.g., Cy5-tyramide) is applied. Nuclei are counterstained with DAPI. Quantitative measurement is performed using an automated platform (e.g., AQUA method), which calculates a continuous protein expression score based on fluorescent pixel intensity per unit area within the defined compartment. [88]
Supporting Data: A study measuring EGFR in 15 cell lines demonstrated that when the primary antibody was used at its optimal signal-to-noise concentration, QIF scores showed a strong linear regression (R²=0.88) with absolute EGFR concentration measured by mass spectrometry. [88]
Protocol for Enhancing IHC Sensitivity with Microagitation
Objective: To improve the sensitivity and reproducibility of classical IHC, allowing for higher antibody dilutions and reducing reagent costs. [89]
Methodology:
- Sample Preparation: Consecutive paraffin sections of biopsies (e.g., non-melanoma skin cancer) are mounted on slides. [89]
- Immunostaining with Agitation: The IHC procedure is carried out with the addition of constant microagitation during antibody incubation steps, compared to a static classical IHC protocol. [89]
- Analysis: Reproducibility is assessed in independent experiments using antibodies against markers like Ki-67 and p53. Analytical sensitivity is determined by performing serial antibody dilutions. [89]
Supporting Data: Research found that IHC with microagitation was highly reproducible and produced no background staining. Crucially, primary antibodies could be used at 4 to 10 times higher dilutions compared to classical IHC without compromising signal, directly reducing the cost per stain. [89]
Visualizing the Cost-Benefit Decision Pathway
The following diagram outlines the logical decision process a researcher might follow when choosing between IHC and IF based on their project's needs and constraints.
Diagram 1: Technique Selection Workflow. This flowchart guides researchers through key questions regarding archiving needs, equipment, multiplexing requirements, and cost priorities to determine the most suitable method.
The Scientist's Toolkit: Essential Research Reagent Solutions
The successful implementation of either IHC or IF relies on a suite of critical reagents and materials. The following table details key components and their functions.
Table 2: Essential Reagents and Materials for IHC and IF Experiments
| Item | Function | Application Notes |
|---|---|---|
| Formalin-Fixed Paraffin-Embedded (FFPE) Tissue | Preserves tissue morphology and architecture for long-term storage and sectioning. [1] | The standard for clinical pathology; may require antigen retrieval. [1] |
| Primary Antibodies | Bind specifically to the target antigen of interest. | Must be validated for IHC or IF; specificity is paramount. [90] [88] |
| Chromogenic Substrate (e.g., DAB, AEC) | Enzyme (HRP/AP) converts substrate to an insoluble colored precipitate for visualization. [1] [25] | Used in IHC; produces a permanent stain. [17] |
| Fluorochrome-Conjugates (e.g., Alexa Fluor dyes) | Emit light at specific wavelengths upon excitation for detection. [25] | Used in IF; allows for multiplexing; prone to photobleaching. [17] |
| Antigen Retrieval Buffer (e.g., Citrate, Tris-EDTA) | Unmasks epitopes cross-linked by formalin fixation, restoring antibody binding. [1] | Critical step for most FFPE-IHC and IF protocols (Heat-Induced Epitope Retrieval). [1] |
| Blocking Solution (e.g., BSA, serum) | Reduces non-specific background binding of antibodies. [88] | Improves signal-to-noise ratio in both IHC and IF. |
| Automated Staining Platform | Provides run-to-run consistency and standardized staining conditions. [10] | Available for both IHC and multiplex IF; improves reproducibility. |
The choice between IHC and IF is not a matter of identifying a universally superior technique, but of selecting the right tool for the specific research question and economic constraints.
- Choose IHC when your primary needs involve diagnostic pathology, generating permanent archival slides, working with limited budgets that prioritize lower upfront cost per slide, and when the target is limited to 1-2 markers. [17] [10]
- Choose IF when your research demands multiplexing (3 or more markers), requires high sensitivity and superior spatial resolution for co-localization studies, or aims to deeply characterize complex cellular environments like the tumor immune microenvironment. Despite a higher initial slide cost, IF provides a significantly lower cost per marker and richer data density. [17] [10] [91]
For the modern researcher, the flexibility of combining both techniques on sequential sections or even on the same slide can provide complementary information, offering a comprehensive view of the biological system under investigation. [17]
Quality Control and Assay Validation for Reproducible Results
In the comparative analysis of Immunohistochemistry (IHC) and Immunofluorescence (IF), the rigor of quality control (QC) and assay validation emerges as the fundamental determinant of data reliability and reproducibility. Both techniques exploit antibody-antigen interactions to visualize protein distribution within tissues, but their distinct detection chemistries—chromogenic for IHC and fluorescent for IF—demand tailored validation strategies [17] [25]. Inconsistent validation practices and the omission of appropriate controls have been significant contributors to the reproducibility crisis in biomedical research, underscoring that without rigorous validation, even the most sophisticated techniques yield unreliable results [92] [93]. This guide objectively compares the QC and validation frameworks for IHC and IF, providing researchers with the experimental protocols and benchmarks necessary to generate robust, interpretable, and reproducible data.
Core Principles of Assay Validation
Assay validation is the process of demonstrating that a test method is fit for its intended purpose, establishing its performance characteristics under set conditions. For both IHC and IF, this process is built upon several key pillars that confirm the assay's accuracy, sensitivity, and specificity.
Accuracy and Specificity
The core of any immunostaining assay is its ability to bind specifically to the target antigen without cross-reactivity. Accuracy is confirmed by comparing results with a known standard or another validated method. Specificity is primarily controlled through the use of well-characterized antibodies and a panel of control samples [92] [94].
Sensitivity and Limit of Detection
Sensitivity refers to the lowest concentration of an antigen that can be reliably detected by the assay. The limit of detection is established by testing serial dilutions of the primary antibody on tissues or cell lines with known, varying expression levels of the target antigen. The optimal dilution is the one that provides a strong specific signal with minimal background noise [10] [11].
Precision and Reproducibility
Precision, or reproducibility, measures the assay's consistency across different runs, days, operators, and instruments. This is a critical parameter for assays used in long-term studies or multi-center trials. Key factors affecting precision include antibody lot-to-lot variation, staining platform performance, and antigen retrieval consistency [3] [93].
IHC vs. IF: Validation Requirements and Challenges
The choice between IHC and IF directly influences the validation pathway, as their technical differences introduce distinct advantages and challenges for quality control.
Table 1: Key Comparative Parameters for IHC and IF Validation
| Parameter | Immunohistochemistry (IHC) | Immunofluorescence (IF) |
|---|---|---|
| Detection Chemistry | Chromogenic enzymes (HRP/AP) producing colored precipitates [17] | Fluorophores excited by specific wavelengths to emit light [17] [25] |
| Signal Stability | High; permanent, archivable slides [17] [10] | Moderate; susceptible to photobleaching, requires digital archiving [17] [10] |
| Multiplexing Capacity | Low; typically 1-2 markers per slide [10] | High; 2-8 markers for traditional IF, 10-60 with ultra-high-plex platforms [10] [3] |
| Primary Equipment | Brightfield microscope [17] [8] | Fluorescence microscope [17] |
| Key Validation Challenge | Color deconvolution in multiplex assays; enzyme activity variability [3] | Spectral unmixing in multiplex assays; fluorophore bleed-through; photobleaching [3] |
| Common QC Artifacts | High background from endogenous enzymes [94] | Autofluorescence from tissue components (e.g., collagen, lipofuscin) [94] |
Experimental Protocols for Validation
Implementing a standardized validation protocol is non-negotiable for generating reliable data. The following sections detail the essential steps and requirements.
Assay Validation Guidelines and Sample Sizes
Evidence-based guidelines provide a framework for validation. The College of American Pathologists (CAP) updated its guidelines in 2024, harmonizing requirements for predictive markers and providing new direction for cytology specimens [95].
Table 2: Analytic Validation Case Requirements Based on CAP Guidelines
| Assay Type | Minimum Number of Cases | Concordance Requirement | Key Considerations |
|---|---|---|---|
| New IHC Assay (General) | Typically 20-60 cases [93] | ≥ 90% for predictive markers [95] | Cases should span a range of antigen expression (negative, weak, moderate, strong) [93]. |
| Predictive Marker Assay | Sufficient to achieve statistical confidence | ≥ 90% concordance with a validated comparator [95] | Each unique assay-scoring system combination (e.g., PD-L1 in different cancers) must be validated separately [95]. |
| IHC on Cytology Specimens | 10 positive and 10 negative cases [95] | Comparable to original validation | Required when fixation methods differ from the original FFPE tissue validation [95]. |
The Essential Panel of Controls
Controls are the internal checks that safeguard an experiment from false positives and misleading interpretations. Their consistent use is a cornerstone of rigorous science [92] [94].
The workflow for a validated IHC or IF experiment is underpinned by a panel of controls that run in parallel to the experimental samples. A positive tissue control confirms the entire staining protocol is functioning correctly [94]. Negative controls, including tissues known not to express the target or—ideally—genetically engineered knockout (KO) or knockdown (KD) samples, identify non-specific binding and false positives [92] [94].
The no primary antibody control (secondary antibody only) is critical for detecting nonspecific binding of the secondary antibody or background from the detection system itself [94]. For monoclonal antibodies, an isotype control (an antibody of the same class and host species but irrelevant specificity) run at the same concentration as the primary antibody is used to confirm that staining is not due to nonspecific Fc receptor or protein interaction [92] [94]. Finally, an endogenous background control (an unstained section) is examined to identify inherent signals like autofluorescence, which is particularly crucial for IF [94].
Antibody Validation and Specificity
With over 2 million antibodies commercially available from more than 300 companies, antibody validation is a critical first step [92]. Key strategies include:
- Biochemical Specificity: Using western blotting under denaturing conditions to confirm the antibody recognizes a single band at the expected molecular weight. This is the most common validation method [92].
- Orthogonal Validation: Correlating IHC or IF results with another non-immunohistochemical method, such as fluorescent in-situ hybridization (FISH) or mass spectrometry [95] [3].
- Independent Antibodies: Using two antibodies raised against different epitopes on the same target protein. Similar staining patterns provide strong evidence of specificity [92].
Advanced Considerations: Multiplex Assay Validation
Multiplex IHC/IF (mIHC/IF) allows for the simultaneous detection of multiple markers on a single tissue section, enabling complex immunophenotyping and spatial analysis [3]. However, this power introduces additional layers of complexity to the validation process.
Unique Challenges in Multiplexing
The primary challenges in multiplex assay validation include antibody cross-talk, the need for sophisticated image analysis, and ensuring reproducible results across batches and institutions [3]. Each antibody in the panel must be optimized individually and then in combination with others to ensure that staining conditions (e.g., antigen retrieval) do not compromise the detection of other targets. Furthermore, validation must confirm that the assay can accurately assign phenotypes at single-cell resolution.
Image Analysis and Data Management
For mIHC/IF, the digital image processing pipeline is as critical as the staining protocol and must be rigorously validated. Key steps requiring quality assurance include:
- Image Acquisition: Using calibrated scanners and ensuring well-focused images with minimal tiling artifacts [3].
- Spectral Unmixing (IF) and Color Deconvolution (IHC): Essential for accurately assigning marker expression in multiplexed images by separating overlapping signals [3].
- Tissue and Cell Segmentation: The process of identifying individual cells and tissue compartments, which must be verified for accuracy [3].
- Batch Effect Correction: Implementing measures to correct for technical variation between different staining or scanning batches [3].
The Scientist's Toolkit: Essential Research Reagent Solutions
The following table details key reagents and materials essential for implementing a rigorous QC and validation protocol for IHC and IF assays.
Table 3: Essential Research Reagents for QC and Validation
| Reagent / Material | Function in QC/Validation | Key Considerations |
|---|---|---|
| Validated Primary Antibodies | Specifically binds the target antigen. | Check datasheet for supported applications; validate specificity via western blot or KO tissue [92] [11]. |
| Positive Control Tissue | Verifies the entire staining protocol is working. | Select tissue known to express the target antigen from literature or antibody datasheet [94]. |
| Knockout (KO) Tissue | The optimal negative control to confirm antibody specificity. | Genetically modified tissue lacking the target gene provides definitive evidence of non-specific staining [92] [94]. |
| Isotype Control Antibody | Controls for nonspecific binding of the primary antibody. | Must match the host species, isotype, clonality, and conjugation of the primary antibody [94]. |
| Secondary Antibodies | Amplifies signal by binding to the primary antibody. | Must be highly cross-adsorbed to minimize non-specific binding; validate with a "no primary" control [94] [25]. |
| Detection Kits (Chromogenic/Fluorescent) | Generates the visible signal (color precipitate or light). | For IHC, choose HRP or AP enzymes with compatible substrates (e.g., DAB). For IF, select fluorophores with non-overlapping emission spectra [25] [11]. |
| Antigen Retrieval Reagents | Unmasks epitopes cross-linked by formalin fixation. | Citrate (pH 6.0) and Tris-EDTA (pH 9.0) are common buffers; optimal conditions must be empirically determined for each antibody [11]. |
| Blocking Serum | Reduces non-specific background staining. | Typically from the same species as the secondary antibody; or use protein blocks like BSA [11]. |
A rigorous and methodical approach to quality control and assay validation is non-negotiable for producing reliable IHC and IF data that advances scientific understanding and drug development. While IHC offers stability and simplicity, IF provides superior multiplexing capabilities and sensitivity; however, the technical advantages of either method are meaningless without a robust foundation of validation. By adhering to evidence-based guidelines, implementing a comprehensive panel of controls, validating antibodies stringently, and applying specialized analysis to multiplex assays, researchers can ensure their findings are accurate, reproducible, and impactful.
The fields of immunohistochemistry (IHC) and immunofluorescence (IF) are undergoing a profound transformation, moving beyond standalone techniques to become integrated components of sophisticated computational pathology platforms. For researchers and drug development professionals, this evolution is critical: the choice between IHC and IF is no longer merely about chromogens versus fluorophores, but about selecting an entire data generation ecosystem compatible with artificial intelligence (AI) and computational analysis. Traditional IHC, visualized through chromogenic substrates like DAB and viewed with brightfield microscopy, has long been the clinical workhorse, offering permanent slides and familiarity to pathologists [8]. In contrast, IF, utilizing fluorophore-labeled antibodies and fluorescence microscopy, provides superior multiplexing capabilities and quantitative potential but has faced challenges in clinical adoption due to fluorescence fading and limited compatibility with routine histology [96] [64]. Today, this dichotomy is dissolving through digital pathology and AI, enabling a new era where multimodal data from both techniques can be fused to create predictive biomarkers with unprecedented power, fundamentally altering the landscape of diagnostic research and therapeutic development [64].
Performance Comparison: IHC vs. Immunofluorescence in the Digital Age
The relative performance of IHC and IF is increasingly measured by their compatibility with quantitative digital analysis and their ability to answer complex biological questions. The table below summarizes key comparative metrics based on current literature and technological capabilities.
Table 1: Comparative Analysis of IHC and Immunofluorescence in Modern Research Contexts
| Feature | Immunohistochemistry (IHC) | Immunofluorescence (IF) |
|---|---|---|
| Core Principle | Antibody-antigen binding visualized with a chromogenic enzyme substrate (e.g., DAB) [8]. | Antibody-antigen binding visualized with a fluorescent dye (e.g., FITC, ArgoFluors) [97] [64]. |
| Typical Multiplexing Capacity | Lower (3-5 markers) with conventional methods [3]. | Higher (5-60+ markers) with cyclical staining or one-shot imaging [3] [64]. |
| Quantitative Potential | Good, but can be limited by chromogen overlap; enabled by digital image analysis [98]. | Excellent, due to spectral separability; inherently suited for software-based quantification [98] [97]. |
| Sensitivity in Diagnostic Studies | 77.8% sensitivity for IgG in Pemphigus Vulgaris diagnosis [99]. | 77.8% sensitivity for ANA in SLE diagnosis via indirect IF; considered the gold standard for this application [100]. |
| Compatibility with Routine H&E | Excellent; can be performed on sequential sections or, with platforms like Orion, on the same tissue section post-imaging [64]. | Challenging with conventional workflows due to fluorescence; however, new platforms enable H&E staining after IF cycling [64]. |
| Primary Data Output | RGB color image under brightfield microscopy [8]. | Multispectral or multiple-channel grayscale image under fluorescence microscopy [3]. |
| Key Digital Analysis Step | Color deconvolution to separate hematoxylin and chromogen signals [98] [3]. | Spectral unmixing to separate overlapping fluorophore emission spectra [3]. |
| Impact of AI Integration | AI can enhance precision, e.g., improving HER2-low scoring agreement among pathologists from 73.5% to 86.4% [101]. | AI enables complex spatial analysis, e.g., predicting immunotherapy outcomes in NSCLC by quantifying cellular interactions [101]. |
Experimental Protocols for Integrated Analysis
To harness the full potential of these technologies, researchers are developing robust experimental workflows that combine high-plex data acquisition with rigorous computational analysis.
Multimodal Whole-Slide Imaging: The Orion Protocol
The Orion platform exemplifies the trend of acquiring maximal data from a single tissue section. This methodology allows for direct, same-cell comparison of high-plex molecular information and traditional H&E morphology [64].
- Tissue Preparation: Formalin-fixed, paraffin-embedded (FFPE) tissue sections are mounted on standard slides.
- Multiplex Immunofluorescence Staining: Tissues are stained with a panel of antibodies (e.g., 16-18 markers) conjugated to carefully selected, spectrally distinct ArgoFluor dyes. Panels typically include lineage markers (CD4, CD8, CD68, cytokeratin), immune checkpoint regulators (PD-1, PD-L1), and cell state markers (Ki-67) [64].
- One-Shot Fluorescence Imaging: Slides are imaged using the Orion instrument, which employs seven lasers and tunable optical filters to simultaneously capture all fluorescent channels across the entire slide. Raw images are processed to correct for optical aberrations and to perform spectral extraction, isolating the signal for each individual fluorophore [64].
- Fluorophore Bleaching: After IF imaging, fluorophores are chemically bleached to remove fluorescent signal.
- H&E Staining and Imaging: The same tissue section is then stained with H&E using a standard clinical stainer and digitized using a high-quality slide scanner. Pathologists have assessed these post-Orion H&E images as "diagnostic grade" and indistinguishable from conventional H&E [64].
- Data Integration and Analysis: Images are processed through computational pipelines (e.g., MCMICRO software) for cell segmentation, feature extraction, and spatial analysis. This creates a unified data set where each cell has both multiplex protein expression data and H&E-based morphological context [64].
AI-Enhanced Predictive Biomarker Development
A pivotal application of integrated platforms is the development of AI-based biomarkers for predicting clinical outcomes, as demonstrated in colorectal cancer (CRC) [64] and non-small cell lung cancer (NSCLC) [101].
- Cohort Selection: A retrospective cohort of patients with known clinical outcomes, such as progression-free survival, is assembled (e.g., 74 CRC resections) [64].
- Whole-Slide Digitization: H&E and, if applicable, multiplex IF whole-slide images are generated for all specimens.
- Region of Interest (ROI) Selection: ROIs may be selected by pathologists based on tumor regions, invasive margins, and stromal areas. Alternatively, whole-slide analysis can be performed to avoid selection bias [3].
- Feature Extraction: From the digital images, features are extracted. These can be:
- H&E-based ML/AI features: Models trained to identify architectural patterns and cellular morphologies [64].
- Spatial Biomarkers from IF: Quantification of immune cell densities, tumor-immune spatial relationships, and complex cellular interactions (e.g., between tumor cells, fibroblasts, and T-cells) [101] [64].
- Model Training and Validation: Machine learning models are trained to integrate the H&E and multiplex IF features to predict the clinical endpoint. The model is then validated on an independent, held-out test cohort or an external cohort to ensure generalizability [64]. For instance, a multimodal model in CRC achieved a 10- to 20-fold discrimination between rapid and slow progression [64].
Table 2: Key Research Reagent Solutions for Advanced Multiplex Imaging
| Reagent / Solution | Function in Experimental Workflow |
|---|---|
| ArgoFluor Dyes [64] | A suite of 18 spectrally distinct, stable fluorophores conjugated to antibodies for high-plex, one-shot immunofluorescence imaging. |
| Tissue Microarrays (TMAs) [64] | Slides containing multiple small tissue specimens used for efficient antibody validation and cohort screening prior to whole-slide studies. |
| MCMICRO Software [64] | An open-source computational pipeline for processing whole-slide images, performing cell segmentation, feature extraction, and single-cell analysis. |
| Foundation Models [101] | AI models pre-trained on vast datasets of whole-slide images (e.g., >58,000 WSIs) that can be fine-tuned for specific tasks, democratizing AI development. |
| Quantitative Continuous Scoring (QCS) [101] | A computational pathology solution that generates a continuous score from IHC stains, used as an AI-derived biomarker for patient selection in clinical trials. |
| Spectral Unmixing Algorithms [3] | Computational methods required for multiplex IF to disentangle the overlapping emission spectra of different fluorophores within a tissue sample. |
The Role of AI and Machine Learning in Bridging Techniques
Artificial intelligence is the cornerstone that unlocks the value of integrated analysis platforms, transforming images into quantifiable, predictive data.
From Visual Scoring to Digital Quantification
Traditional pathology relies on semi-quantitative, subjective visual scoring, which carries significant inter-observer variability [98]. Digital image analysis software like ImageJ and QuPath enables more objective and reproducible quantification of both IHC and IF staining intensity [98]. Studies show almost perfect agreement between observers when using these software tools compared to substantial agreement with light microscopy alone [98]. AI further augments this by automating complex tasks, such as identifying HER2-low and ultralow breast cancer cases, thereby improving diagnostic agreement between pathologists and potentially expanding access to targeted therapies [101].
Spatial Biology and Predictive Modeling
The true power of AI lies in its ability to discern complex, multivariate patterns invisible to the human eye. In advanced NSCLC, AI models can analyze the spatial relationships between tumor cells, fibroblasts, T-cells, and neutrophils from H&E or multiplex IF images to predict response to immunotherapy, significantly outperforming traditional biomarkers like PD-L1 expression alone [101]. Furthermore, multimodal AI (MMAI) integrates H&E image features with clinical data (e.g., age, PSA levels) to predict long-term outcomes, such as metastasis in prostate cancer patients, providing a more accessible and cost-effective prognostic tool than complex molecular assays [101].
The workflow below illustrates how AI integrates data from various digital pathology sources to support research and clinical decisions.
AI-Driven Integrated Analysis Workflow
The future of pathology is unequivocally digital, multimodal, and AI-driven. The historical debate comparing IHC and IF sensitivity is evolving into a strategic discussion on how to best integrate these complementary techniques within a unified computational framework. Platforms that enable same-section H&E and high-plex IF imaging, coupled with validated AI analysis tools, are demonstrating the ability to generate biomarkers with exceptional predictive power for patient outcomes and treatment response [64]. For researchers and drug developers, this means that investment must now extend beyond optimizing individual staining protocols to encompass data science infrastructure, algorithm validation, and the development of standardized, scalable workflows. As foundation models and multimodal AI continue to mature, they promise to further democratize access to powerful analytical tools, accelerating the transition of these integrated platforms from research curiosities to essential components of precision medicine and oncology drug development [101] [96]. The toolkit for the modern scientist is no longer just antibodies and microscopes, but also digital slide scanners, computational pipelines, and AI models that together are reshaping our understanding of disease biology.
Conclusion
IHC and IF are not mutually exclusive but rather complementary techniques that form the cornerstone of modern spatial biology. IHC remains the gold standard for clinical diagnostics and single-marker studies requiring permanent, archivable records. In contrast, IF excels in research demanding high sensitivity, multiplexing, and detailed spatial analysis of complex environments like the tumor microenvironment. The choice between them hinges on the specific research question, required multiplexing level, available equipment, and budget. The future of both techniques is being shaped by integration with digital pathology and AI, which enhances quantitative analysis, standardization, and the discovery of complex biomarkers, ultimately accelerating progress in biomedical research and therapeutic development.
References
- 1. Overview of Immunohistochemistry (IHC) [https://www.thermofisher.com/us/en/home/life-science/protein-biology/protein-biology-learning-center/protein-biology-resource-library/pierce-protein-methods/overview-immunohistochemistry.html]
- 2. An introduction to Performing Immunofluorescence Staining [https://pmc.ncbi.nlm.nih.gov/articles/PMC6918834/]
- 3. Society for Immunotherapy of Cancer - PubMed Central - NIH [https://pmc.ncbi.nlm.nih.gov/articles/PMC11749220/]
- 4. Leading multiplex immunofluorescence chemistries for ... [https://www.zeiss.com/microscopy/en/about-us/newsroom/press-releases/2025/multiplex-immunofluorescence-chemistries.html]
- 5. Intro to Immunohistochemistry (IHC) Staining: Steps & Best ... [https://www.leicabiosystems.com/us/knowledge-pathway/immunohistochemistry-an-overview-steps-to-better-ihc-staining/]
- 6. Immunofluorescence Staining | A Typical Workflow [https://ibidi.com/content/365-immunofluorescence-staining-a-typical-workflow]
- 7. Comparison of commercial and in-house tissue-based and ... [https://www.frontiersin.org/journals/immunology/articles/10.3389/fimmu.2025.1563877/full]
- 8. Review of immunohistochemistry techniques: Applications, ... [https://www.sciencedirect.com/science/article/abs/pii/S0740257024000467?utm_source=chatgpt.com]
- 9. Immunohistochemistry Market Research 2025 [https://finance.yahoo.com/news/immunohistochemistry-market-research-2025-global-080700033.html]
- 10. IHC vs IF: Key Differences, Use Cases & Which to Choose [https://www.ihisto.io/post/ihc-vs-if-comparison]
- 11. Immunohistochemistry (IHC): The Complete Guide [https://www.antibodies.com/applications/immunohistochemistry]
- 12. H&E to IHC virtual staining methods in breast cancer [https://www.nature.com/articles/s41746-025-01741-9]
- 13. An update on recent advances in fluorescent materials for ... [https://pubs.rsc.org/en/content/articlehtml/2025/ra/d5ra03102h]
- 14. Guidance for Submission of Immunohistochemistry ... [https://www.fda.gov/medical-devices/guidance-documents-medical-devices-and-radiation-emitting-products/guidance-submission-immunohistochemistry-applications-food-and-drug-administration-final-guidance]
- 15. Rhodamine vs Other Fluorophores: How to Choose the Best Dye? [https://probes.bocsci.com/resources/rhodamine-vs-other-fluorophores-how-to-choose-the-best-dye.html]
- 16. Comparison of immunohistochemistry (IHC) and fluorescence ... [https://pmc.ncbi.nlm.nih.gov/articles/PMC2776594/]
- 17. IHC vs IF: A Thorough Comparison for Research [https://www.histologix.com/insights-news/ihc-vs-if-a-thorough-comparison-for-research/]
- 18. ROSIE: AI generation of multiplex immunofluorescence ... [https://pmc.ncbi.nlm.nih.gov/articles/PMC12357954/]
- 19. Validation and Prospective Testing of a High Sensitivity ... [https://www.sciencedirect.com/science/article/abs/pii/S0023683725001436]
- 20. Validation and Prospective Testing of a High Sensitivity ... [https://pubmed.ncbi.nlm.nih.gov/40385428/]
- 21. Boston Cell Standards: Calibration Transforms Accuracy in ... [https://www.businesswire.com/news/home/20251119253545/en/Boston-Cell-Standards-Calibration-Transforms-Accuracy-in-HER2-Low-Breast-Cancer-Testing]
- 22. Comparison Between Immunocytochemistry and ... [https://www.news-medical.net/whitepaper/20200128/Comparison-Between-Immunocytochemistry-and-Immunohistochemistry.aspx]
- 23. Multiplex immunohistochemistry (mIHC): A technical deep ... [https://www.abcam.com/en-us/knowledge-center/immunohistochemistry/multiplex-immunohistochemistry-mihc]
- 24. Quality control for single-cell analysis of high-plex tissue ... [https://www.nature.com/articles/s41592-024-02328-0]
- 25. ICC vs IHC vs IF ? Do You Know The Difference? [https://www.bio-techne.com/applications/imaging/immunohistochemistry/icc-ihc-if]
- 26. A Guide to Perform 3D Histology of Biological Tissues with ... [https://www.mdpi.com/1422-0067/24/7/6747]
- 27. What to Report in Materials and Methods | Microscopy ... [https://www.med.unc.edu/microscopy/resources/rigor-and-reproducibility/what-to-report-in-materials-and-methods/]
- 28. Recent advances in the standardization of fluorescence ... [https://pmc.ncbi.nlm.nih.gov/articles/PMC8921347/]
- 29. Evaluating the utility of brightfield image data for ... [https://pmc.ncbi.nlm.nih.gov/articles/PMC10403126/]
- 30. Bright Field Microscopy as an Alternative to Whole Cell ... [https://journals.plos.org/plosone/article?id=10.1371/journal.pone.0007497]
- 31. Brightfield vs Fluorescent Staining Dataset–A Test Bed ... [https://www.nature.com/articles/s41597-023-02065-7]
- 32. Fluorescence microscopy and correlative brightfield videos ... [https://www.nature.com/articles/s41597-024-02970-5]
- 33. Brief guide to immunostaining - PMC [https://pmc.ncbi.nlm.nih.gov/articles/PMC11699723/]
- 34. Validation of Immunohistochemical Assays for Integral ... [https://pmc.ncbi.nlm.nih.gov/articles/PMC5796858/]
- 35. Development and clinical validation of deep learning-based ... [https://bmcgastroenterol.biomedcentral.com/articles/10.1186/s12876-025-04045-0]
- 36. Synergistic H&E and IHC image analysis by AI predicts ... [https://www.nature.com/articles/s43856-025-01045-9]
- 37. The tumor immune microenvironment: implications for ... [https://www.frontiersin.org/journals/immunology/articles/10.3389/fimmu.2025.1621812/full]
- 38. Relationship between the immune microenvironment of ... [https://www.nature.com/articles/s41416-019-0622-3]
- 39. Comparison of the tumor immune microenvironment ... - PubMed [https://pubmed.ncbi.nlm.nih.gov/35881197/]
- 40. Development and clinical validation of deep learning ... [https://pmc.ncbi.nlm.nih.gov/articles/PMC12211442/]
- 41. New standards in HER2-low testing: the CASI-01 ... [https://pubmed.ncbi.nlm.nih.gov/40945049/]
- 42. Multiplex Immunohistochemistry/Immunofluorescence ... [https://www.frontiersin.org/research-topics/14950/multiplex-immunohistochemistryimmunofluorescence-technique-the-potential-and-promise-for-clinical-application/magazine]
- 43. Deep cell phenotyping and spatial analysis of multiplexed ... [https://www.nature.com/articles/s41467-024-48870-5]
- 44. Robust phenotyping of highly multiplexed tissue imaging ... [https://www.nature.com/articles/s41467-023-40068-5]
- 45. The Typical Immunohistochemistry Workflow [https://nordicbiosite.com/blog/the-typical-immunohistochemistry-workflow]
- 46. Introduction To Immunohistochemistry [https://www.southernbiotech.com/introduction-immunohistochemistry/]
- 47. Clinical services - specimen turnaround time [https://health.ucdavis.edu/pathology/services/clinical/anatomic_pathology/surgical_pathology/clinical_services/turnaround_time.html]
- 48. Skin Direct Immunofluorescence Lab - CU School of Medicine [https://medschool.cuanschutz.edu/dermatology/patient-care/dermatopathology/dif-lab]
- 49. Comparative Analysis of Next-Generation Sequencing and ... [https://pubmed.ncbi.nlm.nih.gov/40748292/]
- 50. Comparative Analysis of Next-Generation Sequencing and ... [https://pmc.ncbi.nlm.nih.gov/articles/PMC12527557/]
- 51. Comparative Analysis of Next-Generation Sequencing and ... [https://www.turkjpath.org/doi.php?doi=10.5146/tjpath.2025.14079]
- 52. Applying next-generation sequencing to detect ... [https://www.nature.com/articles/s41698-025-01096-0]
- 53. A targeted next-generation sequencing panel for ... [https://www.nature.com/articles/s41598-025-08039-6]
- 54. Real-World Evaluation of Microsatellite Instability Detection ... [https://www.mdpi.com/1422-0067/26/15/7138]
- 55. Diagnostic accuracy of next-generation sequencing (NGS) ... [https://link.springer.com/article/10.1007/s12094-025-04040-7]
- 56. Comparison of next-generation sequencing and ... [https://pmc.ncbi.nlm.nih.gov/articles/PMC6988007/]
- 57. Current Gold-Standards for MSI Testing and the Clinical ... [https://www.promega.com/resources/pubhub/2025/current-gold-standards-for-msi-testing/]
- 58. Impact and Reproducibility of In-House Targeted Next ... [https://www.sciencedirect.com/science/article/pii/S152515782500042X]
- 59. Comparing IHC, ICC, and IF: Which One Fits Your Research? [https://www.creative-bioarray.com/comparing-ihc-icc-and-if-which-one-fits-your-research.htm]
- 60. Antigen Retrieval in Immunohistochemistry [https://www.bosterbio.com/blog/post/antigen-retrieval-in-immunohistochemistry?srsltid=AfmBOopdtwrqnI9GxNd1lTv0c7d-Oil884RwI3Me_CIIJk5fVWU1boFy]
- 61. Immunohistochemistry, Frozen sections [https://www.hycultbiotech.com/immunohistochemistry-frozen-sections/]
- 62. Frozen Tissue Preparation & IHC Cryosection Staining ... [https://www.rndsystems.com/resources/protocols/protocol-preparation-and-fluorescent-ihc-staining-frozen-tissue-sections]
- 63. Comparison of Antigen Retrieval Methods for ... [https://www.mdpi.com/2409-9279/7/5/67]
- 64. High-plex immunofluorescence imaging and traditional ... [https://www.nature.com/articles/s43018-023-00576-1]
- 65. Immunofluorescence Method for IHC Detection [https://www.thermofisher.com/us/en/home/life-science/protein-biology/protein-biology-learning-center/protein-biology-resource-library/pierce-protein-methods/immunofluorescence-method-ihc-detection.html]
- 66. Immunohistochemistry (IHC) Troubleshooting Guide & the ... [https://www.cellsignal.com/learn-and-support/troubleshooting/ihc-troubleshooting-guide?srsltid=AfmBOor5Efsb1n369T8XvEn-mpj-_Du0gQgTMc7xHiMst9weCIY6NOgG]
- 67. Immunohistochemistry (IHC) [https://www.cellsignal.com/learn-and-support/overview-of-ihc?srsltid=AfmBOoo0WdlLtoCr_2Mga89ZTUTVnIIuGWdF0pyRqRcUob0xbMdETyz7]
- 68. IHC Troubleshooting Guide [https://www.thermofisher.com/us/en/home/life-science/protein-biology/protein-biology-learning-center/protein-biology-resource-library/pierce-protein-methods/ihc-troubleshooting-guide.html]
- 69. Blocking Strategies for IHC [https://www.thermofisher.com/us/en/home/life-science/protein-biology/protein-biology-learning-center/protein-biology-resource-library/pierce-protein-methods/blocking-strategies-ihc.html]
- 70. Blocking in IHC [https://www.abcam.com/en-us/technical-resources/guides/ihc-guide/blocking-in-ihc]
- 71. A simple solution for antibody signal enhancement in ... [https://pubmed.ncbi.nlm.nih.gov/27188756/]
- 72. 9 Tips to optimize your IF experiments [https://www.ptglab.com/news/blog/9-tips-to-optimize-your-if-experiments/?srsltid=AfmBOorm0SJmlYutL2GIfVWRRA-eDLDibEtxt2s4kdcxYYrboveytrjS]
- 73. Immunohistochemistry for Pathologists: Protocols, Pitfalls, ... [https://pmc.ncbi.nlm.nih.gov/articles/PMC5122731/]
- 74. How to Minimize Photobleaching [https://www.enzo.com/note/how-to-minimize-photobleaching/]
- 75. Photobleaching in Fluorescence Imaging [https://www.thermofisher.com/us/en/home/life-science/cell-analysis/cell-analysis-learning-center/molecular-probes-school-of-fluorescence/imaging-basics/protocols-troubleshooting/troubleshooting/photobleaching.html]
- 76. Minimizing photobleaching during confocal microscopy of ... [https://pubmed.ncbi.nlm.nih.gov/15312193/]
- 77. Reduction of photobleaching effects in photoacoustic ... [https://pmc.ncbi.nlm.nih.gov/articles/PMC12118878/]
- 78. IHC or IF: Which Technique Suits Your Research Best? [https://home.histowiz.com/blog/ihc-vs-if/]
- 79. 4 controls for immunohistochemistry (IHC) you need to use [https://www.alomone.com/4-controls-for-immunohistochemistry-ihc-you-need-to-use?srsltid=AfmBOopHgUP-XnwYUb_c1noitWavwsrcv_0wW-XwQVwKUky1y_44UTvq]
- 80. 5 Controls for Immunofluorescence: An Easy Guide [https://bitesizebio.com/44370/controls-for-immunofluorescence-a-beginners-guide/]
- 81. Controls in IHC [https://www.abcam.com/en-us/technical-resources/guides/ihc-guide/controls-in-ihc]
- 82. ICC/IF Controls [https://www.antibodies.com/applications/immunofluorescence/immunofluorescence-controls]
- 83. Immunohistochemistry and Immunofluorescence [https://pubmed.ncbi.nlm.nih.gov/36418703/]
- 84. IHC or IF: Which is Best for My Study? [https://www.stagebio.com/blog/ihc-or-if-which-is-best-for-my-study]
- 85. Immunohistochemistry vs Immunocytochemistry: Updated ... [https://www.stressmarq.com/blog/immunohistochemistry-vs-immunocytochemistry/?srsltid=AfmBOopHn_Lvwj6CPXjGU-WUZ923D2xHoJBptigTQtNj_uYJ5dZWcw5Q]
- 86. Digital Microscopy, Image Analysis, and Virtual Slide Repository [https://pmc.ncbi.nlm.nih.gov/articles/PMC6927898/]
- 87. Systematic review and meta-analysis of artificial ... [https://www.nature.com/articles/s41746-025-01483-8]
- 88. Proof of the quantitative potential of immunofluorescence ... [https://www.nature.com/articles/labinvest2016148]
- 89. High sensitivity and reproducibility of ... [https://pubmed.ncbi.nlm.nih.gov/15517323/]
- 90. Applications of immunohistochemistry - PMC - PubMed Central [https://pmc.ncbi.nlm.nih.gov/articles/PMC3467869/]
- 91. Top applications of immunohistochemistry [https://www.abcam.com/en-us/stories/articles/top-applications-of-immunohistochemistry]
- 92. Revisiting the scientific method to improve rigor and ... [https://pmc.ncbi.nlm.nih.gov/articles/PMC6203879/]
- 93. Analytic Validation of Immunohistochemical Assays [https://pmc.ncbi.nlm.nih.gov/articles/PMC6938252/]
- 94. 6 Essential IHC Controls for Reliable Staining Results [https://www.bosterbio.com/blog/post/6-ihc-controls-you-should-know?srsltid=AfmBOorXxvjAt-Nk4Cds83byxvWQUqZn-gYCVOd_hAf7MPNEW43OrN4K]
- 95. Principles of Analytic Validation of Immunohistochemical ... [https://www.cap.org/protocols-and-guidelines/cap-guidelines/current-cap-guidelines/principles-of-analytic-validation-of-immunohistochemical-assays]
- 96. The Rise of AI-Assisted Diagnosis: Will Pathologists Be ... [https://pmc.ncbi.nlm.nih.gov/articles/PMC12468387/]
- 97. (Open Access) Immunohistochemestry vs . Immunofluorescence ... [https://scispace.com/papers/immunohistochemestry-vs-immunofluorescence-comparative-3tlox9l3vj]
- 98. Comparative Analysis of Immunohistochemical Staining ... [https://pmc.ncbi.nlm.nih.gov/articles/PMC7947637/]
- 99. Direct immunofluorescence (DIF) versus immunohistochemical ( IHC )... [https://pubmed.ncbi.nlm.nih.gov/38427745/]
- 100. Comparison of Indirect Immunofluorescence and Enzyme ... [https://pmc.ncbi.nlm.nih.gov/articles/PMC9719102/]
- 101. Digital Pathology and AI Highlights from ASCO 2025 [https://proscia.com/digital-pathology-and-ai-highlights-from-asco-2025/]