IHC vs Western Blot: A Comprehensive Guide to Protein Detection Methods
This article provides researchers, scientists, and drug development professionals with a detailed comparison of Immunohistochemistry (IHC) and Western Blot, two cornerstone techniques for protein analysis.
IHC vs Western Blot: A Comprehensive Guide to Protein Detection Methods
Abstract
This article provides researchers, scientists, and drug development professionals with a detailed comparison of Immunohistochemistry (IHC) and Western Blot, two cornerstone techniques for protein analysis. It explores their foundational principles, distinct methodological workflows, and ideal applications, from cancer diagnostics to infectious disease detection. The content delivers practical troubleshooting and optimization strategies for both techniques, emphasizes the critical role of antibody validation and controls for reproducibility, and concludes with a forward-looking perspective on their place in the evolving proteomics landscape.
Core Principles: How IHC and Western Blot Work from Sample to Signal
In the fields of molecular biology and biomedical research, the specific interaction between an antibody and its target antigen is a foundational principle that enables the detection and analysis of proteins. Immunohistochemistry (IHC) and Western blot (WB) are two cornerstone techniques that exploit this specificity, yet they deliver fundamentally different information about the protein of interest. While IHC provides precise spatial localization within a tissue context, Western blot offers quantitative data on protein molecular weight and expression levels. This guide objectively compares the performance, applications, and limitations of these two widely used methods to inform researchers and drug development professionals in selecting the appropriate technique for their experimental goals.
Historical Development and Technical Principles
A Shared Foundation in Immunodetection
Both IHC and Western blotting rely on the specific binding of antibodies to target antigens, a principle pioneered by Albert H. Coons in the 1940s when he developed fluorescently-labeled antibodies to detect pneumococcal antigens in tissues [1] [2]. The core concept shared by both techniques is the utilization of primary antibodies that recognize specific epitopes on the target protein, followed by detection with labeled secondary antibodies or other detection systems.
Western blotting emerged later in 1979, developed from DNA blotting techniques and named in reference to its predecessor methods [3] [4]. The technique was refined by multiple research groups, including Towbin et al. and Burnette, who established the standard protocol of separating proteins by electrophoresis followed by transfer to membranes for antibody detection [4].
Fundamental Technical Differences
Despite their shared reliance on antibody-antigen interactions, IHC and Western blot differ significantly in their approach to sample preparation and protein detection:
- IHC preserves the structural integrity of tissues through fixation and embedding, allowing visualization of protein distribution within their native morphological context [1] [2].
- Western blot involves denaturing proteins through lysis and boiling in SDS-containing buffers, separating them by molecular weight via electrophoresis, then transferring to membranes for detection [3] [4].
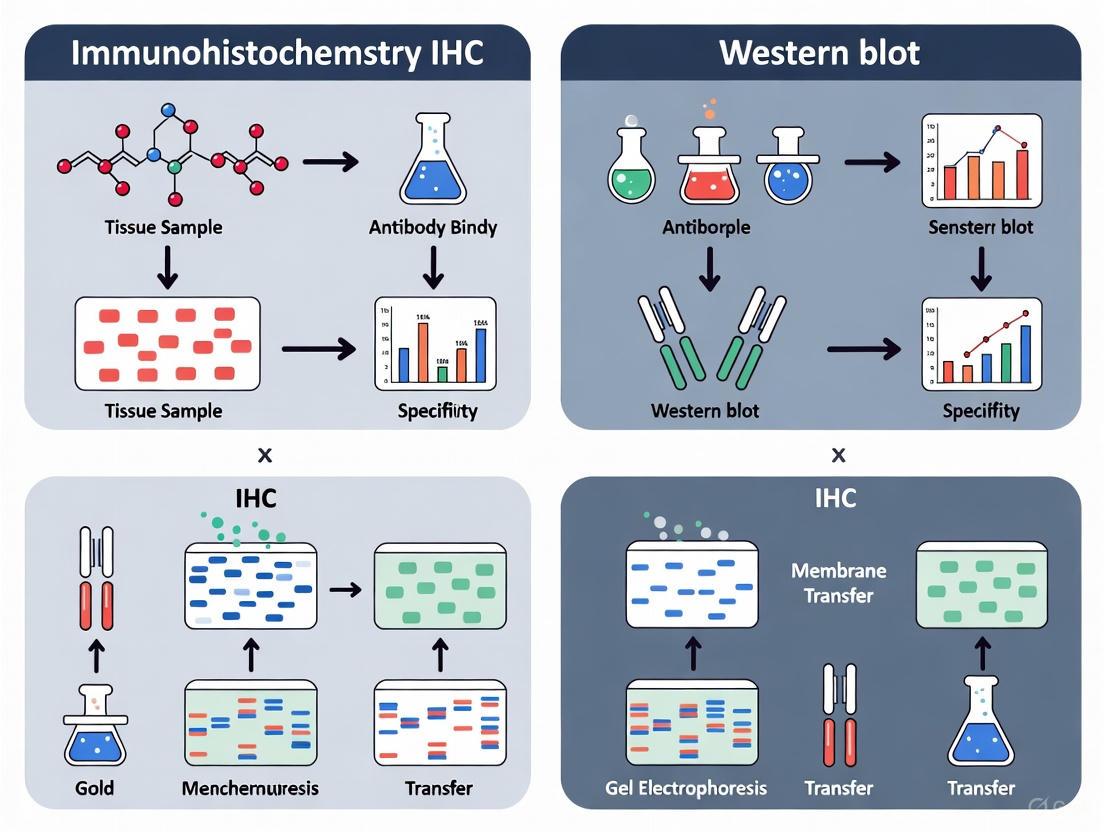
Figure 1: Comparative Workflows of IHC and Western Blot Techniques
Comparative Performance Analysis
Application-Specific Strengths and Limitations
The choice between IHC and Western blot depends heavily on the research question, as each technique offers distinct advantages and suffers from particular limitations.
Table 1: Performance Comparison of IHC and Western Blot
| Parameter | Immunohistochemistry (IHC) | Western Blot |
|---|---|---|
| Spatial Information | Preserves tissue architecture and subcellular localization [1] [5] | Destroys tissue context; provides molecular weight information [6] [4] |
| Quantification Capability | Semi-quantitative at best; subjective interpretation [1] | Semi-quantitative to quantitative; can compare expression levels between samples [3] [4] |
| Sensitivity | High with signal amplification methods (e.g., ABC, polymer-based) [7] | Very high; can detect low abundance proteins [5] |
| Multiplexing Capacity | Limited for chromogenic; better for fluorescent detection (3-4 targets) [2] [7] | Limited by antibody species and molecular weight; typically 2-3 targets [2] |
| Throughput | Lower throughput; manual assessment often required [1] | Medium throughput; can process multiple samples simultaneously [3] |
| Protein State | Proteins in near-native state within tissue context [2] | Denatured proteins; epitopes may be altered [3] |
| Diagnostic Utility | Essential for pathological diagnosis; provides morphological context [1] [6] | Limited diagnostic use; primarily research tool [6] [4] |
Detection Methods and Signal Visualization
Both techniques employ similar detection strategies but with different practical implementations:
IHC Detection Systems:
- Chromogenic detection: Enzymes like HRP convert substrates (DAB, AEC) to insoluble colored precipitates at antigen sites [7]. Advantages include permanent slides and common microscope compatibility.
- Fluorescent detection: Fluorophore-conjugated antibodies emit light at specific wavelengths when excited [2] [7]. Allows multiplexing but susceptible to photobleaching.
- Signal amplification: Methods like Avidin-Biotin Complex (ABC) or polymer-based systems enhance sensitivity through enzyme clustering [7].
Western Blot Detection:
- Chemiluminescent: HRP-conjugated antibodies catalyze light emission upon substrate addition, detected by X-ray film or digital imagers [3].
- Fluorescent: Direct detection with fluorophore-conjugated antibodies enables multiplexing and digital quantification [3] [5].
- Colorimetric: Less common; produces colored precipitates on the membrane [3].
Experimental Protocols and Methodologies
Detailed IHC Protocol for Formalin-Fixed Paraffin-Embedded (FFPE) Tissues
Sample Preparation and Fixation:
- Tissue fixation: Immerse tissue in 10% neutral buffered formalin (approximately 4% formaldehyde) for 24-48 hours [1] [2]. Adequate fixation preserves morphology but overfixation may mask epitopes.
- Processing and embedding: Dehydrate through graded alcohols, clear in xylene, and embed in paraffin wax [1].
- Sectioning: Cut 3-5 μm sections using a microtome and mount on charged slides [2].
Staining Procedure:
- Deparaffinization and rehydration: Heat slides at 60°C for 30 minutes, followed by xylene and graded alcohol series [1].
- Antigen retrieval: Heat slides in citrate buffer (pH 6.0) or EDTA buffer (pH 8.0) using a pressure cooker, microwave, or steamer for 20 minutes [1] [2]. This step reverses formaldehyde-induced cross-links that mask epitopes.
- Endogenous enzyme blockade: Incubate with 3% hydrogen peroxide for 10 minutes to quench endogenous peroxidase activity [1].
- Blocking: Apply 5-10% normal serum from secondary antibody host species for 30 minutes to reduce non-specific binding [2].
- Primary antibody incubation: Apply optimized antibody dilution in antibody diluent and incubate overnight at 4°C in a humidity chamber [2].
- Secondary antibody application: Apply species-specific secondary antibody conjugated to HRP or AP for 30-60 minutes at room temperature [7].
- Chromogen development: Incubate with DAB (brown precipitate) or AEC (red precipitate) substrate until desired intensity [7].
- Counterstaining: Apply hematoxylin for 1-2 minutes to visualize nuclei [1].
- Dehydration and mounting: Dehydrate through graded alcohols, clear in xylene, and mount with permanent medium [1].
Detailed Western Blot Protocol
Sample Preparation:
- Cell lysis: Use RIPA buffer (for whole cell extracts) or NP-40 buffer (for cytoplasmic proteins) supplemented with protease and phosphatase inhibitors [3] [4]. Maintain samples on ice throughout.
- Protein quantification: Perform BCA or Bradford assay to determine protein concentration [3].
- Sample denaturation: Mix lysate with Laemmli buffer containing DTT or β-mercaptoethanol, then heat at 95°C for 5 minutes [3].
Electrophoresis and Transfer:
- Gel electrophoresis: Load 20-40 μg protein per well on SDS-PAGE gel (8-16% acrylamide depending on protein size) and run at 100-150V until dye front reaches bottom [3] [4].
- Protein transfer: Transfer proteins to nitrocellulose or PVDF membrane using wet or semi-dry transfer systems [4].
Immunodetection:
- Blocking: Incubate membrane in 5% non-fat milk or BSA in TBST for 1 hour at room temperature [3] [4].
- Primary antibody incubation: Incubate with optimized antibody dilution in blocking buffer overnight at 4°C [3].
- Secondary antibody incubation: Apply HRP or fluorophore-conjugated secondary antibody for 1 hour at room temperature [3].
- Signal detection: For chemiluminescence, incubate with ECL substrate and expose to film or digital imager [3] [4].
Research Reagent Solutions
Successful implementation of either technique requires carefully selected reagents and appropriate controls to ensure specificity and reproducibility.
Table 2: Essential Research Reagents for IHC and Western Blot
| Reagent Category | Specific Examples | Function and Importance |
|---|---|---|
| Fixatives | 10% neutral buffered formalin, 4% PFA, ethanol, methanol [1] [2] | Preserve tissue architecture and prevent degradation; impact epitope availability |
| Antigen Retrieval Reagents | Citrate buffer (pH 6.0), EDTA/EGTA buffer (pH 8.0-9.0) [1] | Reverse formaldehyde cross-links; critical for FFPE tissue epitope exposure |
| Blocking Agents | Normal serum, BSA, non-fat dry milk [2] [3] | Reduce non-specific antibody binding and background signal |
| Detection Systems | HRP-conjugated secondary antibodies, ABC kit, polymer-based systems [7] | Amplify signal and enable target visualization; impact sensitivity |
| Protease Inhibitors | PMSF, aprotinin, leupeptin, EDTA [3] | Prevent protein degradation during sample preparation |
| Protein Assays | BCA, Bradford, Lowry assay [3] | Quantify protein concentration for equal loading |
| Validation Controls | Knockout tissues/cells, isotype controls, positive control tissues [8] [9] | Verify antibody specificity and experimental reliability |
Technical Challenges and Troubleshooting
Common Pitfalls and Solutions
IHC-Specific Issues:
- High background staining: Often caused by inadequate blocking, overfixation, or endogenous enzyme activity. Solution: Optimize blocking conditions and implement appropriate quenching steps [1].
- Weak or absent signal: May result from insufficient antigen retrieval, antibody concentration too low, or overfixation. Solution: Titrate antibodies and optimize retrieval methods [1] [2].
- Non-specific staining: Frequently due to antibody cross-reactivity. Solution: Include appropriate negative controls and validate antibodies with knockout tissues [8].
Western Blot-Specific Issues:
- Non-specific bands: Often caused by antibody cross-reactivity or incomplete blocking. Solution: Use more stringent blocking conditions and validate antibodies [4] [9].
- High background: Typically results from insufficient washing or membrane drying. Solution: Increase wash frequency and volume [3].
- No signal: May be due to transfer issues, inappropriate antibody dilution, or protein degradation. Solution: Verify transfer efficiency with Ponceau S staining and titrate antibodies [3].
Antibody Validation Concerns
A significant challenge in both techniques is antibody specificity. Studies have shown that many commercial antibodies lack sufficient validation, with one analysis of Tau antibodies revealing that over half showed non-specific binding to other proteins [8]. Similarly, issues with tissue factor antibodies have been reported, where commonly used antibodies failed to detect the target in mouse models [9].
Validation Recommendations:
- Use genetic controls (knockout cells or tissues) when possible [8] [9]
- Compare multiple antibodies against non-overlapping epitopes [8]
- Verify expected molecular weight and cellular localization patterns [4]
- Utilize orthogonal methods to confirm findings [9]
Future Perspectives and Technological Advances
Both IHC and Western blotting continue to evolve with technological advancements:
IHC Innovations:
- Digital pathology and AI: Automated image analysis algorithms are reducing subjectivity in interpretation [1]
- Multiplexing technologies: Methods like multiplexed ion beam imaging (MIBI) and cyclic immunofluorescence enable detection of dozens of markers simultaneously [1]
- Enhanced signal amplification: Novel polymer-based systems continue to improve sensitivity [7]
Western Blot Advancements:
- Capillary electrophoresis: Systems like Protein Simple's Jess allow automated, quantitative western blotting with reduced sample handling [4]
- Single-cell western blot: Enables protein analysis at single-cell resolution [4]
- Improved quantification: Fluorescent detection methods with linear dynamic ranges facilitate more accurate quantification [3] [5]
IHC and Western blot, while sharing the fundamental principle of antibody-antigen specificity, serve complementary roles in protein detection and analysis. IHC excels in providing spatial context within tissues, making it indispensable for diagnostic pathology and morphological correlation. Western blot offers superior capabilities for protein size determination and semi-quantitative analysis of expression levels. The choice between these techniques should be guided by the specific research question, with many studies benefiting from employing both methods to obtain comprehensive protein characterization. As antibody validation remains a critical concern for both techniques, rigorous controls and verification of specificity are essential for generating reliable, reproducible data in both research and diagnostic applications.
Immunohistochemistry (IHC) and Western blot (WB) are foundational techniques in protein detection that exploit the specific binding of antibodies to their target antigens. Despite this shared principle, they represent two fundamentally different philosophies in experimental approach: tissue preservation versus protein separation [6].
IHC is designed to provide spatial context within intact tissue architecture, allowing researchers to visualize protein distribution within specific cells and subcellular compartments in their morphological context [2]. In contrast, Western blot emphasizes molecular separation, breaking down tissues to separate proteins by molecular weight for quantitative analysis [10]. This fundamental difference in philosophy dictates their respective workflows, applications, and the type of data they generate.
The historical development of these techniques reflects their distinct purposes. IHC traces its origins to the early 1940s when Albert H. Coons developed fluorescently conjugated antibodies to detect bacteria within macrophages [2]. Western blot emerged later, first described by Dr. Burnette in 1981 as an adaptation of the Southern blot for DNA and Northern blot for RNA [10].
Technical Workflows: From Sample to Signal
Immunohistochemistry Workflow
IHC Workflow Diagram Title: IHC Tissue Preservation Pathway
IHC begins with tissue fixation using formaldehyde-based fixatives like formalin or paraformaldehyde, which create methylene cross-links between proteins to preserve tissue integrity and morphology [2]. Fixed tissues are then embedded in paraffin wax and sectioned into thin slices (3-5 μm) placed on slides [6]. A critical antigen retrieval step follows, where heat-induced epitope retrieval reverses formaldehyde-induced cross-links that may mask target epitopes [2]. After blocking to prevent non-specific antibody binding, samples undergo sequential incubation with primary antibodies (either monoclonal or polyclonal) specific to the target antigen, followed by secondary antibodies conjugated to enzymes (e.g., HRP) or fluorophores [6]. Finally, counterstaining with dyes like hematoxylin (for nuclei) or eosin (for cytoplasm) provides morphological context, with visualization via microscopy [11].
Western Blot Workflow
Western Blot Workflow Diagram Title: WB Protein Separation Pathway
Western blot starts with protein extraction using cell lysis buffers containing detergents (e.g., NP-40, Triton X-100) and protease/phosphatase inhibitors to maintain protein integrity [12]. The extracted protein concentration is precisely measured using colorimetric assays like Bradford or BCA, then denatured in Laemmli buffer containing SDS and β-mercaptoethanol to linearize proteins and mask their intrinsic charge [10]. SDS-PAGE electrophoresis separates proteins solely by molecular weight as they migrate through a polyacrylamide gel matrix [10]. Separated proteins are then transferred to a membrane (nitrocellulose or PVDF) via electrophoresis [10]. Similar to IHC, the membrane is blocked, incubated with primary and secondary antibodies, and detected using chemiluminescent, colorimetric, or fluorescent methods [6] [12].
Comparative Analysis: Technical Specifications and Performance
Table 1: Direct Comparison of IHC and Western Blot Characteristics
| Parameter | Immunohistochemistry (IHC) | Western Blot |
|---|---|---|
| Sample Type | Intact tissue sections (3-5 μm) | Protein extracts from lysed cells/tissues |
| Protein State | In situ, fixed | Denatured, linearized |
| Separation Basis | Cellular and subcellular localization | Molecular weight |
| Detection Method | Chromogenic (DAB) or fluorescent | Chemiluminescent, fluorescent, or colorimetric |
| Data Output | Spatial distribution within morphology | Molecular weight with quantitative potential |
| Multiplexing Capacity | Up to 4 targets with careful panel design | Multiple targets per blot (limited by antibody compatibility) |
| Throughput | Medium | Low to medium |
| Key Advantage | Preserves tissue architecture and location | Confirms target identity by molecular weight |
Quantitative Performance and Detection Limits
Table 2: Quantitative Performance and Validation Approaches
| Aspect | Immunohistochemistry | Western Blot |
|---|---|---|
| Quantitative Capacity | Semi-quantitative; novel qIHC methods emerging [13] | Principally quantitative with proper validation [14] |
| Linear Range | Limited dynamic range | 8-fold to two orders of magnitude when validated [14] |
| Detection Specificity | Spatial pattern within tissue context; requires counterstains for orientation [11] | Molecular weight confirmation via ladder comparison [6] |
| Validation Controls | Tissue known to express/not express target; no-primary antibody control; isotype controls [15] | Knockout/knockdown lysates; positive control lysates; no-primary antibody control [16] |
| Loading Controls | Not applicable | Housekeeping proteins (β-actin, GAPDH); total protein staining [15] [12] |
Advantages and Limitations in Research Applications
IHC excels in diagnostic pathology and when investigating protein localization patterns within complex tissues. Its ability to preserve morphological context makes it indispensable for cancer diagnostics, where abnormal cellular patterns are visually apparent [6]. However, IHC has limitations in quantification precision and cannot confirm target identity by molecular weight, potentially leading to false positives from non-specific binding [6].
Western blot provides molecular weight verification, which serves as an additional specificity check. Recent studies demonstrate that properly validated antibodies can achieve excellent quantitative performance with linear ranges spanning up to two orders of magnitude [14]. The technique also allows for simultaneous detection of multiple targets when carefully designed. However, Western blot loses all spatial and subcellular localization information and requires protein denaturation, which may destroy some conformational epitopes [6].
Experimental Design: Controls and Validation
Essential Controls for Reliable Results
IHC Controls:
- Positive tissue controls: Tissues known to express the target protein [15]
- Negative tissue controls: Tissues known not to express the target protein [15]
- No-primary antibody controls: Assess non-specific secondary antibody binding [15]
- Isotype controls: Non-immune antibodies matching primary antibody isotype [15]
- Absorption controls: Primary antibody pre-absorbed with immunogen [15]
Western Blot Controls:
- Positive control lysates: Cell lines or tissues known to express the target protein [15]
- Negative control lysates: Knockout/knockdown cell lines or tissues lacking the target [15] [16]
- No-primary antibody controls: Assess secondary antibody specificity [15]
- Loading controls: Housekeeping proteins (β-actin, GAPDH) or total protein stains [15] [12]
- Molecular weight markers: Verify target size matches expected molecular weight [10]
Antibody Validation Strategies
Both techniques require rigorous antibody validation, preferably using a binary approach that tests antibodies in biologically relevant positive and negative expression systems [16]. Genetic knockout models (CRISPR, siRNA) provide ideal negative controls, while treatments that induce target expression or modification can serve as positive controls [16]. Critically, antibodies must be validated separately for each application, as performance in one technique doesn't guarantee specificity in another [16].
Research Reagent Solutions
Table 3: Essential Research Reagents and Their Functions
| Reagent Category | Specific Examples | Primary Function |
|---|---|---|
| Fixation Agents | Formalin, Paraformaldehyde, Ethanol, Methanol | Preserve tissue architecture and prevent degradation [2] |
| Antigen Retrieval Reagents | Citrate buffer, EDTA, Tris-EDTA | Reverse formaldehyde cross-links to expose epitopes [2] |
| Counterstains | Hematoxylin, Eosin, DAPI, Nuclear Fast Red | Provide morphological context and contrast to primary signal [11] |
| Protein Lysis Buffers | RIPA buffer, NP-40 buffer | Extract proteins while maintaining integrity for WB [12] |
| Gel Electrophoresis Reagents | Acrylamide, Bis-acrylamide, SDS, Tris buffers | Create molecular sieve for protein separation by size [10] |
| Blocking Agents | BSA, non-fat milk, casein | Reduce non-specific antibody binding [12] |
| Detection Substrates | DAB, Enhanced chemiluminescence, Fluorescent tags | Generate detectable signal from antibody-antigen complexes [6] |
The choice between IHC and Western blot ultimately depends on the research question. IHC is unequivocally superior when spatial context, cell-specific expression patterns, or tissue morphology are relevant to the biological hypothesis. It remains the technique of choice for clinical diagnostics, tumor classification, and subcellular localization studies.
Western blot provides critical advantages when molecular weight confirmation, quantitative precision, or post-translational modification detection are prioritized. It excels in signaling pathway analysis, protein expression quantification, and validation of genetic manipulations.
Increasingly, these techniques are used complementarily, with Western blot validating antibody specificity and providing quantitative framework, while IHC places these findings in their proper biological context. This integrated approach leverages the respective strengths of both techniques while mitigating their individual limitations, providing a more comprehensive understanding of protein expression and function in health and disease.
In the fields of cell biology and biomedical research, immunohistochemistry (IHC) and Western blot (WB) stand as two foundational techniques for protein detection. Despite sharing a common principle—exploiting the specific binding of antibodies to target antigens—they provide fundamentally different types of information [6]. IHC excels at visualizing the precise spatial localization of proteins within the context of intact tissue architecture, typically using chromogenic or fluorescent detection [2] [17]. In contrast, Western blot is unparalleled in its ability to confirm a protein's molecular weight and provide semi-quantitative data on its expression levels in a complex mixture [10] [4]. This guide offers an objective comparison of these two techniques, detailing their respective performances, optimal applications, and underlying protocols to inform research and development decisions.
Core Principle Comparison: Spatial Context vs. Molecular Size
The fundamental divergence between IHC and Western blot lies in their starting material and the primary information they deliver.
- Immunohistochemistry (IHC) preserves the tissue's structural integrity. Proteins are detected in situ within fixed tissue sections, allowing researchers to see which cells express the protein, its subcellular compartment (e.g., nucleus, cytoplasm, membrane), and its distribution patterns across a heterogeneous tissue sample [2] [17]. This makes IHC an indispensable tool for pathology and developmental biology.
- Western Blot (WB) begins with a homogenized tissue or cell lysate, destroying all spatial context. Proteins are denatured, separated by molecular weight via gel electrophoresis, and then transferred to a membrane for antibody probing [10] [4]. Its key strength is confirming a protein's identity based on its size and providing a semi-quantitative measure of its abundance.
Table 1: Fundamental Characteristics of IHC and Western Blot
| Feature | Immunohistochemistry (IHC) | Western Blot (WB) |
|---|---|---|
| Protein State | In situ, within intact tissue/cells [2] | Denatured [10] |
| Primary Output | Protein localization and spatial distribution [17] | Molecular weight confirmation and semi-quantification [4] |
| Tissue/Cellular Context | Preserved | Destroyed |
| Key Advantage | Visualizes protein expression in complex tissues and different cell types [2] | Verifies protein identity via size; can detect post-translational modifications [4] |
| Multiplexing Capability | Easily multiplex 2-4 targets with fluorescent detection [18] | Possible with fluorescent probes, but more limited [17] |
Performance and Experimental Data Analysis
The performance of IHC and Western blot must be evaluated against different metrics, as they are designed to answer distinct biological questions.
Antibody Performance is Context-Dependent
A critical consideration is that an antibody's performance is highly application-specific. A study analyzing 13,000 antibodies found that while 45% yielded supportive staining in Western blot, 43% showed bands of the wrong size, indicating potential cross-reactivity or non-specificity [19]. Importantly, the study demonstrated that antibody performance does not directly translate between applications; an antibody that works well in Western blot may not be effective for IHC and vice versa [19]. This underscores the necessity of using antibodies validated for the specific application.
Detection Limits and Specificity
Western blot generally offers high specificity because the combination of separation by molecular weight and antibody binding provides two layers of validation [2]. If a band appears at the expected size, it strongly supports the correct identification of the target protein. IHC, while providing exquisite localization, lacks this internal size check. The staining pattern is taken as evidence for the target's presence, but without the molecular weight confirmation, there is a risk of misinterpreting non-specific or cross-reactive staining [6].
Table 2: Performance and Validation Metrics
| Performance Metric | Immunohistochemistry (IHC) | Western Blot (WB) |
|---|---|---|
| Sensitivity | Medium; can be enhanced with signal amplification (e.g., polymer-based methods) [18] | High; can detect very small quantities of protein [17] |
| Specificity | Medium; relies solely on antibody specificity without molecular weight confirmation [2] | High; confirmation via molecular weight increases confidence [6] |
| Quantification | Semi-quantitative at best [2] | Semi-quantitative; good for comparing relative levels between samples [4] |
| Key Validation | Colocalization with known cellular markers | Coincidence with expected molecular weight on the blot |
Detailed Experimental Protocols
Immunohistochemistry (IHC) Workflow
The IHC protocol aims to preserve tissue morphology while making the target antigen accessible for antibody binding.
- Sample Preparation and Fixation: Tissue is collected and fixed immediately, most commonly with formaldehyde-based fixatives like formalin or paraformaldehyde. This step preserves tissue architecture and prevents degradation [2]. The tissue is then embedded in paraffin and thinly sectioned, or frozen and sectioned for cryostat use.
- Antigen Retrieval: For formalin-fixed, paraffin-embedded (FFPE) tissues, a crucial antigen retrieval step is often required. Heat-induced epitope retrieval (HIER) using a buffer solution breaks the methylene cross-links formed during fixation, which can mask epitopes and reduce antibody binding [2].
- Blocking and Antibody Incubation: Sections are incubated with a blocking serum to reduce non-specific background staining. This is followed by incubation with the primary antibody specific to the target protein. An enzyme-conjugated (e.g., HRP) or fluorophore-conjugated secondary antibody is then applied [2] [18].
- Detection and Visualization:
- Chromogenic Detection: An enzyme substrate (e.g., DAB for HRP) is added, which produces an insoluble colored precipitate at the site of the target antigen. The staining can be observed with a standard light microscope [20] [18].
- Fluorescent Detection: The fluorophore is directly excited by light of a specific wavelength, and the emitted light is detected using a fluorescence microscope. This allows for multiplexing by using antibodies conjugated to different fluorophores [20] [18].
IHC Experimental Workflow
Western Blot (WB) Workflow
The Western blot protocol is designed to separate proteins by size and then specifically detect a target within the complex mixture.
- Sample Preparation: Cells or tissues are lysed using a detergent-based lysis buffer. Protease and phosphatase inhibitors are added to prevent protein degradation. The total protein concentration of each sample is measured (e.g., via Bradford assay) and normalized to ensure equal loading across the gel [10] [4].
- Gel Electrophoresis (SDS-PAGE): The normalized protein samples are mixed with Laemmli buffer, which contains SDS to denature proteins and give them a uniform negative charge, and a reducing agent to break disulfide bonds. The samples are then loaded onto a polyacrylamide gel. An electric current is applied, causing proteins to migrate through the gel matrix and separate strictly by their molecular weight [10].
- Electrophoretic Transfer (Blotting): The separated proteins are transferred from the gel onto a membrane (typically nitrocellulose or PVDF) using an electric current. This creates a replica of the gel's protein pattern on the membrane [10].
- Blocking and Antibody Probing: The membrane is incubated in a blocking solution (e.g., non-fat milk or BSA) to prevent non-specific antibody binding. It is then probed sequentially with a primary antibody against the target protein and an enzyme-conjugated (e.g., HRP) secondary antibody [10] [4].
- Detection: A chemiluminescent substrate for HRP is added to the membrane. The enzyme catalyzes a light-producing reaction, which is captured by a digital imager. The resulting band's position is compared to a molecular weight ladder, confirming the target protein's size, and the band intensity can be used for semi-quantitative analysis [17] [4].
Western Blot Experimental Workflow
Research Reagent Solutions
Successful execution of IHC and Western blot relies on a suite of critical reagents. The table below details essential materials and their functions.
Table 3: Essential Reagents for IHC and Western Blot
| Reagent Category | Specific Examples | Function | Application |
|---|---|---|---|
| Fixatives | Formalin, Paraformaldehyde [2] | Preserves tissue architecture and antigenicity by creating protein cross-links. | IHC |
| Embedding Media | Paraffin wax, Cryomedia/OCT [2] | Provides structural support for thin sectioning of tissues. | IHC |
| Lysis Buffers | RIPA Buffer [10] | Breaks open cells and solubilizes proteins for extraction. | WB |
| Protease Inhibitors | Cocktails (e.g., PMSF) [10] | Prevents protein degradation by endogenous proteases during sample prep. | WB |
| Gel Components | Acrylamide, Bis-acrylamide [10] | Forms the porous gel matrix for size-based protein separation. | WB |
| Membranes | Nitrocellulose, PVDF [10] | Binds proteins after transfer for antibody probing. | WB |
| Primary Antibodies | Monoclonal, Polyclonal [19] | Binds specifically to the target protein of interest. | IHC, WB |
| Detection Enzymes | Horseradish Peroxidase (HRP) [18] | Conjugated to secondary antibody; catalyzes signal production. | IHC, WB |
| Chromogenic Substrates | DAB (brown), AEC (red) [18] | Enzyme converts this to an insoluble colored precipitate. | IHC |
| Chemiluminescent Substrates | Luminol-based reagents [4] | Enzyme converts this to a light signal for digital imaging. | WB |
| Fluorophores | Alexa Fluor dyes [18] | Emits light at a specific wavelength when excited. | IHC (IF) |
IHC and Western blot are complementary, not competing, techniques in the protein detection arsenal. The choice between them is dictated by the research question.
- Choose Immunohistochemistry (IHC) when the primary goal is to understand the spatial distribution, cellular context, and subcellular localization of a protein within a complex tissue. It is the preferred method for diagnostic pathology, tumor marker identification, and developmental biology studies [6] [17].
- Choose Western Blot (WB) when the goals are to confirm a protein's identity based on its molecular weight, obtain semi-quantitative data on its expression levels across different samples, or detect specific post-translational modifications that alter molecular weight [4].
For the most robust conclusions, particularly when working with a new antibody or an uncharacterized protein, the combined use of both techniques is highly powerful. Western blot can verify the antibody's specificity and the protein's size, while IHC can then be used with greater confidence to reveal the protein's precise location within the tissue.
Inherent Strengths and Limitations of Each Technique
In the fields of molecular biology and biomedical research, protein detection techniques are fundamental tools for understanding cellular function, disease mechanisms, and therapeutic development. Among the most established methods are Immunohistochemistry (IHC) and Western blotting, both leveraging the specific binding of antibodies to target antigens [6]. Despite this shared principle, each technique offers distinct capabilities and suffers from unique constraints that directly influence their application in research and diagnostics. IHC provides spatial context within tissue architecture, preserving morphological information that is destroyed by Western blot's requirement for tissue homogenization [1] [6]. Conversely, Western blot excels at providing molecular weight confirmation and semi-quantitative data about protein expression levels, advantages not inherent to standard IHC protocols [6] [4]. This article objectively compares the technical performance, applications, and limitations of IHC and Western blot to guide researchers in selecting the appropriate method for their specific experimental questions.
Fundamental Principles and Workflows
The core difference between IHC and Western blot lies in their treatment of the sample and the consequent information they can deliver. Understanding their fundamental workflows is essential for appreciating their respective strengths and limitations.
Immunohistochemistry (IHC) Workflow
IHC is designed to visualize the precise localization and distribution of antigens within intact tissue structures [1]. The process begins with tissue collection followed by chemical fixation—typically using formaldehyde-based fixatives—to preserve tissue architecture and prevent degradation [1] [2]. Fixed tissues are then embedded in paraffin or optimal cutting temperature (OCT) compound and sectioned into thin slices (3-5 µm) using a microtome or cryostat [2]. These sections are mounted on slides and may undergo antigen retrieval to reverse the cross-links formed during formalin fixation, which can mask epitopes and reduce antibody binding [1] [2]. Subsequent steps include blocking to prevent non-specific antibody binding, incubation with a primary antibody specific to the target antigen, and detection using enzyme-conjugated (e.g., HRP) or fluorescently-labeled secondary antibodies [1]. Finally, the stained tissues are visualized under a light or fluorescence microscope, allowing researchers to assess protein expression within specific cell types and subcellular compartments [1] [6].
Figure 1: IHC Workflow. The process preserves tissue architecture through fixation and thin sectioning, enabling spatial protein localization.
Western Blot Workflow
Western blot, in contrast, analyzes proteins from homogenized tissue or cell lysates, sacrificing spatial information for the ability to separate proteins by molecular weight [4] [10]. The initial step involves sample preparation using denaturing lysis buffers containing detergents like SDS and reducing agents such as DTT or β-mercaptoethanol to disrupt protein structures and break disulfide bonds [3] [10]. The protein concentration of the lysate is quantified using assays like Bradford or BCA to ensure equal loading across gels [10]. Proteins are then separated by SDS-polyacrylamide gel electrophoresis (SDS-PAGE), which resolves complex protein mixtures into discrete bands based on molecular weight [10]. The separated proteins are subsequently transferred (blotted) onto a membrane, typically nitrocellulose or PVDF, creating an replica of the gel [4] [10]. The membrane is blocked to prevent non-specific antibody binding and then probed with a primary antibody against the protein of interest, followed by an enzyme-conjugated secondary antibody [10]. Detection is achieved through chemiluminescent or fluorescent substrates, generating a signal that corresponds to the abundance of the target protein at its specific molecular weight [3] [10].
Figure 2: Western Blot Workflow. The process involves tissue/cell homogenization, protein separation by size, and transfer to a membrane for detection.
Comparative Analysis: Strengths and Limitations
The distinct methodologies of IHC and Western blot endow each technique with a unique profile of advantages and disadvantages. The table below provides a structured comparison of their inherent strengths and limitations.
Table 1: Direct comparison of IHC and Western blot techniques
| Parameter | Immunohistochemistry (IHC) | Western Blot |
|---|---|---|
| Spatial Resolution | High - Preserves tissue morphology and enables subcellular localization [1] [6] | None - Proteins are homogenized; no spatial information retained [6] |
| Quantitative Capability | Semi-quantitative at best - Subjective scoring (intensity, distribution); limited dynamic range [1] | Semi-quantitative/Quantitative - Densitometry allows for relative quantification between samples [4] [10] |
| Specificity & Validation | Lower - Staining is not checked against molecular weight; risk of off-target binding [6] | Higher - Size separation confirms target identity via molecular weight [6] [8] |
| Throughput & Automation | Moderate - Automated staining systems available (e.g., Tissue-Tek Genie) [21] | Moderate - Capillary electrophoresis systems enable automation [4] |
| Multiplexing Potential | Easily up to 4 targets; more possible with specialized unmixing [2] | Possible with fluorescent multiplexing or sequential blotting [2] |
| Sensitivity | Medium - Capable of detecting low abundance proteins in a localized context [2] | High - Can detect low abundance proteins, especially with prior enrichment [2] [3] |
| Sample Integrity | Analyzes proteins in their natural, fixed state [1] | Proteins are denatured and reduced; native state is lost [10] |
| Key Diagnostic Applications | Cancer subtyping, infectious disease identification, neurodegenerative disease diagnosis [1] [21] | HIV confirmatory testing, autoimmune disease diagnosis, BSE (prion disease) [6] [10] |
Key Strengths and Limitations Elaborated
Spatial Information vs. Molecular Weight Confirmation: The most significant trade-off lies between IHC's ability to localize proteins within a tissue context and Western blot's capacity to confirm a protein's identity based on its size. IHC is unparalleled for determining whether a protein is expressed in a specific cell type, its subcellular localization (nuclear, cytoplasmic, membrane), and its distribution pattern across a tissue section [1] [6]. This is critical in pathology for identifying tumor margins or characterizing the microenvironment. Western blot, however, provides an essential control for antibody specificity because the target protein should appear as a band at its expected molecular weight. This helps distinguish the actual protein from non-specific signals or proteolytic fragments, a validation not inherent to IHC [6] [8].
Quantitative Analysis and Dynamic Range: Western blot has a clear advantage in semi-quantification. Using densitometric analysis of band intensity, researchers can compare relative protein levels across different samples (e.g., treated vs. untreated) or assess post-translational modifications when combined with phospho-specific antibodies [4] [10]. The linear range of detection depends on the method but is generally broader than IHC. In contrast, IHC quantification is typically semi-quantitative, relying on scoring systems that categorize staining intensity (e.g., 0, 1+, 2+, 3+) and the percentage of positive cells [1]. This scoring is subjective and prone to inter-observer variability, though digital pathology and AI are emerging to address this limitation [1].
Sensitivity and Specificity Challenges: Both techniques are susceptible to antibody-related issues, a major contributor to the reproducibility crisis in science. A 2024 study systematically validating Tau antibodies found that performance is highly application-specific; many antibodies that worked well in Western blot failed in IHC and vice versa [8]. Over half of the Tau antibodies tested by Western blot showed non-specific binding to other proteins, while others failed to detect the target at endogenous levels [8]. This underscores the critical need for rigorous antibody validation for each specific application.
Experimental Data and Validation
Empirical data highlights the practical performance differences and complementarity of IHC and Western blot. A systematic investigation of 79 Tau antibodies for Western blot and 35 for IHC revealed critical application-specific performance issues [8]. While most antibodies detected overexpressed Tau, many failed at lower, physiological concentrations. Furthermore, over 50% of antibodies tested by Western blot showed non-specific binding to other proteins, and phosphorylation of Tau residues partially inhibited binding for many "total" Tau antibodies, including the popular Tau-5 clone [8]. This study underscores that antibody performance is context-dependent and that rigorous validation for each specific technique is paramount for reliable results.
Table 2: Key research reagents for IHC and Western blot analysis
| Reagent / Solution | Function | Technical Notes |
|---|---|---|
| Formaldehyde/PFA | Crosslinking fixative for IHC | Preserves tissue structure; can mask epitopes, often requiring antigen retrieval [2] |
| SDS (Sodium Dodecyl Sulfate) | Denaturing detergent for Western blot | Coats proteins with negative charge, allowing separation by molecular weight [10] |
| Primary Antibodies | Bind specifically to target antigen | Must be validated for the specific application (IHC or WB); clones perform differently [8] |
| HRP-Conjugated Secondary Antibodies | Detect bound primary antibodies | Enable enzymatic (DAB) or chemiluminescent detection in both techniques [1] [10] |
| Antigen Retrieval Buffers | Reverse formaldehyde cross-links | Critical for recovering antigenicity in FFPE tissues for IHC [1] |
| Protease & Phosphatase Inhibitors | Added to Western blot lysis buffers | Prevent protein degradation and maintain phosphorylation states during sample prep [3] [10] |
| Blocking Reagents (BSA, Non-fat Milk) | Reduce non-specific background | BSA is preferred for phospho-specific antibodies in WB due to casein in milk [10] |
| PVDF/Nitrocellulose Membranes | Immobilize proteins for Western blot | PVDF offers higher protein binding capacity and chemical resistance [10] |
IHC and Western blot are complementary, not interchangeable, techniques in the protein detection arsenal. The choice between them should be dictated by the specific research question. IHC is the superior technique when the experimental goal requires understanding the spatial distribution and cellular context of protein expression, such as in diagnostic pathology, characterizing tumor heterogeneity, or mapping protein expression in complex tissues like the brain [1] [6]. Western blot is the more appropriate method when the objectives include confirming a protein's identity based on molecular weight, obtaining semi-quantitative data on expression levels, or detecting specific proteoforms and post-translational modifications [4] [10]. For the most comprehensive analysis, particularly when investigating novel proteins or using unvalidated antibodies, employing both techniques in parallel can provide a more robust and validated dataset. IHC can reveal the biological context of expression, while Western blot can confirm the specificity of the detection and offer quantitative insights, together providing a more complete understanding of protein expression and function.
Methodology in Action: Choosing the Right Technique for Your Research Goal
Immunohistochemistry (IHC) stands as a cornerstone technique in molecular biology, combining principles from histology, immunology, and biochemistry to detect specific antigens or proteins within tissue samples while preserving their spatial context [22]. Unlike other protein detection methods like western blotting or enzyme-linked immunosorbent assay (ELISA) that require tissue homogenization, IHC offers the unique advantage of precisely locating target proteins within intact tissue architecture without digestion [22]. This spatial preservation makes IHC indispensable for both clinical diagnostics and research, particularly in the analysis of formalin-fixed paraffin-embedded (FFPE) tissues - the gold standard for surgical and pathological sample preservation worldwide [23] [22].
The extensive collections of FFPE samples in biobanks and pathology archives represent an invaluable yet underutilized resource for human biology and translational research [23]. Recent advances in spatial biology have further amplified IHC's importance, enabling researchers to visualize and quantify proteins exactly where cells produce and use them within complex tissues like the brain, where cellular heterogeneity and regional specialization play crucial roles in function [24]. This guide examines the complete IHC workflow for FFPE tissues, objectively compares its performance with western blotting, and explores emerging spatial multi-omics approaches that integrate protein localization with transcriptomic data.
Core Technique Comparison: IHC vs. Western Blot
Fundamental Principles and Applications
Table 1: Core Characteristics of IHC and Western Blot
| Characteristic | Immunohistochemistry (IHC) | Western Blotting |
|---|---|---|
| Spatial Context | Preserved - enables protein localization within tissue architecture | Destroyed - requires tissue homogenization |
| Protein Detection | Visualized in situ without digestion [22] | Requires protein extraction and denaturation |
| Primary Output | Protein localization and distribution patterns | Relative protein quantity and molecular weight |
| Tissue Requirements | FFPE or frozen sections [22] | Homogenized cell or tissue lysates [4] |
| Key Applications | Diagnostic pathology, spatial biology, cell typing [22] | Protein expression quantification, post-translational modification detection [4] |
| Advantages | Maintains tissue morphology, clinical relevance | Provides size information, semi-quantitative data [4] |
| Limitations | Semi-quantitative, subjective interpretation [22] | Loses spatial information, more complex sample prep [4] |
Technical Performance and Data Output
Table 2: Technical Comparison of Protein Detection Methods
| Performance Metric | IHC | Western Blot | ELISA |
|---|---|---|---|
| Sensitivity | High (single-cell detection possible) | Moderate to high [4] | High |
| Specificity | Dependent on antibody validation [25] | Dependent on antibody validation [4] | High |
| Quantification Capability | Semi-quantitative (scoring systems) [22] | Semi-quantitative to quantitative [4] | Fully quantitative |
| Molecular Weight Information | No | Yes - key advantage [4] | No |
| Multiplexing Potential | Moderate (recent advances to 8+ markers) [24] [26] | Low (typically single-plex) | Moderate |
| Throughput | Moderate to high (TMAs) [26] | Low to moderate [4] | High |
| Equipment Requirements | Standard microscopy (light or fluorescence) [22] | Electrophoresis and transfer systems [4] | Plate reader |
Western blotting provides critical information about protein size that IHC cannot offer, making it preferable for confirming the identity of specific protein isoforms or detecting cleavage products [4]. However, IHC's preservation of spatial context makes it indispensable for understanding tissue heterogeneity and cellular organization in both healthy and disease states [22].
The Complete IHC Workflow for FFPE Tissues
Sample Preparation and Fixation
The IHC workflow begins with proper tissue handling and fixation, which are crucial steps for preserving cellular integrity and preventing degradation during sample processing [22]. For FFPE tissues, chemical fixation - typically with 10% neutral buffered formalin - stabilizes cells and tissues while preserving morphological detail for diagnosis and specialized testing [22]. Effective fixation requires adequate sample size and sufficient fixative volume to ensure thorough penetration [22]. Following fixation, tissues undergo dehydration through increasing ethanol concentrations, clearing in xylene, and embedding in paraffin wax to create blocks that can be stored for decades and sectioned for analysis [23] [22].
Critical Protocol Steps and Optimization
Deparaffinization and Antigen Retrieval
For FFPE tissues, sections must be deparaffinized through heating at 60°C for 20 minutes followed by submersion in xylene for 15 minutes, then rehydrated through a graded ethanol series (100% to 50%) [26]. Antigen retrieval is crucial for reversing formaldehyde-induced crosslinks that obscure epitopes. Two main approaches exist:
- Heat-induced epitope retrieval (HIER): Using Tris-EDTA buffer (pH 9.0) at 65°C overnight, or citrate buffer (pH 6.0) [23] [26]
- Proteolytic-induced epitope retrieval (PIER): Utilizing proteinase K or pepsin treatments [23]
Recent spatial FFPE-ATAC-seq research has demonstrated that optimal retrieval conditions using Tris-EDTA buffer (pH 9.0) at 65°C with proteinase K digestion (10 ng/μl for 45 minutes) significantly improve biomolecule accessibility while preserving tissue architecture [23].
Blocking and Antibody Incubation
Non-specific binding is minimized through blocking with proteins like bovine serum albumin (BSA) at 2-5% concentration, normal serum, or commercial blocking buffers [27]. BSA's chemical inertness, high solubility, and low cross-reactivity make it particularly effective for blocking unoccupied surfaces while maintaining antibody stability [27]. Primary antibody incubation typically occurs overnight at 4°C in a moist chamber, followed by species-appropriate secondary antibodies conjugated to enzymes (HRP or AP) or fluorophores [22] [26].
Detection and Counterstaining
Signal detection employs chromogenic substrates (DAB for brown, Fast Red for red) for brightfield microscopy or fluorophores (Alexa Fluor dyes) for fluorescence detection [24] [26]. Counterstaining with hematoxylin (for chromogenic) or DAPI (for fluorescent) provides structural context, helping antibody-stained cells "stand out more" and pinpointing their exact location in the tissue [27].
Advanced Spatial Multi-Omics: Integrating IHC with Transcriptomics
Dual RNA-Protein Detection Techniques
The integration of IHC with in situ hybridization (ISH) represents both a significant opportunity and technical challenge in spatial multi-omics [24]. This approach enables researchers to correlate gene expression patterns with protein abundance and localization in the same tissue section, providing unprecedented insights into coordinated molecular changes in normal development and disease [24]. However, standard IHC and ISH conditions directly conflict - IHC antibodies degrade during protease treatments that ISH requires, while RNases present during IHC protocols destroy RNA targets [24].
Recent protocol modifications successfully address these competing demands:
- RNase inhibition: Using recombinant ribonuclease inhibitors to preserve RNA during antibody incubation [24]
- Antibody crosslinking: Fixing antibodies to tissues after IHC labeling to protect protein signals during ISH pretreatments [24]
- Sequential detection: Careful optimization of detection order and conditions to preserve both biomolecules
These advances enable robust dual detection of both protein and mRNA targets in the same tissue section, as demonstrated in mouse brain studies successfully mapping both RNA (Gad2, Ppib) and protein (GFAP, HuC/HuD) markers in hippocampal regions [24].
High-Throughput and Automated IHC Approaches
Traditional IHC analysis has been limited by subjective manual assessment, inter-observer variability, and low throughput [26]. Recent advances in ImmunoHistoFluorescence (IHF) combine IF, automated microscopy, and AI-based image analysis to enable precise investigation of complex protein localization patterns in tissue samples at scale [26]. This approach overcomes previous limitations of tissue IF including limited antibody penetration, autofluorescence artifacts, and weak signals through optimized antigen retrieval, automated acquisition, and computational analysis [26].
Research Reagent Solutions and Experimental Materials
Essential Reagents for IHC Workflows
Table 3: Key Research Reagents for IHC Experiments
| Reagent Category | Specific Examples | Function & Importance |
|---|---|---|
| Fixation Agents | 10% Neutral Buffered Formalin [22] | Preserves tissue architecture and antigen integrity |
| Antigen Retrieval Buffers | Tris-EDTA (pH 9.0), Citrate Buffer (pH 6.0) [23] | Reverses formaldehyde crosslinks, exposes epitopes |
| Blocking Agents | BSA (2-5%), Normal Serum, Non-fat Dry Milk [27] | Reduces non-specific antibody binding |
| Primary Antibodies | Validated monoclonal/polyclonal antibodies [25] | Specifically binds target antigens |
| Detection Systems | HRP-conjugated secondaries, Alexa Fluor dyes [24] [26] | Enables visualization of bound antibodies |
| Mounting Media | Fluoromount with DAPI [26] | Preserves samples and provides nuclear counterstain |
| Validation Tools | Knock-out cell lines, isotype controls [25] | Confirms antibody specificity and assay reliability |
Antibody Validation and Performance Considerations
Antibody quality remains a critical factor in IHC reproducibility and reliability. Independent validation studies comparing commercial antibodies across common applications reveal significant performance variations [25]. Recent comprehensive assessments show recombinant antibodies demonstrate up to 30% higher pass rates compared to polyclonal antibodies, with success rates of 97% for western blot, 55% for immunoprecipitation, and 83% for immunocytochemistry using standardized protocols [25]. These findings underscore the importance of using properly validated reagents, with recombinant antibodies offering superior consistency between batches due to their sequence-defined nature [25].
IHC and western blotting serve complementary roles in protein detection research. IHC excels when spatial context, cellular heterogeneity, and tissue architecture preservation are paramount, particularly for clinical diagnostics and spatial biology applications [22]. Western blotting remains preferable for protein quantification, molecular weight determination, and post-translational modification studies where spatial information is less critical [4]. The emerging integration of IHC with transcriptomic techniques through spatial multi-omics approaches represents a powerful frontier in biological research, enabling unprecedented correlation of protein localization with gene expression patterns in intact tissues [24]. As antibody validation efforts improve and spatial technologies advance, IHC will continue to evolve as an indispensable tool for bridging microscopic anatomy with molecular mechanisms in health and disease.
Western blotting remains a cornerstone technique in molecular biology and biochemistry for identifying and quantifying specific proteins within a complex mixture. This method combines the size-based separation power of gel electrophoresis with the specificity of antibody-based immunodetection, allowing researchers to analyze protein expression, post-translational modifications, and molecular weight. When compared alongside immunohistochemistry (IHC) for protein detection research, western blot provides complementary information; while IHC excels at visualizing protein localization within tissue architecture, western blot offers superior capabilities for determining molecular weight and semi-quantitative analysis of protein abundance [6] [28] [2]. The technique was first coined by Dr. Burnette in 1981 and has since evolved into a standardized protocol utilized across research and clinical laboratories worldwide [10].
A critical consideration in protein detection research is understanding that antibody performance is highly context-dependent [19] [29]. An antibody that performs well in western blot may not function adequately in IHC applications due to differences in protein conformation, target accessibility, and sample processing methods [19] [30]. This application-specific performance underscores the importance of technique selection based on research objectives and proper validation of reagents within the intended experimental context.
Western Blot Workflow: Step-by-Step Methodology
Stage 1: Sample Preparation and Protein Extraction
Proper sample preparation is fundamental for successful western blotting, as inadequate preparation can compromise subsequent steps and result in unreliable data [10] [31].
Cell Culture Lysate Preparation:
- Lysis Buffer Composition: Use appropriate lysis buffers such as RIPA buffer for total protein extraction or non-denaturing buffers for native proteins. Include protease inhibitor cocktails to prevent protein degradation and phosphatase inhibitors when studying phosphorylated proteins [31].
- Cell Processing: Wash suspension cells twice with PBS by centrifugation (100–500 × g, 5 min, 4°C) and resuspend in ice-cold lysis buffer. For adherent cells, detach mechanically or enzymatically before similar washing and resuspension [31].
- Lysis Protocol: Incubate cells in lysis buffer for 10 minutes at 4°C with rocking, followed by sonication to ensure complete cell disruption. Centrifuge at 14,000–17,000 × g for 5 minutes at 4°C to pellet insoluble debris, then transfer the supernatant (containing soluble proteins) to a fresh tube [31].
Tample Preparation:
- Rapidly dissect tissue with clean tools on ice to prevent protease degradation [31].
- Homogenize tissue samples using automated homogenizers with glass beads in lysis buffer (approximately 1,200 μL buffer per 200 mg tissue) for approximately 3 minutes at 4°C [31].
- Centrifuge homogenate at 14,000–17,000 × g for 5–10 minutes at 4°C and collect supernatant for analysis [31].
Protein Quantification and Normalization:
- Determine protein concentration using Bradford or BCA colorimetric assays against known protein standards [10] [31].
- Normalize samples to equal protein concentrations using cell lysis buffer, then add an equal volume of Laemmli sample buffer (1:1 ratio) [10].
- Laemmli buffer components serve specific functions: glycerol adds density for gel loading, bromophenol blue provides a visible dye front, SDS denatures proteins and imparts negative charge, beta-mercaptoethanol reduces disulfide bonds, and Tris-HCl buffers the system [10].
- Heat samples at 100°C for 10 minutes to fully denature proteins before loading [31].
Stage 2: Gel Electrophoresis and Protein Separation
Protein separation by molecular weight occurs through sodium dodecyl sulfate-polyacrylamide gel electrophoresis (SDS-PAGE), which utilizes a discontinuous buffer system to achieve sharp protein bands [10].
Table 1: Gel Selection Guidelines Based on Protein Size
| Protein Size Range | Recommended Gel System | Running Buffer | Loading Recommendations |
|---|---|---|---|
| 10–30 kDa | 4–12% acrylamide gradient Bis-Tris | MES | 10–40 μg lysate protein; 10–500 ng purified protein |
| 31–150 kDa | 4–12% acrylamide gradient Bis-Tris | MOPS | 10–40 μg lysate protein; 10–500 ng purified protein |
| >150 kDa | 3–8% acrylamide gradient Tris-Acetate | Tris-Acetate | 10–40 μg lysate protein; 10–500 ng purified protein |
| General purpose | 10–15% fixed-concentration Tris-Glycine | Tris-Glycine | 10–40 μg lysate protein; 10–500 ng purified protein |
Electrophoresis Procedure:
- Load equal protein quantities alongside molecular weight markers ("protein ladder") in adjacent lanes to enable molecular weight determination [10] [31].
- Apply electrical current to drive protein migration through the gel matrix. Smaller proteins migrate faster through the porous gel, while larger proteins migrate more slowly [10] [31].
- The Laemmli discontinuous buffer system uses a stacking gel with larger pores and acidic pH to concentrate proteins into a narrow band before they enter the resolving gel with smaller pores and basic pH where separation occurs [10].
- Run gels according to manufacturer recommendations, optimizing time and voltage based on the specific apparatus and target protein size [31].
Diagram 1: Complete Western Blot Workflow from Sample Preparation to Analysis
Stage 3: Protein Transfer and Membrane Blocking
Following electrophoresis, separated proteins are transferred from the gel onto a solid membrane support for antibody probing [10].
Transfer Methods:
- Wet Transfer: Uses tank system with large buffer volume, typically performed at low voltage overnight. Provides high efficiency across a wide range of protein sizes and is particularly effective for large proteins (>100 kDa) [10].
- Semi-Dry Transfer: Uses pre-soaked filter sandwiches with transfer time under one hour. More time-efficient but may have reduced efficiency, especially for large proteins [10].
- Transfer Buffer: Towbin buffer (25 mM Tris, 192 mM glycine, 20% methanol, pH 8.3) is standard. Methanol facilitates protein binding to membranes but can reduce transfer efficiency for large proteins; SDS can be added to improve large protein transfer [10].
Membrane Selection:
- Nitrocellulose: Traditional choice with good protein binding capacity. Fragile and less durable for reprobing [10].
- PVDF (Polyvinylidene Difluoride): Superior protein binding capacity, chemical resistance, and mechanical strength. Allows membrane stripping and reprobing. Requires pre-wetting in methanol before use [10].
Blocking:
- Incubate membrane with blocking agents such as 5% bovine serum albumin (BSA) or non-fat dry milk in TBST to prevent non-specific antibody binding [31] [32].
- Blocking time typically ranges from 1 hour at room temperature to overnight at 4°C, depending on target abundance and antibody specificity [31].
Stage 4: Immunodetection and Signal Development
Antibody probing enables specific detection of the target protein through antigen-antibody interactions [31] [32].
Primary Antibody Incubation:
- Dilute primary antibody in blocking buffer or specialized antibody diluents according to manufacturer recommendations [31].
- Incubate membrane with primary antibody for 1–2 hours at room temperature or overnight at 4°C for enhanced sensitivity [31].
- Wash membrane thoroughly with TBST (3 × 5–10 minutes) to remove unbound primary antibody [31].
Secondary Antibody Selection:
- Choose enzyme-conjugated (HRP or AP) or fluorophore-conjugated secondary antibodies directed against the host species of the primary antibody [32].
- Indirect detection using conjugated secondary antibodies provides signal amplification, as multiple secondary antibodies can bind to each primary antibody [32].
- For western blotting after immunoprecipitation, use light chain-specific secondary antibodies to avoid interference from IP antibody heavy chains when detecting proteins around 50 kDa [32].
- Incubate with appropriately diluted secondary antibody for 1 hour at room temperature, followed by thorough washing with TBST [31].
Detection Methods:
- Chemiluminescent: HRP-conjugated antibodies catalyze oxidation of luminol substrates, producing light detectable by X-ray film or digital imaging systems. Offers high sensitivity and dynamic range [31].
- Fluorescent: Fluorophore-conjugated antibodies enable direct detection without substrates. Allows multiplexing of multiple targets and provides stable signals for quantitative analysis [28] [33].
- Colorimetric: Enzyme substrates produce insoluble colored precipitates at the target location. Less sensitive but provides permanent visual record [6].
Comparative Analysis: Western Blot vs. Immunohistochemistry
When designing protein detection experiments, understanding the complementary strengths and limitations of western blot and IHC is essential for appropriate technique selection [6] [28].
Table 2: Western Blot vs. Immunohistochemistry Comparison
| Parameter | Western Blot | Immunohistochemistry (IHC) |
|---|---|---|
| Sample Type | Cell or tissue lysates [28] | Intact tissue sections [28] |
| Protein State | Denatured, linearized epitopes [31] | Native conformation in cellular context [2] |
| Key Strengths | Molecular weight determination, semi-quantification, post-translational modification detection [33] | Cellular and subcellular localization, tissue architecture preservation [28] |
| Limitations | No spatial information, requires protein extraction [6] | Semi-quantitative at best, no molecular weight information [6] |
| Throughput | Medium, limited multiplexing capability [33] | Low to medium, but enables multiplexing [2] |
| Data Output | Band intensity proportional to protein amount [6] | Cellular staining patterns indicating protein distribution [2] |
| Antibody Concerns | Recognizes denatured linear epitopes [19] | Requires antibodies recognizing native conformation [19] |
Technique Selection Criteria:
- Choose Western Blot when research questions involve protein molecular weight confirmation, semi-quantitative comparison of protein abundance between samples, detection of post-translational modifications, or analysis of protein expression in homogeneous cell populations [33].
- Choose IHC when research questions involve determining protein localization within tissue architecture, analyzing protein expression in heterogeneous cell populations, or examining subcellular distribution patterns [28] [2].
Essential Reagents and Research Solutions
Successful western blotting requires optimized reagents and materials at each workflow stage [10] [31] [32].
Table 3: Essential Western Blot Reagents and Their Functions
| Reagent Category | Specific Examples | Function and Purpose |
|---|---|---|
| Lysis Buffers | RIPA buffer, Non-denaturing lysis buffers | Extract proteins from cells or tissues while maintaining integrity of target epitopes [31] |
| Protease Inhibitors | PMSF, Complete protease inhibitor cocktails | Prevent protein degradation during extraction by inhibiting endogenous proteases [31] |
| Electrophoresis | SDS-PAGE gels, Tris-Glycine/MOPS/MES running buffers | Separate denatured proteins based on molecular weight [10] [31] |
| Transfer Systems | Nitrocellulose membranes, PVDF membranes, Towbin transfer buffer | Immobilize separated proteins for antibody probing [10] |
| Blocking Agents | BSA, non-fat dry milk | Prevent non-specific antibody binding to membrane [31] [32] |
| Detection Antibodies | HRP-conjugated secondary antibodies, fluorescent secondaries | Enable specific target detection with signal amplification [32] |
| Detection Substrates | ECL, SuperSignal West Dura, fluorescent scanners | Generate measurable signal corresponding to target protein abundance [31] [33] |
Troubleshooting and Quality Considerations
Common Challenges and Solutions:
- High Background: Increase blocking time, optimize antibody concentrations, extend wash times, or change blocking agents [31] [32].
- Weak or No Signal: Check antibody specificity using positive controls, increase protein loading, enhance detection sensitivity with signal amplification, or verify antigen accessibility [19] [30].
- Non-Specific Bands: Include isotype controls, use monoclonal instead of polyclonal antibodies, or try different antibody clones [30].
- Poor Transfer Efficiency: Verify membrane compatibility with transfer method, adjust methanol concentration in transfer buffer, or extend transfer time for high molecular weight proteins [10].
Antibody Validation Concerns: Recent comprehensive studies highlight that antibody performance is highly context-dependent, with significant variability between applications [19] [29] [30]. Systematic validation of 79 Tau antibodies revealed that over half exhibited non-selective binding to other proteins in western blot applications, emphasizing the necessity of application-specific antibody validation [30]. When selecting antibodies, prioritize those specifically validated for western blotting rather than assuming cross-application functionality [19] [29].
Quantitative Considerations: While western blot provides semi-quantitative data, several factors affect quantitative accuracy:
- Ensure linear range of detection by testing multiple exposure times and protein loads [33].
- Include loading controls (e.g., housekeeping proteins) to normalize for variations in total protein loading [10].
- Use appropriate image analysis software for densitometric measurement of band intensity [10].
- For precise quantification, consider complementary techniques such as ELISA which may offer better quantitative accuracy for absolute protein concentration determination [33].
The western blot workflow, from cell lysis to semi-quantitative band detection, provides researchers with a powerful tool for protein analysis that complements rather than replaces techniques like IHC. While western blot excels at determining molecular weight and providing semi-quantitative data on protein abundance, IHC offers superior spatial context within tissues and cells [6] [28]. The technique's enduring value lies in its ability to specifically detect target proteins in complex mixtures, provide information on protein size and modification state, and generate reproducible, semi-quantifiable data [33].
Understanding the application-specific limitations of antibodies is crucial for experimental design and data interpretation [19] [30]. As research continues to advance, western blotting maintains its position as an essential technique in the molecular biology toolkit, particularly when applied alongside complementary methods like IHC to provide a more comprehensive understanding of protein expression and function.
In the fields of cancer research and diagnostics, the ability to accurately detect and localize specific proteins is paramount. Two of the most pivotal techniques for protein analysis are Immunohistochemistry (IHC) and Western blot. While both leverage the specific binding of antibodies to target antigens, they provide fundamentally different types of information [6]. IHC excels at visualizing the spatial distribution of proteins within the context of intact tissue architecture, making it indispensable for diagnostics and biomarker mapping [1] [34]. In contrast, Western blot is a quantitative technique that separates proteins by molecular weight, providing information on protein presence and relative amount in a lysate [10]. This guide offers a detailed, objective comparison of these two techniques, focusing on their application in cancer research and the critical role of IHC in advancing personalized medicine.
Technical Comparison: IHC vs. Western Blot
The core difference between these techniques lies in their output: IHC provides contextual, spatial data, while Western blot provides quantitative, size-based data.
The table below summarizes their key characteristics:
| Feature | Immunohistochemistry (IHC) | Western Blot |
|---|---|---|
| Sample Type | Tissue sections (frozen or paraffin-embedded) [6] [34] | Cell or tissue extracts (lysates) [6] [34] |
| Protein State | In situ, fixed [2] | Denatured [10] |
| Key Output | Localization and distribution of protein within tissue structure [1] | Presence and relative quantity of protein based on molecular weight [6] |
| Spatial Context | Preserved; allows visualization in morphological context [1] [34] | Lost during sample homogenization [6] |
| Multiplexing Capability | Easily multiplexed to detect multiple targets simultaneously (e.g., 4+ colors) [2] | Limited multiplexing; possible with fluorescent tags but challenging [2] |
| Quantification | Semi-quantitative (based on staining intensity and distribution) [1] | Quantitative (densitometric analysis of bands) [10] |
| Primary Applications | Diagnostics, biomarker discovery and mapping, subcellular localization, tumor classification [1] [35] | Confirmatory protein detection, measuring expression levels, studying protein modifications [36] [34] |
A key advantage of IHC is its ability to determine the subcellular compartmentalization of proteins and analyze expression in mixed cell populations directly from tissue, which is highly limited in Western blot [2]. Conversely, Western blot's most prominent advantage is its ability to generate a signal proportional to the amount of target protein and confirm its molecular weight [6].
The following diagram illustrates the fundamental workflows for each technique, highlighting their distinct processes from sample to result:
IHC in Action: Cancer Biomarker Mapping
IHC is a cornerstone technique in modern pathology, playing a critical diagnostic, prognostic, and predictive role in oncology [1].
Key Clinical Applications of IHC
- Diagnosis and Tumor Classification: IHC is used to identify the cell type and origin of a cancer, which is crucial for determining the appropriate treatment strategy. For example, it is used to distinguish between different subtypes of carcinoma, lymphoma, and sarcoma [1].
- Prognostic Biomarkers: The technique helps identify biomarkers that provide information about the likely course of the disease, such as the proliferation marker Ki-67, which indicates how quickly tumor cells are dividing [1] [2].
- Predictive Biomarkers: IHC is vital for detecting proteins that predict response to specific targeted therapies. The most established examples are the detection of hormone receptors (ER/PR) and the HER2 protein in breast cancer, which directly determine eligibility for hormone therapy or HER2-targeted drugs like trastuzumab [1] [37].
- Infectious Disease Identification: IHC can pinpoint the presence of infectious agents within tissues, such as viruses associated with cancer (e.g., HPV in cervical cancer) [1].
Experimental Data: p53 Detection as a Case Study
The performance of IHC as a detection method can be evaluated by comparing its results with genetic sequencing. A study on urothelial bladder carcinoma provides quantitative data on the sensitivity and specificity of IHC for detecting p53 protein overexpression, using polymerase chain reaction-single strand conformational polymorphism (PCR-SSCP) as the genetic "gold standard" [38].
- Overall Performance: The study found IHC had a sensitivity of 65.8% and a specificity of 62.9% when using a 20% cutoff for immunopositivity [38].
- Performance in Aggressive Tumors: The test performance varied with tumor grade and stage. Sensitivity was higher in G3 tumors (75%) and infiltrating tumors (71.4%), indicating a stronger correlation between p53 mutation and protein overexpression in more advanced disease [38].
- Limitations: The study also documented false negatives in 28.5% of infiltrating tumors and false positives in 33.4% of superficial tumors, underscoring the importance of interpreting IHC results in conjunction with other clinical and pathological data [38].
This data highlights that while IHC is a powerful tool for routine clinical practice, its results should be interpreted with an understanding of its performance characteristics.
Essential Protocols for Robust Results
Detailed IHC Protocol for Formalin-Fixed Paraffin-Embedded (FFPE) Tissues
The following is a standard protocol for IHC on FFPE tissue sections, which are the most common sample type in clinical pathology [1] [2].
1. Sample Preparation and Deparaffinization:
- Cut tissue sections to 3-5 µm thickness and mount on slides [6].
- Deparaffinize by immersing slides in xylene (or a safe substitute), followed by rehydration through a series of graded alcohols (100%, 95%, 70%) and finally distilled water [2].
2. Antigen Retrieval:
- This critical step reverses the formaldehyde-induced cross-links that mask epitopes. The most common method is heat-induced epitope retrieval (HIER) [1].
- Immerse slides in a retrieval buffer (e.g., citrate-based, pH 6.0 or Tris-EDTA, pH 9.0) and heat in a pressure cooker, steamer, or water bath for 10-20 minutes [1] [2].
- Cool slides to room temperature and rinse with distilled water.
3. Immunostaining:
- Blocking: Incubate sections with a protein block (e.g., normal serum or BSA) for 10-30 minutes to minimize non-specific antibody binding [2].
- Primary Antibody: Apply the optimized dilution of the primary antibody against the target antigen. Incubate at room temperature for 1 hour or at 4°C overnight in a humidity chamber [2].
- Washing: Rinse slides with a wash buffer (e.g., PBS or TBS with a mild detergent).
- Secondary Antibody: Apply an enzyme-conjugated (e.g., HRP) or fluorophore-conjugated secondary antibody for 30-60 minutes at room temperature [1] [2].
4. Detection and Visualization:
- For chromogenic detection (e.g., HRP), apply a substrate such as 3,3'-Diaminobenzidine (DAB), which produces a brown precipitate at the antigen site [2].
- For fluorescent detection, no substrate is needed; the fluorophore is directly visualized under a microscope with the appropriate excitation light [2].
5. Counterstaining and Mounting:
- Counterstain with hematoxylin (for chromogenic) or DAPI (for fluorescent) to visualize cell nuclei [1].
- Mount slides with an aqueous mounting medium for immediate viewing or a permanent mounting medium for long-term storage [2].
Key Research Reagent Solutions for IHC
The reliability of IHC results is heavily dependent on the quality and appropriate use of reagents.
| Reagent / Solution | Function | Key Considerations |
|---|---|---|
| Fixatives (e.g., Formalin, PFA) | Preserves tissue architecture and prevents degradation by cross-linking proteins [1] [2]. | Over-fixation can mask epitopes; requires optimization of fixation time [2]. |
| Antigen Retrieval Buffer | Reverses cross-linking from formalin fixation to expose hidden antibody epitopes [1]. | Buffer pH (6 vs. 9) and retrieval method (pressure cooker, steamer) must be optimized for each antibody [1]. |
| Blocking Serum | Reduces background (noise) by occupying non-specific protein-binding sites on the tissue [2]. | Typically, a normal serum from the species in which the secondary antibody was raised [2]. |
| Validated Primary Antibodies | Binds specifically to the protein target (antigen) of interest [35]. | Crucial: Antibodies must be validated for IHC; performance in Western blot does not guarantee IHC specificity [36] [35]. |
| Labeled Secondary Antibodies | Binds to the primary antibody and carries a detectable label (enzyme or fluorophore) [1]. | Conjugate (HRP, AP, fluorophore) must be chosen based on the detection method [2]. |
| Chromogenic Substrate (e.g., DAB) | For enzyme-based detection, produces an insoluble colored precipitate at the antigen site [2]. | Provides a permanent stain; compatible with brightfield microscopy [2]. |
The Scientist's Toolkit: Validation and Quality Control
A significant challenge in IHC is ensuring that an antibody is specific for its intended target in the context of a tissue section. An antibody that recognizes a single band on a Western blot may recognize multiple proteins in IHC due to differential epitope availability [35].
Essential Validation Strategies
- Use of Controls: Every IHC run must include a positive control (a tissue known to express the target antigen) and a negative control (where the primary antibody is omitted) to validate the staining protocol and assess background levels [1] [35].
- Orthogonal Validation: Confirming IHC findings with a complementary technique, such as Western blot or mass spectrometry, strengthens the validity of the results [36].
- Genetic Controls: The most robust validation method involves using knockout tissue or cell lines that lack the target gene. Staining should be absent in the knockout, confirming antibody specificity [36].
Navigating Common Pitfalls
- Non-Specific Staining: Often caused by inadequate blocking, improper antibody concentration, or incomplete removal of endogenous enzymes (e.g., peroxidases) [1].
- Weak Signal: Can result from insufficient antigen retrieval, overly diluted primary antibody, or under-fixation [1].
- High Background: Frequently due to poor washing steps, over-fixation, or drying of the tissue section during processing [1].
The following diagram outlines a logical workflow for validating an IHC antibody and troubleshooting common issues:
Immunohistochemistry remains an irreplaceable technique in cancer diagnostics and research due to its unique ability to provide spatial context for protein expression within intact tissue. While Western blot serves as an excellent complementary tool for quantitative protein analysis and confirmation, it cannot replace the diagnostic power of seeing a biomarker's location and distribution.
The future of IHC is being shaped by digital pathology and artificial intelligence (AI). Digital platforms allow for high-throughput slide scanning, and AI algorithms are increasingly being developed to assist in the automated, objective interpretation of complex staining patterns [1]. Furthermore, advances in multiplexed IHC enable the simultaneous visualization of multiple biomarkers on a single tissue section, providing a more comprehensive picture of the tumor microenvironment and immune cell interactions [1]. These technological advancements promise to enhance the reproducibility, quantification, and informational depth of IHC, solidifying its role as a cornerstone of personalized cancer medicine.
In the field of protein detection research, scientists often choose between two primary techniques: immunohistochemistry (IHC) and western blot. While both exploit the specific binding of antibodies to antigens, they serve distinct purposes and provide different types of information. IHC excels at localizing proteins within tissue structures, providing spatial context by visualizing the presence of targeted antigens within a tissue sample through enzymatic or fluorescent signals [6]. In contrast, western blot (also known as protein immunoblot) separates proteins by molecular weight before detection, allowing researchers to confirm a protein's identity based on size and to obtain semi-quantitative data on protein expression levels [6] [39]. This article explores the specific applications of western blot in HIV diagnosis, protein sizing, and quantification, positioning it within the broader context of protein detection research methodologies.
Core Principles and Comparative Advantages
Fundamental Workflow of Western Blotting
The western blot technique employs a three-element process to achieve its task of separating and identifying a specific protein from a complex mixture: (1) separation by size via gel electrophoresis, (2) transfer of proteins to a solid support membrane, and (3) immunodetection of the target protein using labeled antibodies [39]. The process begins with protein extraction using specialized cell lysis buffers and protease inhibitors to prevent degradation [10]. Proteins are then denatured and coated with the anionic detergent sodium dodecyl sulfate (SDS), which masks their native charge and shape, rendering their migration during electrophoresis solely dependent on molecular weight [10].
Following separation by SDS-polyacrylamide gel electrophoresis (SDS-PAGE), proteins are electrophoretically transferred onto a membrane, typically nitrocellulose or polyvinylidene difluoride (PVDF) [10] [39]. The membrane is then incubated with a primary antibody specific to the target protein, followed by a secondary antibody conjugated to a reporter molecule (e.g., an enzyme or fluorescent dye) that enables visualization [32]. This indirect detection method, using a conjugated secondary antibody, provides greater assay sensitivity and flexibility than direct detection methods, as multiple secondary antibodies can bind each primary antibody, effectively amplifying the signal [32].
The following diagram illustrates this multi-stage workflow:
Western Blot vs. Immunohistochemistry: A Comparative Analysis
The selection between western blot and IHC depends heavily on the research question, as each technique offers distinct advantages and limitations. The table below summarizes the key differences:
Table 1: Comparison of Western Blot and Immunohistochemistry Techniques
| Parameter | Western Blot | Immunohistochemistry (IHC) |
|---|---|---|
| Primary Application | Protein identification, sizing, and semi-quantification [6] [39] | Protein localization within tissue context [6] |
| Sample Type | Tissue homogenates or protein extracts [39] | Tissue sections (typically 3-5 µm) [6] |
| Key Output | Molecular weight determination and quantitative comparison [10] | Cellular and subcellular localization of target protein [6] |
| Quantitative Capability | Semi-quantitative to quantitative with proper controls [40] | Qualitative to semi-quantitative [6] |
| Throughput | Moderate; can detect multiple targets simultaneously [6] | Lower; typically single-plex per section |
| Molecular Weight Confirmation | Yes; includes size ladder for confirmation [6] | No; no molecular weight reference [6] |
| Key Advantage | Verification of target protein size and amount [6] | Preservation of morphological context [6] |
| Principal Limitation | Loss of spatial/tissue context [6] | Inability to confirm protein size [6] |
IHC's principal strength lies in its ability to detect the exact location of a target protein within a tissue sample, making it invaluable in fields like neuroscience for investigating protein expression in specific brain regions [6]. However, a significant limitation is that IHC stains "are not checked against a molecular weight ladder," leaving open the possibility that observed staining may not be conclusively related to the specific protein of interest [6].
Conversely, western blot provides size-based verification of the target protein through comparison with a molecular weight marker [10] [6]. This technique is particularly advantageous for gathering quantitative data and has proven effective at generating a signal proportional to the amount of target protein in the sample [6]. Western blot also enables the simultaneous detection of multiple target proteins, significantly reducing testing time and resource requirements [6]. However, it loses all spatial and tissue architecture context during the protein extraction process [39].
Application 1: HIV Diagnosis and Confirmatory Testing
The Role of Western Blot in HIV Testing Algorithms
Western blotting has played a historically significant role as a confirmatory test in HIV diagnostics. The confirmatory HIV test employs a western blot to detect anti-HIV antibodies in human serum samples [39]. In this application, known HIV-infected cell proteins are separated by electrophoresis and blotted onto a membrane [39]. The patient's serum is then applied as the primary antibody source; if HIV-specific antibodies are present, they bind to their target viral antigens on the membrane [39]. After washing, a secondary anti-human antibody conjugated to an enzyme signal is added, and stained bands indicate the specific HIV proteins to which the patient's serum contains antibodies [39].
While the Centers for Disease Control and Prevention (CDC) no longer recommends the western blot test as a primary diagnostic tool, it remains important for historical reference and in laboratories that continue to utilize the technique [10]. The methodology exemplifies how western blotting provides high specificity through its ability to resolve multiple individual antigen-antibody reactions simultaneously, a crucial feature for differentiating true positive results from cross-reactive antibodies in screening tests.
Application 2: Protein Sizing and Identification
Molecular Weight Determination via SDS-PAGE
The foundation of western blot protein sizing lies in the separation of denatured proteins by molecular weight using SDS-PAGE (SDS-polyacrylamide gel electrophoresis) [10] [39]. The SDS detergent coats denatured proteins with a uniform negative charge-to-mass ratio, effectively masking proteins' native charge, shape, and size characteristics [10]. This process ensures that protein migration through the polyacrylamide gel matrix is inversely proportional to the logarithm of their molecular mass, with smaller proteins migrating faster than larger ones [10].
A critical component of this separation is the inclusion of a molecular weight marker (protein ladder) in one lane of the gel [10]. This commercially available mixture of proteins of known molecular weights, typically stained to form visible, colored bands, serves as a reference standard against which the relative molecular weights of unknown proteins can be estimated [39]. The percentage of acrylamide in the gel determines resolution capacity—higher acrylamide concentrations better resolve lower molecular weight proteins, while lower concentrations improve resolution of higher molecular weight proteins [39].
Case Study: Differentiating Prion Protein Isoforms in BSE Diagnosis
Western blot's capability to differentiate protein variants based on molecular weight is powerfully illustrated in its application for diagnosing transmissible spongiform encephalopathies (TSEs), including bovine spongiform encephalopathy (BSE or "mad cow disease") [41] [39]. Research has identified three distinct forms of BSE—classical (C-), low (L-), and high (H-) type—which can be discriminated through western blot analysis of the protease-resistant prion protein (PrPSc) [41].
A comparative study evaluating confirmatory methods for BSE found that western blot techniques effectively differentiated these forms based on the specific molecular weight and glycoform ratios of the PrPSc unglycosylated band [41]. The L-type BSE displays faster electrophoretic mobility of its unglycosylated PrPSc moiety compared to C-type, while H-type BSE shows a higher molecular weight for the same fragment [41]. This precise molecular discrimination, combined with differences in glycoform profiles, enables reliable identification and differentiation of classical and atypical BSE forms, showcasing western blot's critical role in protein identification and disease surveillance [41].
Application 3: Protein Quantification and Normalization Strategies
Quantitative Western Blot Methodologies
While traditional western blotting is useful for detecting protein presence or absence, methodological advancements now enable quantitative assessment of protein expression differences [40]. The transition from qualitative to quantitative analysis requires careful attention to experimental parameters, particularly signal linearity and appropriate normalization [40].
Quantification relies on the principle that, within a certain range, the signal intensity of a protein band exhibits a linear relationship with the amount of protein loaded [42]. Outside this linear range of detection, the relationship between protein amount and measured signal becomes unknown, making relative measurements unrepresentative of actual protein quantity [42]. Several factors can cause signal saturation, including membrane saturation (when sample proteins exceed the membrane's binding capacity), film saturation (with traditional chemiluminescence), or detector saturation in digital imaging systems [42].
Table 2: Optimization Parameters for Quantitative Western Blotting
| Parameter | Impact on Quantification | Optimization Strategy |
|---|---|---|
| Protein Loading | Excessive protein causes signal saturation, distorting quantitation [40] | Load smaller amounts (1-10 µg/well); use serial dilution to determine optimal load [40] |
| Antibody Concentration | Too much antibody increases background and causes signal saturation [40] | Titrate both primary and secondary antibodies to find optimal dilution [40] |
| Detection Method | Limited dynamic range compromises quantitative accuracy [42] | Use detection systems with wide linear dynamic range (e.g., 6 logs) [42] |
| Housekeeping Proteins (HKPs) | Common HKPs (β-actin, GAPDH) easily saturate, compromising normalization [40] | Validate HKP linearity; consider Total Protein Normalization (TPN) as alternative [40] |
| Signal Duration | Short signal half-life prevents reproducible quantification [40] | Use extended duration chemiluminescent substrates [40] |
Normalization Methods for Accurate Quantitation
Normalization is essential for accurate quantitative western blotting as it corrects for experimental variations in sample loading, electrophoresis, transfer efficiency, and protein concentration [40]. The most common normalization approach uses housekeeping proteins (HKPs)—constitutively expressed proteins presumed to maintain constant expression across experimental conditions, such as β-actin, GAPDH, and α-tubulin [40]. However, these traditional HKPs frequently show variable expression themselves and can easily become saturated at common loading amounts (30-50 μg/well), compromising their utility for normalization [40].
An increasingly popular alternative is Total Protein Normalization (TPN), which normalizes the target signal to the total amount of protein loaded in each lane [40]. This method utilizes fluorescent labels that covalently label all proteins in a sample, providing a linear response curve with a wide dynamic range [40]. Research demonstrates that TPN outperforms traditional HKP methods, with No-Stain Protein Labeling Reagent showing an R² value of 0.9990 compared to R² values of 0.8851, 0.9438, and 0.8332 for β-actin, GAPDH, and α-tubulin, respectively [40].
The following diagram illustrates the quantitative workflow with key control points:
Experimental Protocols and Best Practices
Detailed Methodology for Quantitative Western Blot
To achieve reliable quantitative results, researchers should follow this optimized protocol:
Sample Preparation:
- Extract proteins using appropriate lysis buffers aligned with the target protein's cellular localization (e.g., RIPA buffer for nuclear and mitochondrial proteins) [10].
- Include protease and phosphatase inhibitors to maintain protein structure and phosphorylation states [10].
- Determine protein concentration using a colorimetric assay such as the Bradford assay [10].
- Normalize samples to equal protein concentrations using cell lysis buffer.
- Add an equal volume of Laemmli sample buffer (containing SDS and beta-mercaptoethanol) to normalized protein extracts [10].
- Heat samples at 95°C for 5 minutes to fully denature proteins.
Gel Electrophoresis:
- Prepare or select appropriate polyacrylamide gels based on target protein size.
- Load samples alongside a molecular weight marker (protein ladder).
- Include appropriate controls (positive, negative, and loading controls).
- Electrophorese using a discontinuous buffer system (e.g., Tris-glycine-SDS) [10].
Transfer to Membrane:
- Transfer proteins electrophoretically to nitrocellulose or PVDF membrane using wet or semi-dry transfer systems [10].
- Use Towbin transfer buffer (25 mM Tris, 192 mM glycine, 20% methanol) [10].
- Confirm transfer efficiency by membrane staining with Ponceau S [39].
Immunodetection:
- Block membrane with 5% non-fat dry milk or BSA in TBST for 1 hour.
- Incubate with primary antibody diluted in blocking buffer at optimal concentration (determined by titration) [40].
- Wash membrane thoroughly with TBST.
- Incubate with species-specific secondary antibody conjugated to HRP or fluorescent tag at optimal dilution [40] [32].
- Wash membrane thoroughly to reduce background.
Detection and Quantification:
- Detect using chemiluminescent substrates or direct fluorescence imaging.
- Ensure signal capture occurs within the linear range of detection [42].
- Quantify band intensities using densitometry software.
- Normalize target protein signals to housekeeping proteins or total protein loading controls [40].
The Scientist's Toolkit: Essential Research Reagents
Table 3: Essential Research Reagents for Western Blotting
| Reagent/Category | Function/Purpose | Examples/Specific Notes |
|---|---|---|
| Lysis Buffers | Protein extraction from cells/tissues while maintaining solubility and preventing degradation [10] | RIPA buffer (nuclear/mitochondrial proteins); gentle detergents for native proteins [10] |
| Protease/Phosphatase Inhibitors | Preserve protein structure and post-translational modifications by inhibiting endogenous enzyme activity [10] | Added fresh to lysis buffers; essential for maintaining phosphorylation states [10] |
| SDS-PAGE Reagents | Create polyacrylamide gel matrix for protein separation by molecular weight [10] | Acrylamide, bis-acrylamide, SDS, Tris buffers; concentration determines resolution range [10] [39] |
| Transfer Membranes | Solid support for immobilized proteins after electrophoresis [10] [39] | Nitrocellulose (standard); PVDF (higher binding capacity, chemical resistance) [10] |
| Blocking Agents | Reduce non-specific antibody binding to minimize background signal [39] | Non-fat dry milk, BSA, or commercial blocking buffers; choice depends on application [39] |
| Primary Antibodies | Specifically bind to target protein of interest [32] | Monoclonal (specificity) or polyclonal (sensitivity); require validation for western blot [43] |
| Secondary Antibodies | Bind primary antibodies; conjugated to reporters for detection [32] | HRP (chemiluminescence) or fluorescent dyes; host species must match primary antibody [32] |
| Detection Substrates | Generate measurable signal for target protein visualization [40] | Chemiluminescent (HRP-based) or fluorescent; choice impacts sensitivity and dynamic range [42] [40] |
Western blot remains an indispensable technique in the protein detection arsenal, offering specific advantages for applications requiring protein sizing, identification, and quantification. Its ability to provide molecular weight verification through electrophoretic separation distinguishes it from IHC, while proper optimization enables reliable quantitative comparisons across experimental conditions. In HIV diagnostics and BSE surveillance, western blot has provided critical confirmatory testing capabilities based on its ability to resolve multiple antigen targets simultaneously [41] [39].
The strategic researcher selects between western blot and IHC based on the specific research question: when protein localization within tissue architecture is paramount, IHC is unquestionably superior [6]. However, when the research objective requires verification of protein identity through molecular weight determination, assessment of post-translational modifications, or quantitative comparison of expression levels, western blot provides essential capabilities unmatched by other techniques [6] [39]. As quantitative methodologies continue to advance with improved normalization strategies and detection systems with wider dynamic ranges, western blotting maintains its relevance as a cornerstone technique in biochemical, clinical, and molecular biological research [42] [40].
Optimizing Results: Troubleshooting Common Pitfalls in IHC and Western Blot
Immunohistochemistry (IHC) is a cornerstone technique in biomedical research and diagnostic pathology, enabling the visualization of protein localization within intact tissue architectures. When compared to Western blot, which separates proteins by molecular weight and provides quantitative data from homogenized samples, IHC offers the unparalleled advantage of spatial context, revealing the precise cellular and subcellular distribution of antigens. However, the complexity of tissue preservation and staining workflows introduces frequent technical challenges, including incomplete or absent staining, excessive background, and inefficient antigen retrieval. This guide systematically compares IHC with Western blot, provides targeted troubleshooting for common IHC issues, and presents supporting experimental data to empower researchers in making informed methodological choices.
IHC vs. Western Blot: A Technical Comparison for Protein Detection
The choice between IHC and Western blot hinges on the research question—whether the priority is to identify a protein's presence and approximate size or to map its exact location within a tissue. The following table summarizes the core distinctions between these two fundamental techniques.
Table 1: Core Differences Between IHC and Western Blot
| Parameter | Immunohistochemistry (IHC) | Western Blot |
|---|---|---|
| Primary Information | Protein localization and distribution within a tissue context [1] | Protein presence, relative molecular weight, and semi-quantification |
| Spatial Resolution | Cellular and subcellular level | None (sample is homogenized) |
| Tissue Processing | Fixed, paraffin-embedded or frozen sections; requires sectioning [44] [1] | Homogenized into a lysate |
| Key Technical Steps | Antigen retrieval, blocking endogenous enzymes, chromogenic/fluorescence detection [45] [46] | Gel electrophoresis, protein transfer to a membrane |
| Data Output | Image-based (microscopy) | Band-based (densitometry) |
| Quantification | Semi-quantitative (scoring intensity/percentage) or digital image analysis [1] | Semi-quantitative (comparison of band intensity) |
| Throughput | Lower (individual tissue sections) | Higher (multiple samples per gel) |
Troubleshooting Common IHC Issues: Causes and Solutions
Successful IHC requires optimizing a multi-step process. The table below outlines the most frequent problems, their root causes, and actionable solutions.
Table 2: Troubleshooting Guide for Common IHC Problems
| Problem | Potential Causes | Recommended Solutions |
|---|---|---|
| No or Weak Staining | Antibody Issues: Invalidated for IHC, incorrect dilution, or degradation [47] [48]. | Use IHC-validated antibodies; titrate for optimal concentration; avoid freeze-thaw cycles [47] [49]. |
| Ineffective Antigen Retrieval: Epitopes remain masked by formalin cross-links [45] [46]. | Optimize Heat-Induced Epitope Retrieval (HIER) method and buffer pH (e.g., citrate pH 6.0 vs. Tris-EDTA pH 9.0) [45] [46]. | |
| Detection System: Inactive secondary antibody or chromogen [47]. | Use fresh detection reagents and verify system activity with a positive control [45] [47]. | |
| High Background | High Antibody Concentration: Leads to non-specific binding [47] [50]. | Titrate primary and secondary antibodies to find the lowest concentration with clean, specific signal [49]. |
| Insufficient Blocking: Endogenous enzymes (peroxidases, phosphatases) or biotin cause false positives [45] [50]. | Block with 3% H2O2 (HRP) or levamisole (AP); use avidin/biotin block for relevant tissues [50] [49]. | |
| Tissue Drying: Causes irreversible, non-specific antibody binding, often at edges [47] [50]. | Perform all incubations in a humidified chamber [47]. | |
| Cross-reactive Secondary Antibody: Binds endogenous Ig in the tissue [45]. | Use species-adsorbed secondary antibodies and include a no-primary-antibody control [45] [48]. | |
| Uneven Staining | Inconsistent Reagent Coverage [47]. | Ensure liquid fully covers the tissue section; use a humidified chamber. |
| Tissue Folding or Poor Adhesion [47]. | Use charged or adhesive slides and carefully inspect sections before staining. |
The Critical Role of Antigen Retrieval
For formalin-fixed, paraffin-embedded (FFPE) tissues, antigen retrieval (AR) is arguably the most critical step. Formalin fixation creates methylene bridges between proteins, masking epitopes and preventing antibody binding [46]. AR reverses these cross-links. The two primary methods are:
- Heat-Induced Epitope Retrieval (HIER): The most common and effective method, using high temperature (95-120°C) in a specific buffer (e.g., citrate or Tris-EDTA) to break cross-links [45] [46]. Microwave ovens and pressure cookers are preferred over water baths for consistent results [45].
- Proteolytic-Induced Epitope Retrieval (PIER): Uses enzymes like proteinase K or trypsin to digest proteins and expose epitopes. This method is harsher and can damage tissue morphology if over-digested [46].
The workflow below outlines a systematic approach to diagnosing and resolving the most common IHC problems, with a particular emphasis on optimizing antigen retrieval.
IHC Troubleshooting Workflow
Supporting Experimental Data and Protocol Comparisons
Quantitative Antibody Performance Across Applications
Independent validation studies, such as those conducted by the open-science company YCharOS, provide crucial data on antibody reliability. An analysis of over 500 antibodies revealed significant performance variations across applications, highlighting the importance of using antibodies validated for your specific method [25].
Table 3: Antibody Success Rates by Application and Type (YCharOS Data Analysis)
| Application | Target Coverage | Overall Pass Rate | Recombinant Monoclonal Pass Rate | Polyclonal Pass Rate |
|---|---|---|---|---|
| Western Blot | 78% | 87% | 97% | Lower than recombinant (up to 30% difference) |
| Immunocytochemistry (ICC) | 68% | 66% | 83% | Lower than recombinant (up to 30% difference) |
| Immunoprecipitation (IP) | 65% | 51% | 55% | Lower than recombinant (up to 30% difference) |
This data underscores that recombinant monoclonal antibodies generally offer higher success rates and batch-to-batch consistency compared to polyclonals [25]. This is a critical consideration for ensuring reproducible IHC results.
Impact of Antigen Retrieval Methods and Detection Systems
Experimental comparisons demonstrate how key protocol choices directly affect staining quality.
- Antigen Retrieval Method: A study comparing retrieval methods for Phospho-Stat3 (Tyr705) staining in human lung carcinoma showed that a microwave oven provided clearly superior performance compared to a water bath, while a pressure cooker could sometimes enhance signals even further [45].
- Detection System: Polymer-based detection reagents (e.g., SignalStain Boost) offer enhanced sensitivity and result in more robust staining compared to traditional avidin-biotin-based systems [45].
- Antibody Diluent: The choice of diluent is antibody-specific. For instance, Phospho-Akt (Ser473) antibody delivered a superior signal when diluted in a specific commercial diluent versus a generic buffer, while another antibody (Phospho-EGF Receptor) performed better in the generic buffer [45]. This highlights the need to follow datasheet recommendations.
The Scientist's Toolkit: Essential Reagents for IHC
Table 4: Key Research Reagent Solutions for IHC
| Reagent / Material | Function | Example Use Case |
|---|---|---|
| IHC-Validated Primary Antibodies | Specifically binds the target protein antigen. | Recombinant monoclonal antibodies for high specificity and reproducibility [25]. |
| Polymer-Based Detection Kits | Amplifies the primary antibody signal for visualization. | SignalStain Boost IHC Detection Reagents for enhanced sensitivity over biotin-based systems [45]. |
| Antigen Retrieval Buffers | Unmasks hidden epitopes in FFPE tissues by breaking formalin cross-links. | Citrate Buffer (pH 6.0) or Tris-EDTA Buffer (pH 9.0) for Heat-Induced Epitope Retrieval (HIER) [45] [46]. |
| Endogenous Enzyme Blockers | Suppresses background from tissue-derived enzymes. | 3% H22O2 to block endogenous peroxidases; essential for HRP-based detection [45] [50]. |
| Specialized Antibody Diluents | Optimizes antibody stability and binding while reducing non-specific interactions. | Commercial diluents (e.g., SignalStain) formulated to prevent background and maintain antibody integrity [45]. |
IHC is an indispensable yet technically demanding method that provides spatial protein information complementary to Western blot data. Success hinges on a systematic approach to troubleshooting, with a particular focus on validating antibodies, optimizing antigen retrieval, and controlling background. The experimental data presented confirms that rigorous reagent validation and protocol optimization are non-negotiable for generating reliable, reproducible results. By applying this comparative and data-driven troubleshooting framework, researchers and drug developers can confidently leverage IHC to uncover meaningful biological insights within the native tissue context.
In the landscape of protein detection research, Western blotting and immunohistochemistry (IHC) represent two complementary pillars, each with distinct advantages and applications. While IHC provides crucial spatial context within tissue architecture, allowing researchers to localize proteins to specific cells or subcellular compartments, Western blotting offers superior specificity for characterizing protein identity, modifications, and relative abundance [51]. This technical comparison guide focuses on optimizing Western blot methodology to ensure researchers can generate reproducible, high-quality data that complements findings from IHC studies.
A significant challenge in both techniques concerns antibody validation. The scientific community faces a reproducibility crisis, partly driven by inadequate antibody characterization [51] [36]. With over 2 million antibodies available from more than 300 companies—many representing the same "core" antibodies relabeled by different suppliers—researchers cannot assume commercial antibodies are fit for purpose without rigorous validation [51]. Furthermore, antibody performance is highly application-specific; an antibody that works superbly in IHC may fail in Western blotting due to differences in protein conformation, accessibility, and the detection environment [29] [36]. Therefore, the optimization strategies presented here emphasize systematic validation and controlled experimental design to ensure reliable protein detection.
Foundational Principles and Comparative Analysis
Core Principle of Western Blotting
Western blotting is a cornerstone technique that combines gel electrophoresis with immunodetection to identify specific proteins within complex mixtures [31] [3]. The method relies on separating proteins by molecular weight via sodium dodecyl sulfate-polyacrylamide gel electrophoresis (SDS-PAGE), transferring them to a solid membrane, and detecting target proteins using specific antibodies [31]. The power of Western blotting lies in its ability to provide information about protein size, relative abundance, post-translational modifications, and presence of protein isoforms [3]. When optimized, it serves as a highly specific and quantitative complement to IHC's morphological strengths.
Comparative Technique Analysis: Western Blot vs. IHC
The table below summarizes the key distinctions between these two fundamental protein detection methods:
Table 1: Comparative analysis of Western blot and IHC for protein detection
| Parameter | Western Blot | Immunohistochemistry (IHC) |
|---|---|---|
| Primary Output | Protein size, relative quantity, modification status | Cellular and subcellular protein localization |
| Spatial Context | Lost during tissue homogenization | Preserved within tissue architecture |
| Specificity Control | Molecular weight confirmation, knockout validation | Staining pattern, tissue-specific controls |
| Throughput | Medium to high | Lower |
| Quantification | Relative band density | Semi-quantitative based on staining intensity |
| Key Challenge | Transfer efficiency, antibody specificity | Antigen accessibility, antibody specificity |
Optimizing Sample Preparation for Reproducibility
Lysis Buffer Selection Based on Protein Localization
The foundation of successful Western blotting begins with appropriate sample preparation that preserves protein integrity and accessibility. Lysis buffer composition must be tailored to the subcellular location of the target protein and the nature of its epitope.
Table 2: Lysis buffer recommendations for different protein localizations
| Target Protein Location | Recommended Buffer | Key Components | Considerations |
|---|---|---|---|
| Cytoplasmic | NP-40 Cell Lysis Buffer | 50 mM Tris, 250 mM NaCl, 1% NP-40 [52] | Mild, non-denaturing conditions preserve protein interactions |
| Whole Cell (general) | M-PER Mammalian Protein Extraction Reagent | Non-denaturing detergent in 25mM bicine buffer [52] | Suitable for soluble proteins; maintains native structure |
| Membrane-bound, Nuclear | RIPA Lysis Buffer | 25 mM Tris-HCl, 150 mM NaCl, 1% NP-40, 1% sodium deoxycholate, 0.1% SDS [52] [31] | Stronger denaturing conditions solubilize difficult proteins |
| Native Conditions | Tris-Based Buffers with varying pH/salt | Tris-HCl, high salt concentrations [3] | Requires mechanical homogenization; preserves conformational epitopes |
Critical Preservation Steps
Cellular lysis releases proteases and phosphatases that rapidly degrade proteins and remove post-translational modifications. To prevent these artifacts:
- Perform all procedures on ice with pre-chilled buffers [52] [31].
- Add protease and phosphatase inhibitors to lysis buffers immediately before use [52] [31] [3].
- Process tissues rapidly after dissection, with snap-freezing in liquid nitrogen for storage at -80°C if immediate processing isn't possible [31].
Protein Quantification and Sample Preparation
Accurate protein quantification ensures equal loading across gel wells, a prerequisite for meaningful comparisons:
- BCA Assay is preferred over Bradford assays for its compatibility with samples containing up to 5% detergents and greater protein-to-protein uniformity [52].
- Sample Denaturation: Boil samples in SDS-containing loading buffer with reducing agents (DTT or β-mercaptoethanol) to disrupt secondary structure and ensure uniform charge [31]. Heating at 70°C for 2-10 minutes is recommended over 100°C to minimize proteolysis [52].
- Loading Concentration: Dilute lysates to a final concentration of 1-2 mg/mL in loading buffer, with 10-40 μg of total protein typically loaded per lane for cell lysates [31].
Advanced Transfer Optimization Strategies
Membrane Selection Based on Protein Characteristics
The transfer step moves proteins from gels to membranes where antibody detection occurs. Membrane choice significantly impacts detection sensitivity:
Table 3: Membrane performance comparison for protein transfer
| Membrane Type | Pore Size | Optimal Protein Size Range | Signal Retention | Background Characteristics |
|---|---|---|---|---|
| PVDF | 0.22 μm | <55 kDa [53] | Excellent for small proteins [53] | Low background with proper blocking |
| PVDF | 0.45 μm | 40-100 kDa [53] | Good for medium proteins [53] | Low background |
| Nitrocellulose | 0.45 μm | 30-100 kDa [53] | Moderate for small proteins [53] | Higher binding capacity |
Transfer Efficiency Controls and Optimization
Incomplete or over-transferring proteins represents a major failure point. These strategies ensure optimal transfer:
- Pre-stained Ladders: Monitor transfer progress using colored molecular weight markers that visualize protein movement from gel to membrane [54].
- Post-Transfer Gel Staining: After transfer, stain the SDS-PAGE gel with Coomassie blue; a mostly clear gel indicates successful protein transfer [54].
- Dual Membrane Technique: Place two membranes in the transfer stack to detect over-transfer, where protein presence on the second membrane indicates excessive transfer duration, particularly problematic for low molecular weight proteins [54].
Molecular Weight-Specific Transfer Parameters
Proteins of different sizes require optimized transfer conditions:
- 10-25 kDa: 25V for 15 minutes [53]
- 25-55 kDa: 25V for 20 minutes [53]
- 55-70 kDa: 25V for 25 minutes [53]
- 70-130 kDa: 25V for 30-35 minutes [53]
Buffer Modifications for Enhanced Efficiency
- Methanol Replacement: Substitute methanol with ethanol in transfer buffers to reduce toxicity without compromising efficiency [53].
- SDS Addition: Including SDS (1.3 mM) in the electrotransfer buffer enhances signal intensities for certain proteins like GAPDH and CD81 [53].
Antibody Validation: The Cornerstone of Reproducibility
Specificity Validation Strategies
Antibody validation remains arguably the most critical component for reproducible Western blotting, especially when correlating with IHC findings where staining patterns may differ significantly from blotting results [51] [29].
- Genetic Controls: Knockout (KO) cell lines or tissues represent the "gold standard" for validation, providing definitive evidence of specificity through absence of signal in KO samples [36].
- Orthogonal Validation: Use two independent antibodies recognizing different epitopes on the same target protein; concordant results strongly support specificity [51] [36].
- Multiple Cell Line Testing: Evaluate antibody performance across various cell lines with known expression profiles to build a comprehensive specificity profile [36].
- Molecular Weight Verification: Confirm that detected bands align with the predicted molecular weight of the target protein, though post-translational modifications and splice variants can cause legitimate shifts [36].
Control Requirements for Rigorous Experimental Design
- Positive Controls: Lysates from cell lines known to express the target protein confirm protocol functionality [36].
- Negative Controls: Tissues or cell lines lacking the target protein (genetically modified or naturally deficient) establish staining specificity [51].
- No Primary Antibody Controls: Identify background from secondary antibodies or detection systems [51].
- Loading Controls: Housekeeping proteins (GAPDH, actin, tubulin) verify equal loading and transfer efficiency [36].
The Scientist's Toolkit: Essential Research Reagents
Table 4: Key research reagent solutions for Western blot optimization
| Reagent Category | Specific Examples | Function | Optimization Tips |
|---|---|---|---|
| Protease Inhibitors | PMSF, Aprotinin, Leupeptin [3] | Prevent protein degradation during lysis | Use cocktails for broad-spectrum protection; add fresh before use |
| Phosphatase Inhibitors | β-glycerophosphate, Sodium orthovanadate [3] | Preserve phosphorylation states | Essential for phospho-specific antibodies |
| Detergents | NP-40, Triton X-100, SDS [3] | Solubilize proteins from membranes/organelles | Match detergent strength to protein localization |
| Reducing Agents | DTT, β-mercaptoethanol [31] | Break disulfide bonds for linearization | Add fresh to loading buffer; prevents reformation of bonds |
| Blocking Agents | BSA, non-fat milk, PVP-40 [53] | Reduce nonspecific antibody binding | PVP-40 enables rapid blocking (10 min); milk may contain phosphatases |
Workflow Integration and Visualization
The following diagram summarizes the optimized Western blot workflow with key decision points and quality control checks:
Western blotting remains an indispensable tool in the protein researcher's arsenal, particularly when paired with complementary spatial techniques like IHC. Through systematic optimization of sample preparation, protein transfer, and rigorous antibody validation, researchers can significantly enhance the reproducibility and reliability of their Western blot data. The protocols and comparative data presented here provide a roadmap for implementing these optimized methods, emphasizing the critical importance of application-specific antibody validation and appropriate controls. By adopting these standardized approaches, the scientific community can strengthen experimental rigor while building a more reproducible foundation for protein research across techniques and laboratories.
In protein detection research, the accuracy of techniques like Immunohistochemistry (IHC) and Western blot (WB) is paramount. These methods are foundational to advancing our understanding of disease mechanisms and drug development. However, their reliability is not inherent; it is critically dependent on the rigorous implementation of positive and negative controls. These controls are not mere procedural formalities but are essential for verifying antibody specificity, assessing assay functionality, and ultimately, for distinguishing valid biological signals from experimental artefacts. Within the context of comparing IHC and Western blot, understanding the application of controls is key to interpreting data correctly and ensuring that conclusions about protein localization and expression are valid. This guide will objectively compare the performance of these two techniques, with a focused examination of the control strategies that underpin reliable data interpretation.
Fundamental Techniques at a Glance: IHC vs. Western Blot
IHC and Western blot, while both relying on antibody-antigen interactions, provide fundamentally different types of information. IHC is used to detect and analyze protein expression while maintaining the composition, cellular characteristics, and structure of native tissues, providing contextual data crucial for diagnosing abnormalities like cancer [55]. Western blot, or immunoblotting, measures protein levels in a cell or tissue extract, is highly sensitive for quantifying protein expression, and is often used as a complementary assay to confirm antibody specificity [55].
The core difference lies in their output: IHC provides spatial localization within an intact tissue architecture, while Western blot provides quantitative data on protein molecular weight and relative abundance [6]. This fundamental distinction dictates their respective applications and, as will be explored, the specific control strategies required for each.
The Control Toolkit: Essential Strategies for Validation
The validity of any IHC or Western blot experiment hinges on a suite of controls designed to test for specificity and sensitivity. The following sections detail the essential controls for each technique, with their purposes and ideal compositions summarized in the table below.
Table 1: Essential Positive and Negative Controls for IHC and Western Blot
| Control Type | Purpose | IHC Implementation | Western Blot Implementation |
|---|---|---|---|
| Positive Control | Verifies assay functionality and reagent performance | Tissue known to express the target antigen [56] | Cell line or tissue lysate known to express the target protein [57] [58] |
| Negative Control | Assesses non-specific binding and false positives | Tissue known to lack the target antigen [59] [56] | Knockout (KO) cell line lysate [57] or empty vector transfectant [59] |
| Loading Control | Ensures equal protein loading and transfer | N/A | Antibody against constitutively expressed housekeeping protein (e.g., Actin, GAPDH) [57] |
| No Primary Control | Checks for secondary antibody non-specificity | Omit primary antibody; incubate with antibody diluent only [56] | Omit primary antibody [58] |
| Isotype Control | Confirms specificity of primary antibody binding | Use an antibody of the same isotype but irrelevant specificity [56] | Use an antibody of the same isotype but irrelevant specificity [58] |
| Endogenous Background Control | Identifies tissue autofluorescence | Examine tissue section without any antibodies [56] | N/A |
| Orthogonal Control | Corroborates data using a non-antibody method | Compare with RNA-seq, ISH, or mass spectrometry data [60] | Compare with qPCR, RNA-seq, or mass spectrometry data [60] |
Detailed Control Methodologies for Western Blot
For Western blot, the process of validation begins even before antibody probing.
- Positive and Negative Control Lysates: A positive control lysate is typically derived from a cell line or tissue sample known to express the protein of interest. Its success confirms that the procedure and reagents are working, thereby validating any negative results in test samples [57]. Conversely, a negative control lysate, ideally from a validated knockout (KO) cell line, allows you to check for non-specific antibody binding and false-positive results [57]. The power of these controls is demonstrated when they are used in tandem, as shown in the workflow below.
Loading Controls: To ensure that observed changes in protein expression are real and not due to uneven sample loading or transfer, loading controls are essential. These are antibodies against ubiquitously and constitutively expressed housekeeping proteins like beta-actin, GAPDH, or tubulin [57]. The expression of the loading control should remain consistent across all samples, and it must have a different molecular weight than the target protein to allow for distinction [57].
Secondary-Only and Isotype Controls: The secondary-only control (omitting the primary antibody) identifies non-specific binding of the secondary antibody itself [58]. For the primary antibody, an isotype control (an antibody of the same species and isotype but with irrelevant specificity) is used, particularly for lysates rich in immune cells, to ensure the constant region (Fc) of the primary antibody is not binding non-specifically [58].
Detailed Control Methodologies for Immunohistochemistry (IHC)
IHC, with its reliance on complex tissue architecture, requires a distinct set of control strategies.
Positive and Negative Tissue Controls: A positive tissue control is a tissue section known to express the target protein, processed simultaneously with the test sample. A lack of staining here indicates a problem with the protocol or reagents [56]. A negative tissue control, from a tissue known not to express the target, reveals non-specific binding and false positives. Knockdown (KD) or knockout (KO) tissues serve as excellent negative controls [56].
No Primary Antibody and Isotype Controls: The no primary antibody control is critical in IHC. The primary antibody is omitted and replaced with antibody diluent, and the rest of the protocol remains the same. Any resulting signal indicates non-specific binding of the secondary antibody [56]. Similarly, an isotype control helps confirm that the staining observed is due to the specific antigen-binding site of the primary antibody and not its Fc region [56].
Endogenous Background Control: Tissues rich in collagen, elastin, or lipofuscin can exhibit autofluorescence, which can be mistaken for a specific signal [56]. To prevent this, a section of the test tissue should be examined with a microscope prior to any antibody staining to assess the level of inherent background signal.
Orthogonal Validation: A Higher Standard of Confidence
Beyond the standard controls, orthogonal validation represents a gold standard. This strategy involves cross-referencing antibody-based results with data obtained using non-antibody-based methods [60]. This approach controls for bias and provides more conclusive evidence of target specificity.
For example, protein expression measured by Western blot (antibody-dependent) can be corroborated with RNA expression data from transcriptomics databases like the Human Protein Atlas (antibody-independent) [60]. Similarly, IHC results can be validated against peptide counts obtained through mass spectrometry [60]. The International Working Group on Antibody Validation recognizes orthogonal approaches as one of the five conceptual pillars for antibody validation [60].
Table 2: Public Data Sources and Experimental Methods for Orthogonal Validation
| Resource/Method | Type of Data | Utility for Orthogonal Validation |
|---|---|---|
| Human Protein Atlas [60] | Transcriptomics (RNA-seq) and Proteomics | Compare RNA expression levels with protein detection in WB or IHC. |
| Cancer Cell Line Encyclopedia (CCLE) [60] | Genomic Data | Inform selection of positive/negative control cell lines based on genomic features. |
| Mass Spectrometry [60] | Proteomics (Peptide Counts) | Quantitatively correlate protein abundance with IHC staining intensity. |
| In Situ Hybridization [60] | RNA Localization | Compare mRNA and protein localization patterns within tissues for IHC. |
| Quantitative PCR (qPCR) [60] | RNA Expression | Measure RNA levels in samples used for Western blot analysis. |
A Side-by-Side Comparison: IHC vs. Western Blot Data
The following case study illustrates how controls enable a direct and meaningful comparison between IHC and Western blot data. The validation of an antibody against Nectin-2/CD112 provides a clear example.
Table 3: Comparative Experimental Data for Antibody Validation (Nectin-2/CD112)
| Experimental Component | Western Blot Validation | IHC Validation (Example: DLL3) |
|---|---|---|
| Target Protein | Nectin-2/CD112 | DLL3 |
| Antibody Clone | (D8D3F) #95333 [60] | (E3J5R) #71804 [60] |
| Orthogonal Data Source | Human Protein Atlas (RNA expression) [60] | Mass Spectrometry (Peptide counts) [60] |
| Positive Control(s) | RT4 & MCF7 cell lines (high RNA expression) [60] | Tissue with high peptide count (blue) [60] |
| Negative Control(s) | HDLM-2 & MOLT-4 cell lines (low/no RNA expression) [60] | Tissue with low peptide count (green) [60] |
| Experimental Readout | Strong band in RT4/MCF7; weak/no band in HDLM-2/MOLT-4 [60] | High staining in blue tissue; low staining in green tissue [60] |
| Validation Outcome | Specific for WB [60] | Specific for IHC [60] |
This comparative data highlights a critical point: application-specific validation is essential. An antibody validated for one application (e.g., Western blot) is not automatically validated for another (e.g., IHC) due to differences in sample processing and epitope accessibility [60]. The data for Nectin-2 shows it is validated for WB and IHC, but not for other applications, while the DLL3 example demonstrates a similar rigorous, application-specific validation for IHC.
The Scientist's Toolkit: Essential Research Reagent Solutions
Selecting the right reagents is as crucial as the experimental design. The following table details key materials required for implementing the controls discussed in this guide.
Table 4: Essential Research Reagents for Protein Detection Controls
| Reagent / Resource | Function & Importance | Key Considerations for Selection |
|---|---|---|
| Validated Primary Antibodies | Binds specifically to the target protein of interest. | Check datasheet for application-specific validation (e.g., WB, IHC) and recommended controls [60] [25]. |
| KO/Knockdown Cell Lines | Provides a definitive negative control lysate. | Ensures no target protein is present, confirming antibody specificity [57] [59]. |
| Housekeeping Protein Antibodies | Serves as a loading control for Western blot. | Choose a protein with consistent expression in your sample type and with a molecular weight different from your target [57]. |
| Isotype Control Antibodies | Matches the primary antibody's isotype to control for non-specific Fc binding. | Must be the same host species, clonality, and conjugate as the primary antibody [58] [56]. |
| Public Data Repositories (e.g., Human Protein Atlas) | Provides orthogonal data (e.g., RNA expression) for control selection and validation. | Be aware that mRNA levels may not always correlate perfectly with detectable protein levels [60] [57]. |
| Tagged Expression Vectors | For transfection to create overexpressing positive controls. | Useful when endogenous positive controls are not available [59]. |
In the direct comparison between IHC and Western blot, it is evident that while their outputs differ, their reliance on rigorous controls is a shared and non-negotiable principle. IHC excels in revealing the spatial context of protein expression but requires careful attention to tissue-specific controls to avoid misinterpretation. Western blot provides robust quantification and molecular weight confirmation, dependent on lysate-based and loading controls for accurate normalization. For researchers and drug development professionals, the path to reliable data interpretation is clear: a comprehensive, controlled, and application-specific validation strategy is the critical factor that transforms a simple protein detection assay into a trustworthy result, thereby strengthening the very foundation of biomedical research.
The reproducibility of research findings in protein detection is a growing concern within the scientific community, with inconsistent antibody performance being a significant contributor to this challenge [36]. The performance of primary antibodies, including their specificity and selectivity, is intensely influenced by the assay context; an antibody that performs optimally in a Western blot (WB) might be entirely unsuitable for immunohistochemistry (IHC) and vice versa [36] [61]. Therefore, antibody optimization is not a one-time, generic procedure but a mandatory, assay-specific practice. Within the broader thesis of comparing IHC and Western blotting, this guide focuses on three pillars of antibody optimization: titration, diluent composition, and blocking buffer selection. Proper execution of these steps is fundamental to achieving high specificity, strong signal-to-noise ratios, and reliable, reproducible data, whether the goal is to localize a target within its tissue architecture (IHC) or to separate and quantify it by molecular weight (WB) [6] [1] [61].
Core Principles of IHC and Western Blot
A foundational understanding of IHC and Western blot is necessary to appreciate why optimization parameters differ. While both techniques rely on the specific binding of an antibody to its target antigen, their workflows, sample processing, and final readouts are distinct, directly influencing optimization strategies.
Immunohistochemistry (IHC) is used to detect and analyze protein expression while maintaining the composition, cellular characteristics, and structure of native tissues [61]. Its key advantage is providing contextual data, showing the precise cellular and subcellular localization of a protein within a tissue section [6] [1]. This makes it indispensable for diagnosing abnormalities in diseases like cancer and for understanding protein distribution in complex tissues.
Western Blot (WB), or immunoblotting, is used to detect levels of protein expression in a cell or tissue extract [61]. Proteins are separated by molecular weight using gel electrophoresis before being transferred to a membrane for antibody probing [10]. Its key advantages are its ability to provide quantitative or semi-quantitative data on protein size and expression levels and to detect multiple targets simultaneously [6] [10].
The following workflow diagrams encapsulate the key steps and critical optimization points for each technique.
Figure 1: IHC Experimental Workflow. Key optimization points for Titration & Diluent and Buffer Selection are highlighted in red and green, respectively.
Figure 2: Western Blot Experimental Workflow. Key optimization points for Titration & Diluent and Buffer Selection are highlighted in red and green, respectively.
Antibody Titration: Finding the Optimal Dilution
Antibody titration is the process of determining the concentration at which an antibody provides a strong specific signal with minimal background. Using an antibody at too high a concentration is a common source of non-specific bands in WB and high background staining in IHC [62]. Conversely, an antibody that is too dilute will yield a weak or absent signal [62]. A landmark study demonstrated that antibodies for IHC could often be used at dilutions two to three orders of magnitude higher than those commonly published, achieving superior specificity and significant cost savings [63].
Experimental Protocol for Antibody Titration
1. Sample Preparation:
- IHC: Use a tissue microarray (TMA) containing both known positive and negative control tissues. Ensure consistent fixation and processing across all samples [1].
- WB: Prepare a homogenate or lysate from a cell line or tissue known to express the target protein at moderate levels. Include a knockout cell line or a negative control lysate if available [36] [64].
2. Serial Dilution Preparation:
- Prepare a series of doubling dilutions of the primary antibody (e.g., 1:100, 1:200, 1:500, 1:1000, 1:2000, 1:5000, 1:10000) in the appropriate antibody diluent [63].
- The starting point can be based on the manufacturer's datasheet or published literature, but a broad range must be tested empirically.
3. Assay Execution:
- For both IHC and WB, run the entire series of dilutions on identical sample sets in the same experiment to ensure consistent conditions.
- Include controls: a no-primary-antibody control (for background assessment) and a known positive control [36] [1].
4. Analysis and Optimal Dilution Selection:
- IHC: The optimal dilution is the highest dilution (lowest concentration) that produces intense, specific staining of the expected cellular compartment with a clean, low background in negative tissue regions [63].
- WB: The optimal dilution is the highest dilution that produces a single, sharp band at the expected molecular weight with minimal or no background or non-specific bands [36] [62].
Table 1: Troubleshooting Antibody Titration in IHC and WB
| Observation | Potential Cause | Recommended Action |
|---|---|---|
| High background in both IHC and WB | Primary antibody concentration too high [62]. | Further increase the antibody dilution. |
| Weak or no specific signal | Primary antibody concentration too low or inactive [62]. | Decrease the dilution; check antibody viability. |
| Non-specific bands in WB | Off-target binding due to over-concentration [62]. | Increase dilution; use a knockout control to confirm specificity [36]. |
| Inconsistent staining in IHC | Inadequate antigen retrieval or tissue processing [1]. | Re-optimize antigen retrieval method before re-titrating. |
Antibody Diluents and Blocking Buffers: Composition and Selection
The composition of the antibody diluent and blocking buffer is critical for stabilizing the antibody-antigen interaction and preventing non-specific binding, which manifests as high background noise.
Antibody Diluents
An antibody diluent is a buffer used to dilute the primary and secondary antibodies to their working concentration. A standard diluent often consists of a buffered salt solution (PBS or TBS) with added protein (e.g., BSA) and a detergent (e.g., Tween 20) to reduce non-specific hydrophobic interactions.
Blocking Buffers
Blocking buffers are solutions of inert proteins, sera, or other compounds that are applied to the sample (tissue section or membrane) to "block" unsaturated binding sites on the surface, preventing antibodies from binding to these sites non-specifically [65] [66]. The choice of blocking agent is highly dependent on the application and the specific antibodies used.
Table 2: Comparison of Common Blocking Buffers and Their Applications
| Blocking Agent | Mechanism | Best For | Avoid or Use With Caution |
|---|---|---|---|
| Non-Fat Dry Milk | Proteins in milk occupy non-specific sites [66]. | General, cost-effective WB; not typically used in IHC. | Biotin-avidin systems (contains biotin); phospho-specific antibodies (may contain phosphatases) [65] [66]. |
| Bovine Serum Albumin (BSA) | Purified protein blocks non-specific sites without cross-reactivity [66]. | Phospho-specific protein detection; general use in IHC and WB [66]. | When the primary antibody is raised against BSA. |
| Normal Serum | Serum from the host of the secondary antibody blocks Fc receptors and other sites [66]. | IHC to reduce non-specific background from secondary antibodies [1]. | Can be more expensive; requires matching to the secondary antibody host. |
| Casein | Protein derived from milk; provides a very "clean" block with low background [65]. | High-sensitivity applications; compatible with biotin-avidin systems [65]. | Less common; may require specific buffer conditions. |
| Fish Skin Gelatin | Less likely to cross-react with antibodies of mammalian origin [65]. | When using mammalian primary antibodies to minimize cross-reactivity. | May not be as effective for all targets. |
Buffer Selection Guide and Experimental Protocol
Choosing Between PBS and TBS:
- TBS (Tris-Buffered Saline) is generally recommended for detecting phosphorylated proteins and when using alkaline phosphatase (AP)-conjugated antibodies, as phosphate in PBS can interfere [66].
- PBS (Phosphate-Buffered Saline) is suitable for most other applications. For fluorescent WB, TBS is preferred to minimize autofluorescence [66].
- A detergent like Tween 20 (at 0.05-0.1%) is typically added to create PBST or TBST, which helps wash away unbound antibodies and reduces background [62] [66].
Experimental Protocol for Optimizing Blocking:
- Prepare Blocking Buffers: Prepare 3-5% solutions of your top candidate blockers (e.g., BSA in TBST, non-fat milk in TBST, and a commercial blocking buffer) [66].
- Block and Probe: Divide your membrane or tissue sections into groups. Block each group with a different blocking buffer for 1 hour at room temperature (or overnight at 4°C for difficult targets) [66].
- Consistent Probing: Probe all sections with the same, pre-optimized dilution of primary and secondary antibodies.
- Analyze Results: Select the blocking buffer that yields the strongest specific signal with the lowest background. High background indicates insufficient blocking, while a weak signal can mean the blocking buffer is interfering with the antibody-antigen interaction [62] [66].
Integrated Optimization: A Side-by-Side Comparison for IHC and WB
To translate the principles above into a direct, actionable comparison, the following table synthesizes the optimal conditions and key considerations for IHC and WB.
Table 3: Direct Comparison of Optimization Parameters for IHC and Western Blot
| Parameter | Immunohistochemistry (IHC) | Western Blot (WB) |
|---|---|---|
| Primary Goal of Optimization | Maximize specific staining at the correct subcellular location; minimize background in tissue matrix. | Maximize a single band at the expected molecular weight; eliminate non-specific bands and background. |
| Key Sample Preparation Considerations | Fixation type/duration, antigen retrieval method is critical [1]. | Lysis buffer composition, protein quantification, and complete denaturation are critical [10]. |
| Typical Antibody Diluent | PBS or TBS with 1-5% BSA or normal serum from the secondary antibody host. | PBS or TBS (TBST) with 1-5% BSA or non-fat dry milk. |
| Recommended Blocking Buffers | Protein-free commercial blockers, normal serum, or BSA to avoid cross-reactivity [66] [1]. | BSA (for phospho-proteins), non-fat milk (general use), or casein (low background) [65] [66]. |
| Critical Controls | Isotype control, no-primary-antibody control, tissue with known expression as a positive control [1]. | Knockout (KO) cell lysate is the gold standard [36] [64]; no-primary-antibody control; loading control. |
| Common Pitfalls | Over-fixation, inadequate antigen retrieval, endogenous enzyme activity not blocked [1]. | Unequal protein loading, incomplete transfer (especially high MW proteins), over-blocking [62] [10]. |
The Scientist's Toolkit: Essential Research Reagent Solutions
A well-equipped lab has a suite of standard reagents and specialized tools for antibody optimization. The following table details key materials essential for this process.
Table 4: Essential Research Reagents for Antibody Optimization
| Reagent / Material | Function and Importance in Optimization |
|---|---|
| Bovine Serum Albumin (BSA) | A highly pure, versatile blocking agent and diluent component, especially critical for phospho-specific antibodies and minimizing background [66]. |
| Normal Sera (e.g., Goat, Donkey) | Used for blocking in IHC to prevent non-specific binding of secondary antibodies to Fc receptors and other sites in tissues [65] [1]. |
| Tween 20 Detergent | A mild non-ionic detergent added to wash buffers (PBST/TBST) to reduce hydrophobic interactions and lower background noise in both IHC and WB [62] [66]. |
| Knockout (KO) Cell Lines | The gold-standard negative control for WB validation, confirming that the detected band is specific to the target protein [36] [64]. |
| Protein Ladder (Molecular Weight Marker) | Essential for WB to estimate the molecular weight of the detected protein and verify the target's identity [10]. |
| Antigen Retrieval Buffers (IHC) | Solutions (e.g., citrate-based) used to reverse the cross-links formed by formalin fixation, which is often essential for antibody binding in IHC [1]. |
| Phosphatase & Protease Inhibitors | Added to lysis buffers during WB sample preparation to preserve the native state and post-translational modifications (e.g., phosphorylation) of proteins [10]. |
Antibody optimization is a non-negotiable investment of time and resources that pays dividends in the form of reliable, publication-quality data. As detailed in this guide, the path to optimization—through meticulous titration, careful selection of diluents, and strategic use of blocking buffers—is distinctly different for IHC and Western blot. These differences stem from the fundamental nature of each technique: IHC seeks to preserve and visualize protein context, while WB aims to separate and quantify. By adopting the systematic, evidence-based approaches outlined here, researchers and drug development professionals can directly address the reproducibility crisis, validate their critical antibody reagents, and ensure their findings reflect biological truth rather than experimental artifact.
Validation and Choice: Ensuring Specificity and Selecting Your Method
Antibody-based assays like Western blot (WB) and immunohistochemistry (IHC) are foundational techniques for protein detection in research and drug development. However, their reliability is fundamentally dependent on the specificity of the primary antibody used. A significant contributor to the widely acknowledged reproducibility crisis in life sciences is the use of poorly validated antibodies that demonstrate cross-reactivity with off-target proteins [67] [36]. To address this, the international scientific community has established genetic controls, particularly knockout (KO) validation, as the gold standard for confirming antibody specificity [68] [67] [36]. This guide objectively compares the application and performance of this gold standard method across Western blot and IHC, providing the experimental data and protocols necessary for its rigorous implementation.
The Theoretical Basis for KO Validation
Knockout validation provides the most direct link between gene, protein, and antibody by genetically inactivating the gene encoding the target protein [67]. The core principle is straightforward: an antibody specific to its target should produce a signal in a wild-type (WT) sample and no signal in a genetically engineered sample lacking that target (the KO) [67]. This clear, binary readout (signal vs. no signal) offers an unambiguous assessment of specificity.
The International Working Group for Antibody Validation (IWGAV) has formally recognized genetic strategies as the first of its "Five Pillars of Antibody Validation" [68] [67]. While several gene-editing methods exist, CRISPR-Cas9 has become the preferred technique due to its flexibility, efficiency, and specificity [67]. It utilizes a guide RNA (gRNA) to direct the Cas9 endonuclease to a specific genomic locus, creating a double-strand break. The cell's repair mechanisms then introduce insertions or deletions (indels), often resulting in a frameshift mutation and a complete genetic knockout [67].
The following diagram illustrates the conceptual logic and workflow underpinning the KO validation process.
Comparative Application in WB vs. IHC
While the core principle of KO validation is consistent, its application and interpretation differ significantly between Western blot and immunohistochemistry due to the inherent nature of these assays. The table below summarizes the key performance indicators for KO validation in each application.
Table 1: Performance Comparison of KO Validation in Western Blot vs. Immunohistochemistry
| Feature | Western Blot (WB) | Immunohistochemistry (IHC) |
|---|---|---|
| Primary Readout | Presence/absence of a band at the expected molecular weight [67]. | Presence/absence of staining in the expected cellular or subcellular compartments [69]. |
| Data Complexity | Relatively simple; a single band is the ideal result [67]. | High; must interpret staining patterns within complex tissue morphology [69]. |
| Ability to Detect Off-Target Bands | Excellent; non-specific binding appears as additional bands at incorrect molecular weights, which are easily visualized [67]. | Poor; non-specific or cross-reactive binding is difficult to distinguish from specific staining without other controls [19] [6]. |
| Quantitative Potential | High; band intensity can be quantified via densitometry and normalized to loading controls [57] [10]. | Semi-quantitative at best; staining intensity is scored subjectively (e.g., 0, 1+, 2+, 3+) [6]. |
| Ease of Interpretation | Generally straightforward, especially with a protein ladder for molecular weight reference [10] [67]. | Can be challenging; requires expertise in histology to distinguish specific staining from artifacts [69]. |
KO Validation in Western Blot
In Western blotting, KO validation provides a clear visual assessment of antibody performance. The ideal outcome is a single band at the known molecular weight of the target protein in the WT lane and the complete absence of that band in the KO lane [67]. This not only confirms specificity for the target but also reveals if an antibody binds to unrelated proteins (visible as extra bands), which may still be present in the KO lane [67] [36].
Table 2: Interpreting Western Blot KO Validation Results
| Scenario | WT Lane | KO Lane | Interpretation |
|---|---|---|---|
| Ideal Specificity | Single band at expected size. | Target band absent. | Antibody is highly specific for the target [67]. |
| Non-Specific Binding | Multiple bands. | Target band absent; other bands remain. | Antibody is specific for the target but also cross-reacts with other proteins. May be usable with caution [67]. |
| Poor Specificity | Band at expected size. | Target band still present (possibly dimmer). | Antibody is not specific; it may be binding to a protein homologue of similar size [67]. |
The following workflow diagram outlines the key experimental steps for performing KO validation in a Western blot context.
KO Validation in Immunohistochemistry
In IHC, KO validation confirms whether the observed staining pattern is dependent on the presence of the target protein. The expected result is a clear staining pattern in the WT tissue (e.g., nuclear, cytoplasmic, or membrane-specific) and the loss of that specific staining in the KO tissue section [69]. However, IHC poses unique challenges. Non-specific background staining or cross-reactivity with structurally similar proteins in other compartments may persist in the KO, complicating interpretation [19] [6]. Therefore, KO validation is often combined with other IHC-specific controls, such as isotype controls and blocking peptides, to rule out non-specific Fc-mediated binding or to confirm epitope specificity [69].
Essential Protocols for Researchers
Detailed Western Blot KO Validation Protocol
This protocol provides a step-by-step methodology for validating an antibody via CRISPR-Cas9 knockout in a Western blot format [10] [67] [36].
- Generation of Knockout Cell Line:
- Design and transfect a guide RNA (gRNA) specific to your target gene into your cell line of interest using the CRISPR-Cas9 system.
- Single-cell clone the transfected population and screen for clones with successful knockout via DNA sequencing or functional absence of the protein using a previously validated antibody.
- Sample Preparation:
- Culture WT and KO cells under identical conditions.
- Lyse cells using an appropriate RIPA buffer supplemented with protease and phosphatase inhibitors.
- Measure protein concentration of each lysate using a Bradford or BCA assay. Normalize all samples to the same concentration (e.g., 1-2 µg/µL) using lysis buffer.
- Prepare samples by mixing normalized lysate with Laemmli buffer (containing SDS and beta-mercaptoethanol). Heat denature at 95°C for 5 minutes.
- Gel Electrophoresis and Blotting:
- Load 20-30 µg of total protein from WT and KO lysates, plus a protein molecular weight ladder, onto an SDS-polyacrylamide gel (SDS-PAGE).
- Run electrophoresis at constant voltage until the dye front approaches the bottom of the gel.
- Transfer proteins from the gel to a PVDF or nitrocellulose membrane using a wet or semi-dry transfer system.
- Immunodetection:
- Block the membrane with 5% non-fat dry milk or BSA in TBST for 1 hour at room temperature.
- Incubate with the primary antibody of interest, diluted in blocking buffer or a proprietary antibody diluent, overnight at 4°C with gentle agitation.
- Wash the membrane 3 times for 5-10 minutes each with TBST.
- Incubate with an appropriate HRP-conjugated secondary antibody, diluted in blocking buffer (e.g., 1:10,000), for 1 hour at room temperature.
- Wash the membrane 3 times for 5-10 minutes each with TBST.
- Detection and Analysis:
- Develop the blot using a chemiluminescent substrate and image with a digital imager.
- Analyze the results. A specific antibody will show a band at the expected molecular weight in the WT lane that is absent in the KO lane.
- Strip and re-probe the membrane with a loading control antibody (e.g., Anti-GAPDH, Anti-Actin) to confirm equal protein loading.
Key Research Reagent Solutions for KO Validation
Table 3: Essential Materials and Reagents for KO Validation Experiments
| Item | Function in Experiment | Key Considerations |
|---|---|---|
| CRISPR-Cas9 System | Genetically engineers cell lines to lack the target protein, creating the essential negative control [67]. | Requires design of specific gRNA; off-target effects should be considered and minimized. |
| Knockout-Validated Antibodies | Positive control antibodies for the target or loading controls that have themselves been rigorously validated [67]. | Crucial for confirming successful knockout and for normalizing Western blot data. |
| PVDF Membrane | Serves as the solid support to which separated proteins are transferred after SDS-PAGE [10]. | Preferred over nitrocellulose for its higher protein binding capacity and chemical resistance [10]. |
| Loading Control Antibodies | Detect constitutively expressed proteins (e.g., GAPDH, Actin, Tubulin) to ensure equal protein loading across lanes [57]. | Must have a different molecular weight than the target protein and be expressed in the cell/tissue type used [57]. |
| Phosphatase & Protease Inhibitors | Added to lysis buffers to preserve the native state of proteins and their modifications during extraction [10]. | Essential for preventing protein degradation or dephosphorylation, which can create spurious bands. |
| Chemiluminescent Substrate | Reacts with the HRP enzyme on the secondary antibody to produce light for signal detection [67]. | Choice of substrate can affect sensitivity and dynamic range of the detection. |
Knockout validation is an indispensable, gold-standard method for confirming antibody specificity, directly addressing a major source of irreproducibility in biomedical research. Its implementation, however, is distinctly context-dependent. Western blotting provides a more straightforward and interpretable platform for initial KO validation due to its ability to separate proteins by size and visually identify non-specific bands. In contrast, while equally critical for IHC, KO validation must be interpreted with caution, considering the complex morphology of tissue sections and the potential for persistent non-specific background.
For researchers and drug developers, incorporating KO validation into their antibody screening workflow is no longer optional but a necessity for generating robust and reliable data. The most rigorous approach involves using KO validation not in isolation, but as part of a broader strategy that aligns with the IWGAV's five pillars, potentially including orthogonal methods and independent antibody verification [68] [36]. By doing so, the scientific community can advance with greater confidence in the protein detection data that underpins research findings and therapeutic development.
The reproducibility of research findings is a cornerstone of the scientific method, yet it has become a growing concern in life sciences, particularly in research reliant on antibody-based protein detection methods like Western blot (WB) and immunohistochemistry (IHC) [36]. A critical source of this irreproducibility is the application-specific performance of antibodies [19] [29]. An antibody that performs well in one technique, such as WB, may be inadequate for another, such as IHC, due to differences in protein conformation, target accessibility, and sample processing [29]. One study analyzing 13,000 antibodies found that in Western blot applications, only 45% yielded supportive staining, while 43% produced bands of the wrong size and 12% showed no staining at all [19]. This highlights that an antibody's specificity is not an intrinsic property but must be demonstrated within the context of its intended use. This guide objectively compares IHC and WB to provide researchers with strategies for rigorous antibody and assay validation, thereby enhancing the reliability of protein detection data.
Fundamental Comparison: IHC vs. Western Blot
While both IHC and WB exploit the specific binding of antibodies to target antigens, they serve distinct purposes and provide complementary information. Understanding their core differences is the first step in selecting the appropriate assay and interpreting results correctly.
Table 1: Core Characteristics of IHC and Western Blot
| Feature | Immunohistochemistry (IHC) | Western Blot (WB) |
|---|---|---|
| Primary Output | Localization of protein within tissue architecture and specific cell types [70]. | Determination of protein presence and molecular weight; semi-quantification of protein levels [70] [6] [4]. |
| Sample Type | Tissue sections (frozen or paraffin-embedded) that preserve structure [70]. | Cell or tissue extracts (homogenized lysates) [70]. |
| Key Advantage | Provides contextual data within the intact tissue, revealing spatial distribution [6]. | Provides information on protein size and allows for relative quantification [70] [6]. |
| Key Limitation | Lack of molecular weight confirmation; semi-quantitative at best [6]. | Loses all spatial and subcellular localization context; protein denaturation may alter epitopes [70]. |
| Common Applications | Diagnostics (e.g., cancer typing), pathology, localization studies in neuroscience [6]. | Confirming antibody specificity, measuring changes in protein expression, detecting post-translational modifications [70] [4]. |
The choice between IHC and WB is not a matter of which is superior, but which is fit-for-purpose. IHC is unparalleled for determining the precise cellular and subcellular location of a protein, making it indispensable for diagnostic pathology and understanding tissue morphology [70] [6]. Conversely, WB is a powerful tool for confirming the identity of a protein based on its expected molecular weight and for providing semi-quantitative data on its expression levels across different sample groups [4]. A common and robust strategy is to use these techniques in tandem: IHC to identify where a protein is located, and WB to provide more quantitative validation of expression changes [70].
Validation Strategies for Western Blot
The Importance of Normalization and Controls
For Western blotting to yield reproducible and reliable quantitative data, careful normalization is required to account for variability in protein loading and transfer efficiency. While housekeeping proteins (HKPs) like GAPDH and β-actin have been traditionally used, their expression can vary with experimental conditions, making them unreliable [71]. Total Protein Normalization (TPN) is now considered the gold standard, as it normalizes the target signal to the total amount of protein in each lane, providing a larger dynamic range and more accurate quantitation [71].
Appropriate controls are non-negotiable for validation. These include:
- Positive Controls: Lysates from cell lines known to express the target protein confirm that the immunodetection protocol is working [36].
- Negative Controls: The use of genetic knockout (KO) samples is the accepted "gold standard" for validating antibody specificity in WB. It provides experimental proof that the observed band is the specific target [36] [72].
- Molecular Weight Markers: Essential for verifying that the detected band corresponds to the expected size of the target protein [71].
Experimental Protocol for Western Blot Validation
A validated WB experiment requires meticulous attention at every step [73]:
- Sample Preparation: Tissues or cells are homogenized in a lysis buffer containing detergents and protease/phosphatase inhibitors to solubilize proteins and preserve post-translational modifications. Protein concentration is then quantified to ensure equal loading [73].
- Gel Electrophoresis: Proteins are denatured, reduced, and separated by size using SDS-PAGE. The percentage of polyacrylamide in the gel should be chosen based on the molecular weight of the target protein [73].
- Electrophoretic Transfer: Separated proteins are transferred from the gel to a membrane (typically PVDF or nitrocellulose). The transfer method (wet, semi-dry) and buffer conditions should be optimized for protein size [4].
- Blocking and Incubation: The membrane is blocked with a reagent like BSA or non-fat milk to prevent non-specific antibody binding. It is then incubated with a validated primary antibody, followed by a labeled secondary antibody [4] [73].
- Detection and Analysis: The signal is developed (via chemiluminescence or fluorescence) and captured digitally. Quantification must be performed within the linear dynamic range of the detection system, and the target protein signal should be normalized to the total protein in the lane [71] [73].
Validation Strategies for Immunohistochemistry
Controlling for Tissue Integrity and Anticity
Validation for IHC presents unique challenges centered on preserving tissue morphology and antigen accessibility. Key considerations include:
- Fixation and Processing: The type of fixative (e.g., formaldehyde) and duration of fixation can significantly impact antigenicity. Over-fixation can mask epitopes, while under-fixation can lead to poor tissue preservation [72].
- Epitope Retrieval: For formalin-fixed, paraffin-embedded tissues, heat-induced or enzymatic epitope retrieval is often necessary to reverse cross-links and expose the antibody-binding site [70].
- Antibody Specificity in Situ: Unlike WB, there is no molecular weight confirmation in IHC. Therefore, validation relies heavily on demonstrating that the staining pattern is specific through the use of controls [6].
Experimental Protocol for IHC Validation
A rigorous IHC protocol includes [70]:
- Sample Preparation and Sectioning: Tissues are fixed, dehydrated, cleared, and embedded in paraffin or optimal cutting temperature (OCT) compound for frozen sections. Thin sections (3-5 µm) are cut and mounted on slides [6].
- Deparaffinization and Rehydration: For paraffin-embedded sections, slides are deparaffinized in xylene and rehydrated through a series of graded alcohols to water [6].
- Antigen Retrieval: Slides are subjected to heat or enzymatic treatment to unmask epitopes that were cross-linked during fixation [70].
- Blocking and Staining: Endogenous peroxidase activity is blocked (for enzymatic detection), followed by incubation with a protein block to reduce non-specific background. The tissue is then incubated with the primary antibody and a compatible detection system [70].
- Detection and Counterstaining: The signal is developed using a chromogen (e.g., DAB) or fluorophore. A counterstain (e.g., hematoxylin) is often applied to provide morphological context [70].
- Controls: Critical controls for IHC include:
- Positive Control Tissue: A tissue known to express the target protein, processed identically to the test samples.
- Negative Control: The most critical negative control is the use of an isotype control or, ideally, the same IHC protocol applied to a genetic knockout tissue [72]. This confirms that the observed staining is not due to non-specific interactions.
A Unified Framework for Antibody Validation
To combat the reproducibility crisis, a proactive, multi-faceted approach to antibody validation is required. The following workflow outlines a strategic path for validating antibodies, integrating the key considerations for both WB and IHC.
This diagram illustrates that validation is an iterative process, not a one-time check. Key pillars of this framework include:
- Supplier Data Review: Begin with a critical assessment of the manufacturer's datasheet, which should include application-specific conditions, validation data, and lot/batch information [36].
- User Validation ("Trust, but Verify"): Even antibodies validated by a supplier must be confirmed by the researcher in their specific experimental context, as factors like sample type and blocking reagents can drastically affect performance [36].
- Application-Specific Strategies: As shown in the workflow, validation paths for WB and IHC differ. For WB, the gold standard is testing with a knockout lysate to confirm the disappearance of the target band [36] [72]. For IHC, the parallel is demonstrating absent staining in knockout tissue [72].
- Orthogonal Confirmation: Where possible, results from one method (e.g., WB) should be confirmed with a complementary technique (e.g., IHC or mass spectrometry) to provide additional evidence of specificity [19] [36].
- Batch-to-Batch Variation: Researchers should be aware that performance can vary between antibody batches. Where feasible, using recombinant antibodies can provide greater consistency and reduce this source of irreproducibility [36].
Essential Research Reagent Solutions
The following table lists key reagents and materials essential for performing validated IHC and WB experiments.
Table 2: Key Research Reagents for Protein Detection Assays
| Reagent / Material | Function | Application |
|---|---|---|
| Validated Primary Antibodies | Binds specifically to the target protein epitope. Must be validated for the specific application (e.g., WB, IHC) [36]. | WB & IHC |
| Knockout Cell or Tissue Lysates | Serves as a critical negative control to confirm antibody specificity by demonstrating absence of signal [36] [72]. | WB & IHC |
| Total Protein Stain (e.g., No-Stain Label) | Fluorescent label used for total protein normalization (TPN), the most accurate method for quantitative WB [71]. | WB |
| Phosphatase & Protease Inhibitors | Added to lysis buffers to preserve the native state of proteins and their post-translational modifications during extraction [73]. | WB |
| Antigen Retrieval Buffers | Solutions used to reverse formaldehyde-induced cross-links and expose epitopes in fixed tissue sections [70]. | IHC |
| Recombinant Antibodies | Antibodies produced from synthetic DNA sequences, offering superior batch-to-batch consistency compared to traditional polyclonals [36]. | WB & IHC |
Publication Guidelines and Data Integrity
Leading scientific journals have implemented stricter guidelines for publishing protein data to promote transparency and integrity. Key expectations include:
- Image Manipulation Policies: Journals universally prohibit the use of editing tools that obscure, eliminate, or introduce data. Adjustments to brightness or contrast must be applied uniformly across the entire image [71].
- Blot Presentation: Cropped gels and blots must retain all important bands, and any lane splicing or re-arrangement must be clearly disclosed. Molecular weight markers must be visible [71].
- Normalization Methods: There is a strong push towards requiring Total Protein Normalization over housekeeping proteins for quantitative WB [71].
- Data Reporting: Authors must provide detailed descriptions of antibodies (catalog numbers, lots, dilutions) and methods in the manuscript to enable experimental replication [72].
Addressing the reproducibility crisis in antibody-based research requires a fundamental shift in practice. The core principle is that antibody validation must be context-specific [19] [29]. By understanding the distinct advantages and limitations of IHC and Western blot, implementing rigorous validation frameworks like knockout controls and total protein normalization, and adhering to evolving journal guidelines, researchers can generate more reliable and reproducible data. Ultimately, overcoming this crisis is a shared responsibility that demands increased diligence, transparency, and adherence to standardized practices from all members of the scientific community.
Immunohistochemistry (IHC) and Western blot (WB) are foundational techniques in protein detection that exploit the specific binding of antibodies to target antigens, yet they deliver fundamentally different types of information for researchers. While IHC provides precise spatial localization of proteins within the context of intact tissues, Western blot excels at separating proteins by molecular weight and delivering semi-quantitative data on expression levels. The choice between these techniques is not a matter of superiority but depends entirely on the research question—whether it demands contextual protein distribution within morphological architecture or specific identification and relative quantification of a protein target. This guide provides a direct feature-by-feature comparison to inform method selection for biomedical research and drug development applications.
Fundamental Principles and Technical Comparison
Both techniques rely on antibody-antigen interactions but diverge significantly in their implementation and final readouts.
Immunohistochemistry (IHC) is an immunostaining technique that visualizes the presence and precise cellular and subcellular localization of target antigens within intact tissue sections. Detection is achieved using enzymes that produce a chromogenic signal or fluorophores for fluorescence [6] [22]. Its primary strength is preserving tissue morphology and architectural context.
Western Blot (WB), also known as immunoblotting, is an analytical method that detects specific proteins from complex mixtures extracted from cells or tissues. It involves separating proteins by molecular weight via gel electrophoresis, transferring them to a membrane, and probing with target-specific antibodies. It provides information on protein presence and molecular weight, and allows for semi-quantification of relative protein levels [4] [71].
Direct Technique Comparison Table
The following table summarizes the critical differences between the two methodologies across key parameters.
Table 1: Feature-by-Feature Comparison of IHC and Western Blot
| Feature | Immunohistochemistry (IHC) | Western Blot (WB) |
|---|---|---|
| Core Principle | Antibody binding to antigen in intact tissue; visual localization [22] | Protein separation by size, transfer to membrane, antibody detection [4] |
| Sample Type | Tissue sections (frozen or paraffin-embedded) [74] [22] | Cell or tissue lysates (homogenized extracts) [74] [75] |
| Information Provided | Protein localization within tissue architecture and cell types [6] | Protein presence, molecular weight, and relative quantity [4] |
| Quantitative Capability | Semi-quantitative (subjective scoring of intensity and distribution) [22] | Semi-quantitative to quantitative; proportional to protein amount [6] [71] |
| Throughput | Low to medium; manual process, limited samples per day [75] | Medium; can process tens of samples per gel, but hands-on time is significant [75] |
| Key Advantage | Visualizes exact spatial context and distribution of the target protein [6] [74] | Confirms protein identity via molecular weight and provides robust quantitative data [6] [4] |
| Primary Limitation | No molecular weight confirmation; subjective interpretation [6] [22] | Loses all spatial and contextual tissue information [75] |
| Common Detection Methods | Chromogenic (e.g., DAB/HRP) or fluorescent tags [6] [74] | Chemiluminescent, fluorescent, or colorimetric substrates [6] [74] |
Experimental Workflows and Protocols
Workflow Visualization
The following diagrams illustrate the core procedural pathways for IHC and Western blot, highlighting the key steps that define each technique.
IHC Workflow
Figure 1: IHC Workflow: This process preserves tissue structure, culminating in visual analysis of protein localization.
Western Blot Workflow
Figure 2: Western Blot Workflow: This process involves sample homogenization and separation, ending with digital quantification.
Critical Procedural Steps
Sample Preparation Protocols
- IHC Sample Preparation: Tissue samples are fixed (commonly with formalin), embedded in paraffin wax or cryomedia, and sectioned into thin slices (typically 3–5 µm) using a microtome. The sections are mounted on slides and dehydrated through a series of alcohol washes. A critical step is antigen retrieval, which often uses heat or enzymes to unmask epitopes cross-linked by fixation [6] [22].
- Western Blot Sample Preparation: Cells or tissues are homogenized using mechanical methods (e.g., Dounce homogenizers, sonication) in lysis buffers to release intracellular contents. The resulting lysate is mixed with a sample buffer containing SDS, which denatures the proteins and confers a uniform negative charge. The protein concentration is then quantified to ensure equal loading across the gel [4].
Detection and Normalization Methods
- IHC Detection: Typically uses enzymatic or fluorescence-based detection. For chromogenic detection, an enzyme such as Horseradish Peroxidase (HRP) is conjugated to the secondary antibody and converts a substrate (e.g., DAB) into a colored precipitate at the site of antibody binding [74] [22].
- Western Blot Normalization: Critical for quantitative accuracy. The traditional method of using housekeeping proteins (HKPs) like GAPDH or β-actin is falling out of favor due to their variable expression under different experimental conditions. Total Protein Normalization (TPN) is now considered the gold standard, as it normalizes the target protein signal to the total amount of protein in each lane, providing a more reliable and robust quantitative result [71].
Research Reagent Solutions and Essential Materials
Successful execution of IHC and Western blot requires a suite of specific, high-quality reagents. The table below details key materials and their functions.
Table 2: Essential Research Reagents for IHC and Western Blot
| Reagent Category | Specific Examples | Primary Function |
|---|---|---|
| Fixation & Embedding | Formalin, Paraffin Wax, OCT Compound (IHC) | Preserves tissue architecture and prevents degradation (IHC) [22]. |
| Lysis Buffers | RIPA Buffer, SDS Sample Buffer (WB) | Disrupts cells and solubilizes proteins for extraction (WB) [4]. |
| Separation Matrix | Polyacrylamide Gels (WB) | Separates proteins based on molecular weight (SDS-PAGE) (WB) [4]. |
| Transfer Membrane | Nitrocellulose, PVDF (WB) | Immobilizes separated proteins for antibody probing (WB) [4] [76]. |
| Primary Antibodies | Monoclonal or Polyclonal Antibodies | Specifically binds to the protein target (antigen) of interest [6] [77]. |
| Secondary Antibodies | HRP- or Fluorophore-conjugated | Binds to the primary antibody and enables detection with high sensitivity [6] [4]. |
| Detection Substrates | DAB (IHC), Chemiluminescent (WB) | Generates a measurable signal (color, light) upon enzyme action [74] [71]. |
| Blocking Reagents | BSA, Non-Fat Dry Milk, Serum | Covers non-specific binding sites on the membrane or tissue to reduce background noise [4]. |
| Normalization Reagents | No-Stain Protein Labeling Reagents, Anti-β-Actin (WB) | Allows for accurate quantification by correcting for variations in sample loading (WB) [71]. |
Applications and Integration in Biomedical Research
Primary Application Domains
The distinct outputs of IHC and Western blot steer their use toward different, often complementary, applications in research and diagnostics.
- IHC Applications: IHC is indispensable in diagnostic pathology, particularly for cancer typing, where it identifies abnormal cells and characteristic protein markers (e.g., HER2, ER/PR) within the tumor microenvironment [6] [22]. It is also widely used to locate proteins and biomarkers in normal and diseased tissues and to detect infectious agents within tissue sections [6].
- Western Blot Applications: WB is a cornerstone in basic research for confirming protein identity, assessing changes in expression levels, and detecting post-translational modifications (e.g., phosphorylation, glycosylation) [4]. Clinically, it serves as a confirmatory test for infectious diseases like HIV and autoimmune diseases, and is used to validate findings from high-throughput genomic or proteomic studies [6] [76].
A Complementary Workflow: PD-L1 Case Study
The two techniques are often most powerful when used in tandem. A prime example is in the validation of antibodies for detecting Programmed Cell Death Ligand 1 (PD-L1), a critical immune checkpoint protein in cancer immunotherapy [77]. A typical integrated workflow involves:
- Initial Specificity Check via Western Blot: Researchers first use Western blot with cell line extracts to confirm that a candidate PD-L1 antibody binds specifically to a single protein at the correct molecular weight. This step verifies antibody specificity before moving to the more complex tissue context [77].
- Contextual Validation via IHC: Once specificity is established, the antibody is applied in IHC on formalin-fixed, paraffin-embedded (FFPE) tumor tissue sections. This validates the antibody's performance in a clinically relevant format and reveals the spatial distribution of PD-L1 expression across tumor and immune cells [77]. This combined approach ensures that IHC diagnostics, which guide patient treatment decisions, are built upon a foundation of rigorously characterized reagents.
IHC and Western blot are not interchangeable but are selectively powerful tools defined by their unique capabilities. IHC is the unequivocal choice for contextual analysis, answering "where" a protein is located within a tissue. In contrast, Western blot is optimized for specific identification and semi-quantification, answering "if" and "how much" of a specific protein is present. For robust research, particularly in translational medicine and drug development, these techniques frequently serve complementary and mutually reinforcing roles. The strategic researcher will select the method based on the biological question, and increasingly, will leverage the strengths of both to generate comprehensive and reliable protein data.
For researchers in protein detection, selecting the appropriate analytical technique is a critical first step in experimental design. Immunohistochemistry (IHC) and Western blot (WB) represent two foundational methods that exploit antibody-antigen interactions but deliver fundamentally different types of information [6]. While both techniques can detect specific proteins within biological samples, their applications, data outputs, and experimental workflows differ significantly [2] [4]. This guide provides an objective comparison framework based on technical specifications, experimental requirements, and current publication standards to help researchers make informed decisions that align with their scientific objectives.
Technical Comparison: IHC vs. Western Blot
The choice between IHC and Western blot hinges on understanding their core capabilities and limitations. The table below summarizes the key differentiating factors:
| Parameter | Immunohistochemistry (IHC) | Western Blot (WB) |
|---|---|---|
| Primary Application | Protein localization within tissue context, cell typing, pathological diagnosis [6] [78] [22] | Protein detection, semi-quantification, and molecular weight determination in lysates [4] [71] |
| Spatial Information | Preserves tissue and cellular architecture; provides subcellular localization [78] [22] | Destroys native architecture; no spatial context [6] |
| Protein State | Proteins detected in situ, but fixed and cross-linked [2] | Proteins are denatured and separated by size [4] |
| Quantitative Capability | Semi-quantitative; scoring can be subjective [22] | Semi-quantitative to quantitative; requires careful normalization [4] [71] |
| Molecular Weight Info | No | Yes; confirms protein identity via size comparison [4] [6] |
| Multiplexing Potential | Easily up to 4 targets with fluorescence; more possible with advanced methods [2] | Limited; typically 2-3 targets if molecular weights differ and fluorescent detection is used [2] [78] |
| Throughput | Medium | Low to medium [2] |
| Key Advantage | Visualizes protein distribution in its physiological tissue context [6] [78] | Confirms protein identity by size and provides more robust quantification [4] [6] |
| Major Limitation | Lack of molecular weight confirmation; risk of off-target staining [6] | Loss of tissue morphology and spatial information [6] |
Experimental Workflow and Protocol Considerations
Immunohistochemistry Workflow
The IHC process prioritizes the preservation of tissue integrity for morphological analysis [2] [22].
Critical IHC Protocol Steps:
- Sample Fixation: Tissues are typically fixed in formalin or paraformaldehyde to preserve cellular structure and prevent degradation. Over-fixation can mask epitopes, while under-fixation leads to poor morphology [2] [22].
- Antigen Retrieval: For formalin-fixed, paraffin-embedded (FFPE) tissues, a heat- or enzyme-based antigen retrieval step is often essential to reverse methylene cross-links and expose hidden epitopes [2] [22].
- Blocking: Incubation with serum or protein blocks (e.g., BSA) reduces non-specific binding of antibodies to charged sites on the tissue [2].
- Detection: Chromogenic detection (e.g., DAB with HRP) produces a permanent, colored precipitate. Fluorescent detection (e.g., with fluorophore-conjugated antibodies) allows for multiplexing but requires a fluorescence microscope [2] [78].
Western Blot Workflow
The Western blot process focuses on separating proteins by molecular weight for specific identification and quantification [4].
Critical Western Blot Protocol Steps:
- Sample Preparation: Cells or tissues are lysed in detergent-containing buffers. The protein concentration of the lysate must be accurately quantified to ensure equal loading across gel lanes. Samples are then denatured in SDS-containing buffer [4].
- Gel Electrophoresis: Denatured proteins are separated by size via SDS-PAGE, which allows for resolution of individual protein bands based on molecular weight [4].
- Membrane Transfer: Proteins are electrophoretically transferred from the gel onto a membrane (typically nitrocellulose or PVDF) to create a replica for probing with antibodies [4].
- Normalization for Quantification: For accurate quantitation, signal from the target protein must be normalized to a loading control. Total Protein Normalization (TPN) is now considered the gold standard over traditional Housekeeping Proteins (HKPs) like GAPDH or β-actin, as TPN is not affected by variable HKP expression under experimental conditions [71].
Decision Framework: Selecting the Right Technique
Use the following flowchart to guide your choice between IHC and Western blot based on your primary research question.
Framework Application Notes:
- Choose IHC when: Your question is "where?"—you need to identify which specific cells in a heterogeneous tissue express the protein, determine subcellular localization (nuclear, cytoplasmic, membrane), or visualize pathological morphology and protein distribution simultaneously [6] [78] [22].
- Choose Western Blot when: Your question is "how much?" or "is it the correct protein?"—you need to measure relative changes in protein expression levels, confirm protein identity using molecular weight, or detect specific post-translational modifications (e.g., phosphorylation) with size verification [4] [6].
- Use both techniques complementarily: For a robust study, particularly when investigating a new target or model system, use IHC to first establish the spatial expression pattern and then use Western blot for quantitative assessment across multiple samples [8]. This orthogonal approach validates findings across different methodological platforms.
Essential Research Reagent Solutions
The reliability of both IHC and Western blot data is fundamentally dependent on the quality and appropriate use of key reagents.
| Reagent / Material | Critical Function | Application-Specific Notes |
|---|---|---|
| Validated Primary Antibodies | Binds specifically to the protein of interest. | Performance is application-specific [8] [60]. An antibody validated for WB may not work in IHC due to fixation-induced epitope masking [79]. |
| Fixatives (e.g., Formalin, PFA) | Preserves tissue architecture and prevents degradation. | IHC-specific. Over-fixation can mask epitopes, requiring antigen retrieval [2] [22]. |
| Detection System (Enzymatic/Fluorescent) | Generates a measurable signal from antibody binding. | Choice depends on readout: chromogenic (DAB) for brightfield, fluorophores for microscopy (IHC) or digital imagers (WB) [2] [78]. |
| Blocking Solution (e.g., BSA, non-fat milk) | Reduces non-specific antibody binding to minimize background. | Used in both techniques. Milk is common for WB but should be avoided with phospho-specific antibodies due to casein content [4]. |
| Normalization Controls | Ensures equal loading and accurate quantification. | WB: Total Protein Normalization (TPN) is the new gold standard [71]. IHC: Relies on internal negative/positive tissue structures and control slides. |
| Positive & Negative Controls | Verifies assay specificity and sensitivity. | Essential for both techniques. Include known positive/negative tissue sections (IHC) or cell lysates (WB). Genetic knock-out controls are ideal for confirming antibody specificity [80]. |
Best Practices for Rigor and Reproducibility
Adhering to community standards is critical for generating publishable data.
- Antibody Validation: Ensure antibodies are validated for your specific application (IHC or WB) using strategies like genetic knockouts (KO) or comparison with orthogonal data [60] [79]. For large IHC projects, use monoclonal antibodies to minimize lot-to-lot variability [80].
- Image Acquisition and Processing: Follow journal guidelines for image presentation. Nature, JBC, and others strongly discourage excessive manipulation of blot and IHC images, such as splicing lanes without clear indication or adjusting contrast to mask data [71].
- Quantification and Normalization: For Western blot, move beyond housekeeping proteins (HKPs) like GAPDH and β-actin, which can vary with experimental conditions. Implement Total Protein Normalization (TPN) for more accurate and reliable quantitation, as now recommended by leading journals [71].
- Experimental Replicates and Controls: Always include biological and technical replicates. For IHC, run no-primary-antibody controls and isotype controls to identify non-specific staining [80].
IHC and Western blot are powerful yet distinct techniques that answer different biological questions. IHC is the unequivocal choice for spatial localization within a tissue context, while Western blot excels at protein identification and semi-quantification. The most rigorous research often employs these methods as complementary tools, using IHC to identify where a protein is expressed and Western blot to quantify how much is present. By applying the decision framework and adhering to best practices outlined in this guide, researchers can select the optimal technique, generate reliable data, and accelerate scientific discovery.
Conclusion
IHC and Western Blot are complementary, not competing, techniques that remain vital in the modern research and clinical toolkit. IHC is unparalleled for providing spatial context within tissues, making it indispensable for diagnostics and morphological correlation. Western Blot excels in confirming protein identity by molecular weight and offering semi-quantitative data. The key to success with either method lies in rigorous antibody validation, systematic troubleshooting, and the consistent use of appropriate controls to ensure reproducible and reliable data. As proteomics advances with high-throughput technologies like mass spectrometry and multiplex arrays, the foundational understanding and proper application of IHC and Western Blot will continue to be essential for validating new discoveries and bridging the gap between research and clinical practice.
References
- 1. Review of immunohistochemistry techniques: Applications, ... [https://www.sciencedirect.com/science/article/abs/pii/S0740257024000467?utm_source=chatgpt.com]
- 2. Immunohistochemistry (IHC): The Complete Guide [https://www.antibodies.com/applications/immunohistochemistry]
- 3. Western Blot: The Complete Guide [https://www.antibodies.com/applications/western-blotting]
- 4. Western Blotting (Immunoblotting): History, Theory, Uses ... [https://pmc.ncbi.nlm.nih.gov/articles/PMC12303220/]
- 5. When IHC is the application choice [https://www.cellsignal.com/applications/immunohistochemistry/when-use-immunohistochemistry?srsltid=AfmBOoqSN60A8JSR45LLEeVSon0dzE493Cb0ecBpRkSLqtHs40zVyR_W]
- 6. A Comparison of Immunohistochemistry and Western Blot [https://www.news-medical.net/life-sciences/A-Comparison-of-Immunohistochemistry-and-Western-Blot.aspx]
- 7. IHC Detection Systems: Advantages and Disadvantages [https://www.novusbio.com/ihc-detection?srsltid=AfmBOoqwJTr3n5jWV5zPFu51zxkyejcaXLDB1Ulo7eoWzVQHyMV75o-s]
- 8. Identification of high-performing antibodies for the reliable ... [https://link.springer.com/article/10.1007/s00401-024-02729-7]
- 9. Western blot and immunohistochemical analysis of mouse ... [https://pmc.ncbi.nlm.nih.gov/articles/PMC10772879/]
- 10. Western Blot - StatPearls - NCBI Bookshelf - NIH [https://www.ncbi.nlm.nih.gov/books/NBK542290/]
- 11. Counterstains in Immunohistochemistry: Principles, ... [https://www.bosterbio.com/blog/post/counterstains-in-immunohistochemistry-principles-options-and-troubleshooting?srsltid=AfmBOopL6WK8GqzqZc11V1LhB5d2TYBTGvqpCPoXDKLFjupBeGqPJs9k]
- 12. A brief guide to good practices in pharmacological ... [https://www.nature.com/articles/s41401-020-00539-7]
- 13. A novel quantitative immunohistochemistry method for ... [https://www.nature.com/articles/modpathol2016176]
- 14. Validating Antibodies for Quantitative Western Blot ... [https://pmc.ncbi.nlm.nih.gov/articles/PMC6063895/]
- 15. How to Design Positive and Negative Controls for IHC , WB... | Boster Bio [https://www.bosterbio.com/how-to-design-positive-negative-controls-ihc-western-blot-elisa]
- 16. Hallmarks of Antibody Validation: Binary... | Cell Signaling Technology [https://www.cellsignal.com/about-us/approach-validation-principles/binary-model]
- 17. When IHC is the application choice [https://www.cellsignal.com/applications/immunohistochemistry/when-use-immunohistochemistry?srsltid=AfmBOoqPMJw4-XV54cnz3c8GEZ_vnQE98yL7n2toMvTZ3i4C8iFJ5_6J]
- 18. IHC Detection Systems: Advantages and Disadvantages [https://www.novusbio.com/ihc-detection?srsltid=AfmBOoo9JvAdxaHRk3r34CCo_cO-NreSHFedLrAOLDgv8HpKCC4DEuXg]
- 19. Antibody performance in western blot applications is ... [https://pubmed.ncbi.nlm.nih.gov/24403002/]
- 20. Chromogenic and Fluorescent detection [https://stjohnslabs.com/chromogenic-and-fluorescent-detection/?srsltid=AfmBOordVqtrhBOfhOC6lEwtHgqFN4P9VjJOb2qy5m1pqksmdlTuqsN7]
- 21. Immunohistochemistry (IHC) Global Market Report 2025 [https://www.thebusinessresearchcompany.com/report/immunohistochemistry-ihc-global-market-report]
- 22. Review of immunohistochemistry techniques: Applications, ... [https://www.sciencedirect.com/science/article/abs/pii/S0740257024000467]
- 23. Spatial profiling of chromatin accessibility in formalin-fixed ... [https://www.nature.com/articles/s41467-025-60882-3]
- 24. Spatial Omics x Neuroscience: Dual ISH-IHC Brain Mapping [https://www.thermofisher.com/blog/life-in-the-lab/spatial-omics-dual-ish-ihc-brain-mapping/]
- 25. Abcam: Leading the way in antibody performance [https://www.abcam.com/en-us/stories/articles/ycharos-results-of-abcam-and-competitor-antibodies]
- 26. A High-Throughput ImmunoHistoFluorescence (IHF) ... [https://www.mdpi.com/2073-4409/14/14/1109]
- 27. Boster Bio Life Science Blog: Western Blot, IHC, and ELISA ... [https://www.bosterbio.com/blog/category/applications?srsltid=AfmBOoqPAIvZx1lmuNvD0pqVd_PWwEGMQq8F7pAfIQigUhpsJKiUWU3f]
- 28. When IHC is the application choice [https://www.cellsignal.com/applications/immunohistochemistry/when-use-immunohistochemistry?srsltid=AfmBOoqhTpBpg4W3jUkqUeOoNP-0j43qtkaEUu7tNM_HoC9MV_Z1c7-p]
- 29. Should we ignore western blots when selecting antibodies ... [https://www.nature.com/articles/nmeth.4192]
- 30. Identification of high-performing antibodies for the reliable ... [https://pmc.ncbi.nlm.nih.gov/articles/PMC11102361/]
- 31. Western blot protocol [https://www.abcam.com/en-us/technical-resources/protocols/western-blot]
- 32. Western blotting guide: Part 6, Secondary Antibodies [https://www.jacksonimmuno.com/secondary-antibody-resource/immuno-techniques/western-blotting-guide-part-6/]
- 33. ELISA vs Western Blot: When to Use Each Immunoassay ... [https://www.thermofisher.com/blog/life-in-the-lab/western-blot-or-elisa/]
- 34. When IHC is the application choice [https://www.cellsignal.com/applications/immunohistochemistry/when-use-immunohistochemistry?srsltid=AfmBOoqVOYFj2vZZlXRo7Uc2MBGfSX46aJX-2lbG3sEE2mqusDAdK2xB]
- 35. Introduction to IHC antibody validation for Cancer biomarkers [https://www.abcam.com/en-us/technical-resources/guides/cancer-biomarker-antibody-validation-ihc/intro-ihc-cancer-biomarker-validation]
- 36. Antibody validation for Western blot: By the user, for the user [https://pmc.ncbi.nlm.nih.gov/articles/PMC6983856/]
- 37. Proteomics in Diagnostic Evaluation and Treatment of Breast ... [https://pmc.ncbi.nlm.nih.gov/articles/PMC12113354/]
- 38. Sensitivity and Specificity of p53 Protein Detection by ... [https://pubmed.ncbi.nlm.nih.gov/18025850/]
- 39. Western blot [https://en.wikipedia.org/wiki/Western_blot]
- 40. Quantitative Western Blot Analysis [https://www.thermofisher.com/us/en/home/life-science/protein-biology/protein-biology-learning-center/protein-biology-resource-library/pierce-protein-methods/quantitative-western-blot-analysis.html]
- 41. Evaluation of two sets of immunohistochemical and Western ... blot [https://bmcresnotes.biomedcentral.com/articles/10.1186/1756-0500-4-376]
- 42. Imaging in the Linear Range [https://www.licorbio.com/applications/quantitative-western-blots/imaging]
- 43. An overview of Western blotting for determining antibody ... [https://pubmed.ncbi.nlm.nih.gov/21370024/]
- 44. Immunohistochemistry (Histology + Imaging)-Mendelsohn ... [https://www.protocols.io/view/immunohistochemistry-histology-imaging-mendelsohn-dyuq7wvw.html]
- 45. Immunohistochemistry (IHC) Troubleshooting Guide & the ... [https://www.cellsignal.com/learn-and-support/troubleshooting/ihc-troubleshooting-guide?srsltid=AfmBOopit9GBT68oMnWh8Pbyh7dx2SjDUkGr1NLTTTLEuIpmoTWNqaP_]
- 46. Antigen Retrieval in IHC: Why It Matters and How to Get ... [https://www.atlasantibodies.com/knowledge-hub/blog/antigen-retrieval-in-ihc-why-it-matters-and-how-to-get-it-right/]
- 47. Ultimate IHC Troubleshooting Guide: Fix Weak Staining & ... [https://www.atlasantibodies.com/knowledge-hub/blog/the-ultimate-ihc-troubleshooting-guide-from-weak-staining-to-high-background/]
- 48. Immunohistochemistry Troubleshooting [https://www.antibodies.com/applications/immunohistochemistry/ihc-troubleshooting]
- 49. IHC Troubleshooting Guide [https://www.thermofisher.com/us/en/home/life-science/protein-biology/protein-biology-learning-center/protein-biology-resource-library/pierce-protein-methods/ihc-troubleshooting-guide.html]
- 50. High background in immunohistochemistry [https://www.abcam.com/en-us/technical-resources/troubleshooting/high-background-in-immunohistochemistry]
- 51. Revisiting the scientific method to improve rigor and ... [https://pmc.ncbi.nlm.nih.gov/articles/PMC6203879/]
- 52. Western Blot Sample Preparation Protocol [https://www.thermofisher.com/us/en/home/life-science/protein-biology/protein-biology-learning-center/protein-gel-electrophoresis-information/western-blot-protocols/western-blot-sample-preparation.html]
- 53. Comprehensive Optimization of Western Blotting - PMC [https://pmc.ncbi.nlm.nih.gov/articles/PMC10453944/]
- 54. How to Optimize Your Western Blot Transfers [https://bitesizebio.com/8276/how-to-optimize-your-western-blot-transfers/]
- 55. When IHC is the application choice [https://www.cellsignal.com/applications/immunohistochemistry/when-use-immunohistochemistry?srsltid=AfmBOooWjVsFrqXJ7wvTAUF71SThJWsj--1XjhrJikNkkQuzTgyNBXhm]
- 56. 6 Essential IHC Controls for Reliable Staining Results [https://www.bosterbio.com/blog/post/6-ihc-controls-you-should-know?srsltid=AfmBOopL8AbGlFFu5efSDRkHVxcPfl6Y-9wO2l3DAK8zEpAZTu_EXAnT]
- 57. Recommended controls for western blot [https://www.abcam.com/en-us/technical-resources/guides/western-blot-guide/recommended-controls-for-western-blot]
- 58. Loading controls and antibody validation for Western blot ... [https://azurebiosystems.com/blog/loading-controls-antibody-validation-western-blot-quantification/]
- 59. Positive and negative controls for antibody validation [https://www.euromabnet.com/guidelines/positive-negative-controls.php]
- 60. Antibody Validation Essentials: Orthogonal Strategy - CST Blog [https://blog.cellsignal.com/hallmarks-of-validation-orthogonal-strategy]
- 61. When IHC is the application choice [https://www.cellsignal.com/applications/immunohistochemistry/when-use-immunohistochemistry?srsltid=AfmBOooq7dLSwkmRcxeNwGQXN7fU9PZhb5bH2eDkj54d32FCXw83kzSS]
- 62. What's Your Western Blot Success Rate? [https://www.bosterbio.com/blog/post/whats-your-western-blot-success-rate?srsltid=AfmBOoqtX3fMMdTdSCAHXe-fVcv7RBssiAww18RhnUj10spOhxkqhApR]
- 63. A Forgotten Principle in Immunocytochemistry: Optimal Dilution [https://pmc.ncbi.nlm.nih.gov/articles/PMC9903208/]
- 64. Evaluation of different commercial antibodies for their ... [https://www.sciencedirect.com/science/article/pii/S2475037922020672]
- 65. Blocking Buffer Selection Guide [https://www.rockland.com/resources/blocking-buffer-selection-guide/?srsltid=AfmBOooGFmo5rXa7sGl4LU_E-8fCLmKgEF5o_keNvZMldb2OkuR3MdrV]
- 66. Western blot blocking: Best practices [https://www.abcam.com/en-us/knowledge-center/western-blot/western-blot-blocking-methods]
- 67. Knockout (KO) Validation [https://www.antibodies.com/primary-antibodies/knockout-validation]
- 68. Guide to Antibody Validation Techniques [https://www.neobiotechnologies.com/resources/antibody-validation-methods/?srsltid=AfmBOoqAZOJZBTtoLmvLDY-P2utd7GAY49PZ-UNLtcDymd4HVN2w0V8V]
- 69. Antibody Validation for Immunohistochemistry [https://www.cellsignal.com/about-us/our-approach-process/antibody-validation-immunohistochemistry?srsltid=AfmBOooP5HLSrNz9FIZc56RgJzGSAiKma4OKhixKCFJfMwMz7NDyItmM]
- 70. When IHC is the application choice [https://www.cellsignal.com/applications/immunohistochemistry/when-use-immunohistochemistry?srsltid=AfmBOor4cW_NnhsL73KvvKAGjYe3I6PXfO1NOQF6LF6ItY3M7INZa69w]
- 71. 2024 Guide to Quantitative Western Blot Publication [https://www.thermofisher.com/blog/life-in-the-lab/2023-guide-to-quantitative-western-blot-publication/]
- 72. Improving generation and publication of protein ... [https://www.sciencedirect.com/science/article/abs/pii/S1871141325001386]
- 73. An overview of technical considerations for Western ... [https://pmc.ncbi.nlm.nih.gov/articles/PMC5138151/]
- 74. When IHC is the application choice [https://www.cellsignal.com/applications/immunohistochemistry/when-use-immunohistochemistry?srsltid=AfmBOoo0lxmyGY6WPAi7N8sHt3msyvqbqH4o4CBms3bCjcX9CnnPx-Uv]
- 75. Traditional protein analysis methods - Western blotting ... [https://www.nautilus.bio/blog/traditional-approaches-to-study-proteins-antibodies-and-other-affinity-reagents/]
- 76. Blotting Basics - Western Blot Applications in Preclinical ... [https://blog.championsoncology.com/blog/blotting-basics-western-blot-applications-in-preclinical-oncology-research-0]
- 77. Western Blot as a Support Technique for ... [https://pubmed.ncbi.nlm.nih.gov/33683685/]
- 78. When IHC is the application choice [https://www.cellsignal.com/applications/immunohistochemistry/when-use-immunohistochemistry?srsltid=AfmBOorhZ6Yg3TW8oiC7M7ppc5NBq-PZN4Mt6LPGk0cQc72oei61EY8F]
- 79. Five easy and effective methods to validate antibodies [https://www.nature.com/articles/d42473-020-00065-4]
- 80. Rigor & Reproducibility | Pathology Services Core [https://unclineberger.org/pathologyservices/rigor-and-reproducibility/]