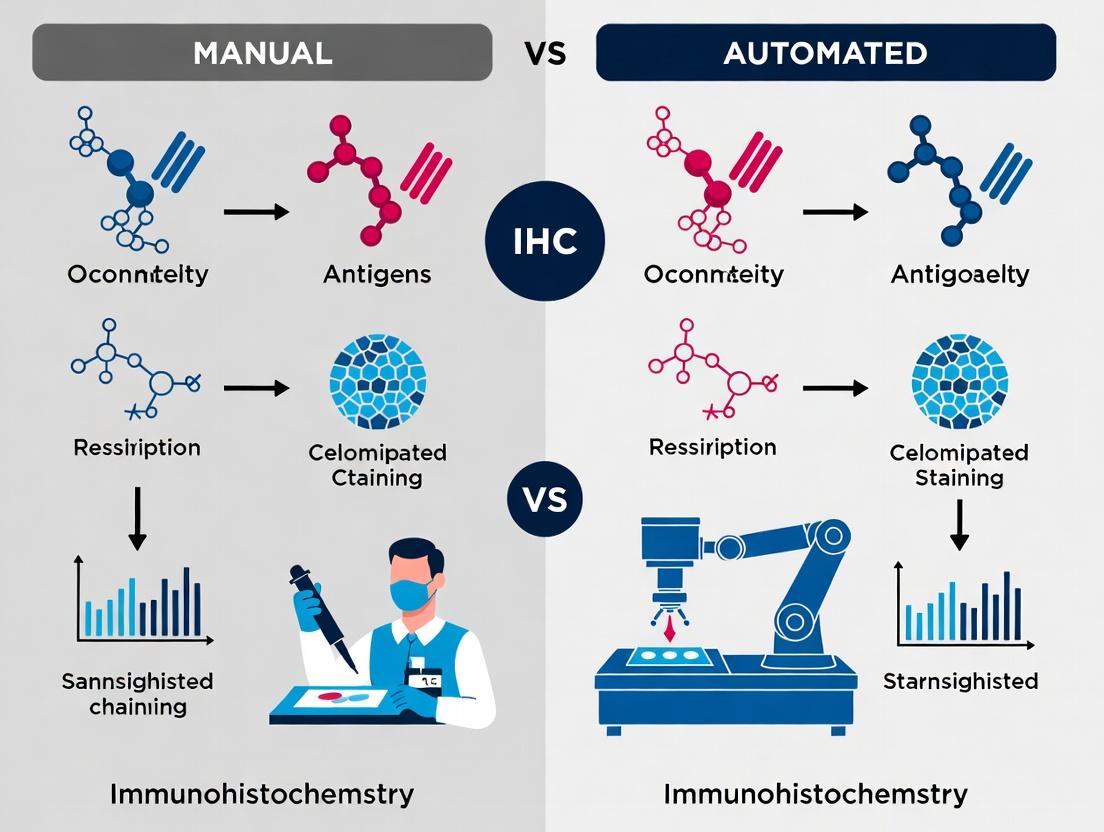
Manual vs Automated IHC Staining: A Comprehensive Guide for Researchers and Drug Development
This article provides a detailed, evidence-based comparison of manual and automated immunohistochemistry (IHC) staining methods tailored for researchers, scientists, and drug development professionals.
Manual vs Automated IHC Staining: A Comprehensive Guide for Researchers and Drug Development
Abstract
This article provides a detailed, evidence-based comparison of manual and automated immunohistochemistry (IHC) staining methods tailored for researchers, scientists, and drug development professionals. Covering foundational principles, methodological applications, troubleshooting strategies, and robust validation protocols, it serves as a critical resource for optimizing staining workflows. The analysis addresses key intents including selecting the appropriate method for specific laboratory needs, ensuring protocol reproducibility, identifying and resolving common technical issues, and establishing rigorous comparative validation standards for preclinical and clinical research.
Understanding the Core Principles: What is IHC Staining and Why Does Method Matter?
Immunohistochemistry (IHC) is a critical technique for detecting specific antigens in tissue sections, combining anatomical, immunological, and biochemical principles. Within the broader thesis comparing manual versus automated IHC staining methods, this protocol details the fundamental steps, from sample preparation to visualization, required for consistent, high-quality results. The choice between manual and automated processes significantly impacts reproducibility, throughput, and staining consistency, factors crucial for research and diagnostic applications.
Key Reagent Solutions and Materials
Table 1: Essential Research Reagent Solutions for IHC
| Reagent/Material | Primary Function in IHC Protocol |
|---|---|
| Formalin-Fixed Paraffin-Embedded (FFPE) Tissue Section | Preserves tissue morphology and antigenicity for analysis. |
| Xylene and Ethanol Series | Deparaffinizes and rehydrates tissue sections for aqueous-based staining. |
| Antigen Retrieval Buffer (e.g., Citrate, pH 6.0 or Tris-EDTA, pH 9.0) | Reverses formaldehyde-induced cross-links to expose epitopes for antibody binding. |
| Endogenous Enzyme Block (e.g., 3% H₂O₂) | Quenches peroxidase activity in tissues (e.g., erythrocytes) to prevent false-positive signals. |
| Protein Block (e.g., Normal Serum, BSA) | Reduces non-specific background staining by occupying hydrophobic or charged sites. |
| Primary Antibody | Specifically binds to the target antigen of interest. |
| Secondary Antibody (Conjugated) | Binds to the primary antibody and carries the label for detection (e.g., enzyme, fluorophore). |
| Chromogenic Substrate (e.g., DAB, AEC) | Enzyme (HRP/AP)-mediated precipitation of a colored compound at the antigen site. |
| Hematoxylin Counterstain | Provides contrast by staining nuclei blue/purple. |
| Mounting Medium (Aqueous or Organic) | Preserves stained slide under a coverslip for microscopy. |
Core IHC Protocol: A Step-by-Step Guide
Protocol 1: Standard Manual IHC Staining for FFPE Tissues (Chromogenic Detection)
Objective: To localize a specific protein antigen in an FFPE tissue section using a horseradish peroxidase (HRP)-based detection system.
Materials: As listed in Table 1, plus slide racks, humidified chamber, coplin jars, and appropriate wash buffer (e.g., Tris-Buffered Saline with Tween 20, TBST).
Procedure:
Deparaffinization & Rehydration:
- Bake slides at 60°C for 20-30 minutes.
- Immerse slides in fresh xylene (3 changes, 5 minutes each).
- Rehydrate through graded ethanol: 100% (2x), 95%, 70% (2 minutes each).
- Rinse in deionized water.
Antigen Retrieval:
- Heat-Induced Epitope Retrieval (HIER): Place slides in pre-heated antigen retrieval buffer (e.g., citrate, pH 6.0) in a decloaking chamber or pressure cooker. Heat at 95-100°C for 20 minutes. Cool at room temperature for 30 minutes.
- Rinse slides in wash buffer (TBST).
Endogenous Peroxidase Blocking:
- Apply 3% hydrogen peroxide (H₂O₂) to cover tissue. Incubate for 10 minutes at room temperature.
- Wash in TBST (3 x 2 minutes).
Protein Blocking:
- Apply 2-5% normal serum (from species of secondary antibody) or 1-3% BSA in TBST. Incubate for 30 minutes at room temperature.
- Tap off excess; do not wash.
Primary Antibody Incubation:
- Apply optimally titrated primary antibody diluted in blocking buffer.
- Incubate in a humidified chamber (1 hour at room temperature or overnight at 4°C for optimal sensitivity).
- Wash in TBST (3 x 5 minutes).
Secondary Antibody Incubation:
- Apply HRP-conjugated secondary antibody (e.g., anti-mouse/rabbit) diluted in blocking buffer.
- Incubate for 30-60 minutes at room temperature in a humidified chamber.
- Wash in TBST (3 x 5 minutes).
Chromogen Detection:
- Prepare DAB substrate solution immediately before use. Apply to tissue and monitor color development (typically 30 seconds to 5 minutes) under a microscope.
- Immerse slide in deionized water to stop the reaction.
Counterstaining & Mounting:
- Counterstain with hematoxylin for 30-60 seconds. Rinse in tap water.
- "Blue" in Scott's tap water or a weak ammonia solution. Rinse.
- Dehydrate through graded ethanol (70%, 95%, 100%) and clear in xylene (2 changes).
- Apply permanent mounting medium and a coverslip.
Comparative Data: Manual vs. Automated IHC
Table 2: Quantitative Comparison of Manual vs. Automated IHC Staining Methods
| Parameter | Manual IHC | Automated IHC (Benchmark Platform) | Implication for Research/Diagnostics |
|---|---|---|---|
| Hands-on Time per Slide | 45-60 minutes | <5 minutes | Automation drastically increases technician throughput. |
| Total Assay Time (Typical) | 6-8 hours (or overnight) | 2-4 hours | Faster turnaround for results. |
| Reagent Consumption | Higher (open system, evaporation) | Lower (closed, precise dispensing) | Cost savings and reduced batch variability. |
| Inter-Operator Variability (CV of Staining Intensity) | 15-25% | 5-10% | Automation enhances reproducibility critical for multi-center trials. |
| Intra-Batch Consistency | Moderate | High | Essential for longitudinal studies and companion diagnostics. |
| Initial Setup Cost | Low (basic equipment) | High (instrument purchase) | Capital expenditure vs. long-term labor savings. |
| Flexibility for Protocol Modification | High | Moderate to Low (software-defined) | Manual methods preferred for novel antibody/assay development. |
Visualization of IHC Workflow and Pathways
IHC Chromogenic Staining Basic Workflow
IHC Signal Generation Pathway
Manual immunohistochemistry (IHC) is a foundational, operator-driven technique for detecting specific antigens in tissue sections using a series of chromogenic detection steps performed by hand. In the context of a comparative study on staining methods, it represents the benchmark for flexibility, allowing for real-time protocol adjustments, but introduces variability dependent on technician skill and consistency.
Key quantitative parameters defining manual IHC staining are summarized in the table below.
Table 1: Key Metrics and Characteristics of Manual IHC Staining
| Parameter | Typical Range / Characteristic | Impact on Staining |
|---|---|---|
| Total Hands-On Time | 3 - 8 hours (per batch) | Increases with protocol complexity and number of slides. |
| Optimal Batch Size | 1 - 20 slides | Larger batches increase risk of reagent drying or timing inconsistencies. |
| Protocol Variability (CV) | 15% - 35% (inter-operator) | Higher than automated methods; depends on technician experience. |
| Reagent Consumption | 50 - 200 µl per step per slide | Generally higher than automated systems due to larger drop volumes. |
| Critical Step Timing | ± 1-2 minute tolerance | Over/under incubation in steps like antigen retrieval or primary Ab affects results. |
| Common Troubleshooting Rate | ~10-15% of runs | Includes issues like high background, weak signal, or uneven staining. |
Detailed Step-by-Step Protocol
This protocol details a standard avidin-biotin complex (ABC) method for formalin-fixed, paraffin-embedded (FFPE) tissue sections.
Protocol: Manual IHC Staining via ABC Method
Objective: To localize a specific target antigen (e.g., Estrogen Receptor) in a 4-5 µm FFPE tissue section.
I. Deparaffinization, Rehydration, and Antigen Retrieval
- Bake slides at 60°C for 20-60 minutes to melt paraffin.
- Deparaffinize: Immerse slides in fresh xylene (or xylene substitute), 3 changes, 5 minutes each.
- Rehydrate: Immerse slides in a graded ethanol series: 100% ethanol (2x, 2 min each), 95% ethanol (2 min), 70% ethanol (2 min). Rinse in distilled water (dH₂O).
- Antigen Retrieval:
- Heat-Induced Epitope Retrieval (HIER): Place slides in preheated citrate buffer (pH 6.0) or Tris-EDTA buffer (pH 9.0) in a decloaking chamber or pressure cooker. Heat as per buffer specification (e.g., 95-100°C for 20 min). Cool at room temperature for 30-60 minutes.
- Proteolytic-Induced Epitope Retrieval (PIER): Incubate with proteinase K or trypsin solution at 37°C for 5-15 minutes.
- Rinse slides in running dH₂O for 5 minutes.
II. Endogenous Enzyme Blocking and Protein Blocking
- Quench endogenous peroxidase by incubating with 3% hydrogen peroxide (H₂O₂) in methanol or aqueous solution for 10 minutes at room temperature (RT) in the dark.
- Wash slides in 1X Phosphate Buffered Saline (PBS), pH 7.4, 3 x 2 minutes on a shaker.
- Apply a protein block (e.g., 2.5-5% normal serum, or bovine serum albumin) for 20 minutes at RT to reduce non-specific binding. Blot excess (do not wash).
III. Primary and Secondary Antibody Incubation
- Apply primary antibody diluted in antibody diluent to cover the tissue section. Incubate in a humidified chamber for 60 minutes at RT or overnight at 4°C.
- Wash with 1X PBS, 3 x 2 minutes.
- Apply biotinylated secondary antibody (species-matched to primary) for 30 minutes at RT.
- Wash with 1X PBS, 3 x 2 minutes.
IV. Signal Detection and Counterstaining
- Prepare ABC reagent (avidin-biotinylated enzyme complex) per manufacturer's instructions 30 minutes prior to use.
- Apply ABC reagent to slides for 30 minutes at RT.
- Wash with 1X PBS, 3 x 2 minutes.
- Develop chromogen: Apply prepared 3,3’-Diaminobenzidine (DAB) substrate solution. Monitor development under a microscope (typically 30 seconds to 5 minutes). Stop reaction by immersing in dH₂O.
- Counterstain with Hematoxylin for 30-60 seconds. Rinse in tap water until water runs clear.
- Blue (optional): Dip in weak ammonia water or Scott's tap water substitute for a few seconds. Rinse.
V. Dehydration, Clearing, and Mounting
- Dehydrate: Immerse slides in 70% ethanol (30 sec), 95% ethanol (30 sec), 100% ethanol (2x, 1 min each).
- Clear: Immerse in xylene or xylene substitute, 3 changes, 2 minutes each.
- Mount with a permanent mounting medium and a glass coverslip.
Key Controls: Include a known positive tissue control, a negative control (primary antibody replaced with diluent or isotype control), and a system control (tissue with known ubiquitous antigen).
Visualization Diagrams
Diagram 1: Manual IHC Workflow (ABC Method)
Diagram 2: ABC Detection Principle
The Scientist's Toolkit: Key Research Reagent Solutions
Table 2: Essential Reagents for Manual IHC
| Reagent / Material | Function / Purpose | Key Consideration |
|---|---|---|
| FFPE Tissue Sections | The biological sample mounted on charged slides. | Section thickness (4-5 µm) and adhesion are critical. |
| Antigen Retrieval Buffer (Citrate pH 6.0, Tris-EDTA pH 9.0) | Reverses formaldehyde-induced cross-links, exposing epitopes. | pH and heating method must be optimized for each target. |
| Primary Antibody | Binds specifically to the target antigen. | Clone, species, dilution, and incubation time are primary variables. |
| Species-Matched Biotinylated Secondary Antibody | Links the primary antibody to the ABC complex. | Must be raised against the host species of the primary antibody. |
| ABC Kit (Avidin/Biotinylated Enzyme Complex) | Amplifies signal. Avidin binds biotin on secondary; enzyme produces chromogen. | Must be prepared in advance and used fresh. |
| Chromogen Substrate (e.g., DAB) | Enzymatic conversion produces an insoluble, visible precipitate at the antigen site. | Concentration and development time control signal intensity and background. |
| Counterstain (Hematoxylin) | Provides contrast by staining cell nuclei. | Differentiation (bluing) step is crucial for clear nuclear detail. |
| Mounting Medium | Preserves the stain and provides optical clarity for microscopy. | Use permanent, non-aqueous medium for DAB-stained slides. |
| Humidified Chamber | Prevents evaporation of small antibody volumes during incubations. | Essential for consistent results across the tissue section. |
Automated Immunohistochemistry (IHC) staining is defined as the execution of all critical steps in the IHC protocol—baking, deparaffinization, rehydration, antigen retrieval, endogenous enzyme blocking, primary/secondary antibody incubation, detection, counterstaining, dehydration, clearing, and coverslipping—by a programmable, integrated mechanical platform. This platform-based automation is engineered to replace manual, hands-on techniques, operating on core principles of precision, reproducibility, standardization, and walk-away time for the operator.
The fundamental principles of these platforms include:
- Fluidic Control: Precise dispensing, mixing, and aspiration of reagents via pipetting systems or capillary flow.
- Environmental Control: Regulation of incubation temperature and time, with some systems offering onboard heating for steps like antigen retrieval.
- Spatial Addressing: Robotic control to apply reagents to specific slides in a defined order.
- Software-Driven Protocol Management: User-defined, locked protocols that dictate reagent volume, sequence, timing, and temperature.
- Batch Processing: Simultaneous, identical processing of multiple slides (from 12 to over 100 per run, depending on the platform).
Key Metrics: Manual vs. Automated Staining
The adoption of automated IHC is driven by quantitative improvements in key performance metrics, as summarized below.
Table 1: Comparative Metrics of Manual vs. Automated IHC Staining
| Metric | Manual IHC | Automated IHC (Platform-Based) | Data Source & Notes |
|---|---|---|---|
| Inter-slide Reproducibility (CV%) | 15-35% | 5-15% | CV measured on H-Score/DAB intensity; automation reduces technician-dependent variables. |
| Intra-assay Precision | Low to Moderate | High | Automated systems show near-identical staining patterns across slides in the same batch. |
| Average Hands-On Time | 4-6 hours (for 40 slides) | 1-2 hours (for 40 slides) | Includes setup, reagent prep, and loading. Automation significantly reduces active labor. |
| Sample Processing Capacity | 10-50 slides/day/technician | 40-200+ slides/day/system | Throughput is linear with platform capacity; 24/7 operation possible. |
| Reagent Consumption | Typically higher (over-dispensing) | Optimized and consistent (10-30% savings) | Precision dispensing reduces waste of expensive antibodies. |
| Protocol Changeover Time | Minutes (manual reagent swap) | Variable (cartridge/system dependent) | Systems with onboard reagent databases enable rapid protocol selection. |
| Error Rate (due to technique) | Higher | Significantly Lower | Elimination of steps like accidental slide drying or incorrect incubation times. |
Detailed Protocol for Automated IHC Staining
This protocol is generalized for a typical, open-platform automated stainer with onboard heat and fluidics.
Application Note: Automated IHC Protocol for Phospho-ERK (p44/42 MAPK) Detection in FFPE Tissue Sections
A. Pre-Staining Preparation (Manual Steps)
- Slide Preparation: Cut 4-μm FFPE sections onto charged slides. Bake at 60°C for 60 minutes.
- Reagent Preparation: Dilute primary antibody (e.g., Anti-Phospho-p44/42 MAPK [Erk1/2]) and detection system components per manufacturer's instructions in the recommended buffer.
- Instrument Loading: Load prepared reagents into designated, barcoded positions on the stainer's reagent rack. Place slides into the slide carousel.
- Protocol Selection: On the touchscreen interface, select the validated protocol (e.g., "pERK15minHRP"). Verify the reagent-to-slide mapping.
B. Automated Staining Sequence (Platform-Executed) The following workflow is programmed into the stainer and executed without intervention.
Diagram Title: Automated IHC Staining Workflow
C. Post-Staining (Manual Steps)
- Unloading: Remove slides from the stainer.
- Coverslipping: If not performed onboard, manually apply mounting medium and a glass coverslip.
- Imaging & Analysis: Use a brightfield whole-slide scanner and image analysis software for quantitative assessment (e.g., DAB pixel intensity per nuclei).
The Scientist's Toolkit: Key Research Reagent Solutions
Table 2: Essential Materials for Automated IHC
| Item | Function in Automated IHC | Key Consideration for Automation |
|---|---|---|
| Open Detection System (e.g., Polymer-based HRP) | A two-step or polymer-based detection kit compatible with multiple antibody clones and automatable buffer systems. | Must be validated for use on the specific platform; viscosity affects fluidics. |
| Validated Primary Antibodies | Target-specific monoclonal or polyclonal antibodies. | Opt for clones with known performance in automated, retrieval-dependent protocols. |
| Automation Buffer | A universal diluent for antibodies and detection reagents. | Provides consistent pH and stability over long, unattended runs. |
| Onboard Antigen Retrieval Solution | EDTA or Citrate-based pH buffer for epitope unmasking. | Must be stable at room temperature on the instrument for weeks. |
| Stable Chromogen (e.g., DAB) | Enzyme substrate producing an insoluble, stable brown precipitate. | Liquid, ready-to-use formulations prevent precipitation in fluidic lines. |
| Automation-Compatible Counterstain | Hematoxylin formulation resistant to crystallization. | Prevents clogging of dispensing nozzles. |
The MAPK/ERK Pathway: A Common IHC Target
The Ras/Raf/MEK/ERK pathway is frequently analyzed via IHC in cancer research. Automated platforms standardize the detection of key nodes like phosphorylated ERK (pERK).
Diagram Title: MAPK/ERK Signaling Pathway
Application Notes
Biomarker Discovery
Immunohistochemistry (IHC) is a cornerstone technique for biomarker discovery, enabling the spatial localization and quantification of protein expression in intact tissue architecture. In manual vs. automated staining method comparisons, consistency and reproducibility are critical for identifying robust biomarkers. Manual staining allows for expert-driven protocol optimization for novel targets but introduces inter-operator variability. Automated platforms standardize the staining process, reducing variability and facilitating high-throughput screening of tissue microarrays (TMAs), which is essential for large-scale biomarker validation studies. The choice of method directly impacts the sensitivity and specificity of the discovered biomarker.
Target Validation
IHC is indispensable for target validation, confirming the presence, localization, and relative expression of a putative drug target in diseased versus normal tissues. Comparative studies between manual and automated methods assess which provides more reliable and quantitative data for decision-making. Automated systems offer superior reproducibility for longitudinal studies and multi-site validation campaigns, ensuring that staining intensity and patterns are comparable across hundreds of samples. This reproducibility is vital for establishing the therapeutic window and justifying progression into drug development.
Toxicity Assessment
In preclinical toxicity assessment, IHC is used to evaluate off-target effects and organ-specific toxicity by detecting markers of cellular stress, apoptosis, or specific organ injury. The comparison of staining methods focuses on accuracy and detection thresholds. Automated IHC minimizes technical artifacts, providing clearer, more consistent data for distinguishing true toxicological signals from background staining. This consistency is crucial for regulatory submissions, where data integrity is paramount.
Experimental Protocols
Protocol: Comparative IHC Staining for Biomarker Quantification
Objective: To compare the performance of manual and automated IHC staining for a candidate biomarker (e.g., PD-L1) in non-small cell lung carcinoma (NSCLC) tissue microarrays. Materials:
- Formalin-fixed, paraffin-embedded (FFPE) NSCLC TMA block (50 cores, with paired tumor/normal).
- Primary antibody: Anti-PD-L1 (Clone 22C3).
- Detection System: HRP-labeled polymer system.
- Chromogen: 3,3'-Diaminobenzidine (DAB).
- Automated Stainer: e.g., Ventana BenchMark ULTRA.
- Manual staining equipment: Humidity chamber, slide racks, coplin jars.
Methodology:
- Sectioning: Cut 4 µm sections from TMA block onto charged slides. Bake at 60°C for 1 hour.
- Deparaffinization & Antigen Retrieval: For both methods, use identical conditions: Heat-induced epitope retrieval (HIER) with EDTA buffer (pH 9.0) at 97°C for 20 minutes.
- Peroxidase Blocking: Apply 3% H₂O₂ for 10 minutes at room temperature (RT).
- Primary Antibody Incubation:
- Automated: Load slides and reagents onto instrument. Program protocol: Anti-PD-L1 (1:50 dilution), 32 minutes at 37°C.
- Manual: Apply 100 µL of primary antibody (1:50 dilution) to each slide. Incubate in humidity chamber for 32 minutes at 37°C.
- Detection: Apply polymer-HRP conjugate for 20 minutes at RT.
- Visualization: Apply DAB chromogen for 5 minutes. Counterstain with hematoxylin.
- Scoring: Digitize slides. Use image analysis software to calculate the Tumor Proportion Score (TPS) for each core. Two blinded pathologists will also provide manual scores.
Protocol: Target Validation via Co-localization Analysis
Objective: To validate target expression and cellular co-localization in tumor stroma using manual and automated double IHC. Materials:
- FFPE colon cancer sections.
- Primary Antibodies: Anti-αSMA (smooth muscle actin) and Anti-FAP (fibroblast activation protein).
- Detection: Alkaline Phosphatase (AP) and HRP-based detection kits with distinct chromogens (Fast Red and DAB).
Methodology:
- Perform single IHC for each target on serial sections using both manual and automated methods (as per Protocol 2.1) to optimize individually.
- Sequential Double Staining Protocol (Manual):
- Complete first stain (αSMA, DAB) through to dehydration.
- Return slide to xylene and ethanol series to water.
- Perform HIER again.
- Apply second primary antibody (FAP) and detect with AP/Fast Red.
- Sequential Double Staining (Automated): Use instrument's built-in sequential IHC protocol with an antibody denaturation step between rounds.
- Analysis: Assess co-localization (% of αSMA+ cells also expressing FAP) using multiplex image analysis software. Compare consistency between methods.
Protocol: Toxicity Biomarker Assessment in Preclinical Liver
Objective: To compare detection sensitivity for a low-abundance toxicity biomarker (e.g., Cleaved Caspase-3) in rodent liver tissue. Materials:
- FFPE liver sections from a 28-day rodent toxicity study.
- Primary antibody: Anti-Cleaved Caspase-3 (Asp175).
- Signal Amplification Kit: Tyramide Signal Amplification (TSA).
Methodology:
- Follow standard deparaffinization and HIER steps.
- Manual Staining with Amplification: After primary antibody, apply HRP polymer, then incubate with tyramide-fluorophore (e.g., FITC) for 10 minutes. This step is sensitive to timing.
- Automated Staining with Amplification: Program the automated stainer to perform the TSA step with precise, consistent incubation times.
- Quantification: Use fluorescence scanning and automated cell counting to determine the number of Cleaved Caspase-3 positive hepatocytes per mm². Compare signal-to-noise ratio between methods.
Data Presentation
Table 1: Comparison of Key Metrics in Manual vs. Automated IHC Staining
| Metric | Manual IHC | Automated IHC | Implication for Application |
|---|---|---|---|
| Inter-Slide Coefficient of Variation (CV) | 15-25% | 5-10% | Biomarker Discovery: Lower CV improves statistical power for identifying significant expression differences. |
| Throughput (Slides per 8-hour shift) | 40-60 | 150-300 | High-Throughput Screening: Essential for profiling large TMAs in biomarker discovery and validation. |
| Reagent Consumption per Test | ~100 µL | ~50 µL | Cost in Long Studies: Automated systems reduce reagent use, significant for large-scale target validation. |
| Optimal Result Achievement Rate | ~85% (operator-dependent) | ~98% | Toxicity Assessment: Maximizes reliability of low-signal detection for critical safety data. |
| Protocol Reproducibility Across Sites | Low to Moderate | High | Multi-Center Validation: Automated protocols standardize staining for regulatory-grade target validation. |
| Suitability for Complex Protocols (e.g., Multiplex) | Moderate (requires high skill) | High (programmable) | Complex Phenotyping: Enables sophisticated co-localization studies for mechanistic toxicity or resistance. |
Diagrams
IHC Staining Workflow Comparison
IHC Core Applications in Drug Development
The Scientist's Toolkit: Research Reagent Solutions
Table 2: Essential Materials for Comparative IHC Studies
| Item | Function/Benefit | Example in Protocol |
|---|---|---|
| FFPE Tissue Microarray (TMA) | Provides hundreds of tissue cores on one slide for high-throughput, controlled comparative analysis. | NSCLC TMA for PD-L1 biomarker discovery. |
| Validated Primary Antibodies | Antibodies with published IHC-specific validation ensure target specificity, critical for both methods. | Anti-PD-L1 (Clone 22C3) for companion diagnostic comparison. |
| Polymer-Based Detection System | High-sensitivity, low-background detection system compatible with both manual and automated platforms. | HRP-labeled polymer used in Protocol 2.1. |
| Chromogen (DAB) | Forms an insoluble brown precipitate at the antigen site. Standard for brightfield IHC quantification. | Used for visualization in all protocols. |
| Automated IHC Stainer | Provides precise control over incubation times, temperatures, and reagent application, standardizing the process. | Ventana BenchMark ULTRA for automated arm of studies. |
| Automated Slide Scanner | Digitizes whole slides for quantitative image analysis, removing observer bias from scoring. | Used for generating data for Table 1 metrics. |
| Image Analysis Software | Quantifies staining intensity and percentage of positive cells (H-Score, TPS) objectively. | Essential for scoring Protocol 2.1 and 2.3. |
| Tyramide Signal Amplification (TSA) Kits | Amplifies weak signals, crucial for detecting low-abundance targets in toxicity studies. | Used in Protocol 2.3 for Cleaved Caspase-3. |
| Multiplex IHC Detection Kits | Allows labeling of multiple targets on one slide with different chromogens/fluorophores. | Enables co-localization studies in Protocol 2.2. |
Within the comparative analysis of manual versus automated immunohistochemistry (IHC) staining, the performance, stability, and appropriate application of critical reagents are paramount. Both methodologies rely on the same fundamental components—primary antibodies, detection systems, and chromogens—yet their optimal use and vulnerability to variability differ significantly between manual and automated platforms. This application note provides detailed protocols and a comparative analysis of these core reagents, framed within a rigorous research thesis comparing staining methods.
Critical Reagents: Comparative Analysis
Primary Antibodies
The specificity of the primary antibody is the cornerstone of any IHC assay. Performance is influenced by clone, host species, conjugation, and recommended dilution, which must be validated for each staining platform.
Table 1: Primary Antibody Performance in Manual vs. Automated IHC
| Parameter | Manual IHC | Automated IHC | Notes |
|---|---|---|---|
| Typical Working Dilution Range | 1:50 - 1:500 | 1:100 - 1:1000 | Automated systems often permit higher dilutions due to reduced reagent consumption and consistent application. |
| Vulnerability to Variation | High (user-dependent) | Low (system-defined) | Manual titration and application introduce variability. |
| Optimal Incubation Time | 30-60 mins, RT or O/N at 4°C | 20-32 mins, 37°C | Automated systems use warmer, shorter incubations for throughput. |
| Recommended Antibody Formulation | With carrier protein (e.g., BSA) | Preservative-stabilized, low-protein | Automated systems require reagents stable over many dispensing cycles. |
Detection Systems
Detection systems amplify the primary antibody signal. The choice between polymer-based, streptavidin-biotin (LSAB), or tyramide signal amplification (TSA) systems impacts sensitivity, background, and multiplexing potential.
Table 2: Detection System Efficiency Comparison
| System Type | Sensitivity | Background Risk | Suitability for Manual IHC | Suitability for Automated IHC |
|---|---|---|---|---|
| Standard Polymer (HRP/AP) | Moderate-High | Low | Excellent (Flexible) | Excellent (Primary choice for most platforms) |
| Streptavidin-Biotin (LSAB) | High | Medium (Endogenous biotin) | Good | Good (Require careful blocking) |
| Polymer w/ Tyramide (TSA) | Very High | Medium-High (Optimization critical) | Possible (Complex) | Preferred (Precision enhances reproducibility) |
| Two-Step Indirect (Labeled Secondary) | Low-Moderate | Low | Common for IF | Less Common |
Chromogens
Chromogens produce the visible precipitate at the antigen site. The choice between 3,3’-Diaminobenzidine (DAB), Fast Red, and others depends on the detection enzyme (HRP or AP), required contrast, and compatibility with counterstains and mounting media.
Table 3: Chromogen Properties and Application
| Chromogen | Enzyme | Color | Solubility | Compatibility (Automation) | Key Consideration |
|---|---|---|---|---|---|
| DAB | HRP | Brown | Alcohol-insoluble | Excellent | Potential carcinogen; requires controlled waste handling. |
| Fast Red | AP | Red | Alcohol-soluble | Good (Aqueous mounting) | Requires aqueous mounting medium. |
| Vector VIP | HRP | Purple | Alcohol-insoluble | Excellent | Good for multiplexing. |
| AEC | HRP | Red | Alcohol-soluble | Poor (Requires aqueous mount) | Not recommended for automated platforms due to solubility. |
Detailed Experimental Protocols
Protocol 1: Validation of a New Primary Antibody on Manual and Automated Platforms
Objective: To determine the optimal dilution and incubation conditions for a novel anti-PD-L1 rabbit monoclonal antibody on both manual (bench) and automated (Ventana Benchmark Ultra) systems.
Materials: See "The Scientist's Toolkit" below. Method:
- Section Preparation: Cut 4μm sections from FFPE human tonsil control tissue. Bake at 60°C for 30 minutes.
- Deparaffinization & Antigen Retrieval:
- Manual: Deparaffinize in xylene (3x 5 min), rehydrate in graded ethanol. Perform heat-induced epitope retrieval (HIER) in 1x EDTA buffer, pH 9.0, in a decloaking chamber at 95°C for 20 min. Cool for 30 min.
- Automated: Load slides onto the BenchMark Ultra. Select "Deparaffinization" and "Cell Conditioning 1" (EDTA-based, 95°C, 36 min) protocols.
- Primary Antibody Staining:
- Manual: Apply hydrogen peroxide block (10 min). Apply protein block (10 min). Apply primary antibody at dilutions 1:100, 1:200, 1:500, 1:1000 in antibody diluent. Incubate in a humidified chamber for 60 min at RT.
- Automated: Program the run. Apply primary antibody dilutions (same range) via the instrument's dispenser. Incubate at 37°C for 32 min.
- Detection & Visualization:
- Manual: Apply labeled polymer-HRP anti-rabbit secondary (30 min). Apply DAB chromogen (5 min). Rinse.
- Automated: The instrument applies OmniMap anti-Rabbit HRP (12 min) followed by ChromoMap DAB (8 min).
- Counterstaining & Mounting:
- Manual: Counterstain with hematoxylin (1 min), blue in Scott's solution, dehydrate, clear, and mount with permanent media.
- Automated: The instrument applies hematoxylin II (8 min) and bluing reagent (4 min). Automatically coverslip.
- Analysis: Score slides for intensity (0-3+) and background. The dilution yielding optimal signal-to-noise on each platform is defined as the optimal concentration.
Protocol 2: Comparison of Detection System Sensitivity
Objective: To compare the signal amplification of a standard polymer system versus a tyramide-based system (TSA) for a low-abundance target (pSTAT3) on an automated platform.
Method:
- Use consecutive FFPE carcinoma sections.
- Perform standard deparaffinization and retrieval on the automated system.
- Arm A (Standard Polymer): Apply primary antibody → OmniMap anti-Rabbit HRP → DAB.
- Arm B (TSA): Apply primary antibody → Horseradish Peroxidase (HRP)-conjugated secondary → apply fluorescent tyramide (Cy3) → apply anti-fluorescent antibody conjugated to HRP → DAB.
- All steps are executed on the automated system using pre-programmed protocols to ensure identical timing and conditions.
- Quantify stain intensity using image analysis software (H-score). The TSA system is expected to yield a significantly higher H-score for the same antigen concentration.
Visualization: Core IHC Detection Pathways
IHC Signal Generation Pathway
Manual vs Automated IHC Workflow Comparison
The Scientist's Toolkit: Key Research Reagent Solutions
| Item | Function & Relevance to Comparison |
|---|---|
| FFPE Tissue Microarray (TMA) | Contains multiple tissue types/controls on one slide, enabling simultaneous staining of all test samples under identical conditions for robust platform comparison. |
| Validated Positive Control Slides | Essential for daily validation of both manual and automated assay performance. Critical for troubleshooting. |
| Stable, Platform-Specific Antibody Diluent | Manual: Often contains BSA. Automated: Requires low-protein, chemically defined diluents compatible with instrument fluidics and longer on-board stability. |
| Polymer-Based Detection Kits (HRP) | The current standard for both methods. Offer high sensitivity with low background. Pre-optimized kits for automated systems reduce variability. |
| DAB Chromogen Kits (Liquid) | Ready-to-use, stable liquid DAB formulations are preferred for automation, ensuring consistent concentration and reducing precipitate deposition in lines. |
| Automated Platform Reagent Kits | Proprietary detection kits (e.g., Ventana OptiView, UltraView) engineered for specific instrument parameters, offering maximal reproducibility. |
| Hematoxylin Counterstain | Must be compatible with the mounting method (alcohol-soluble vs. insoluble chromogens). Automated systems use specific formulations for consistent nuclear staining. |
| Aqueous & Permanent Mounting Media | Choice depends on chromogen solubility. Critical for preserving stain and enabling high-resolution microscopy for quantitative analysis. |
Step-by-Step Protocols and Strategic Application in the Lab
Article Context
This protocol is presented within a comparative research thesis evaluating the precision, cost, flexibility, and reproducibility of manual versus automated immunohistochemistry (IHC) staining methods for translational research and drug development.
Manual IHC remains a critical technique for biomarker validation and pathological assessment in preclinical and clinical research. While automated platforms offer standardization, the manual method provides researchers with unparalleled control over individual steps, crucial for antibody optimization and troubleshooting novel targets. This detailed workflow is designed to ensure reproducibility in a research setting.
Detailed Protocols
Protocol: Slide Preparation and Deparaffinization
Objective: To prepare formalin-fixed, paraffin-embedded (FFPE) tissue sections for antigen retrieval while preserving tissue architecture. Materials: See "The Scientist's Toolkit" (Section 5). Methodology:
- Bake slides at 60°C for 60 minutes to melt paraffin and improve adhesion.
- Deparaffinize in three changes of xylene or xylene substitute, 5 minutes each.
- Rehydrate through a graded ethanol series: 100% ethanol (two changes, 3 min each), 95% ethanol (3 min), 70% ethanol (3 min).
- Rinse in distilled water (dH₂O) for 5 minutes.
- Perform antigen retrieval (see next protocol).
Protocol: Heat-Induced Epitope Retrieval (HIER)
Objective: To reverse formaldehyde-induced cross-links and expose antigenic sites. Methodology:
- Fill a heat-resistant container with antigen retrieval buffer (e.g., Tris-EDTA, pH 9.0, or citrate, pH 6.0).
- Place slides in a slide rack and submerge in buffer.
- Heat using a pressure cooker, steamer, or microwave until the buffer reaches 95-100°C.
- Pressure Cooker: Heat until full pressure is achieved, maintain for 2-10 minutes.
- Steamer: Maintain at 95-100°C for 20-30 minutes.
- Microwave: Heat at full power until boiling, then at 20% power to maintain a simmer for 15-20 minutes.
- Cool slides in the buffer at room temperature for 30 minutes.
- Rinse in dH₂O and transfer to wash buffer (e.g., Tris-buffered saline with Tween 20, TBST).
Protocol: Manual Staining via the Peroxidase-Based Method
Objective: To specifically localize target antigen using a chromogenic detection system. Methodology:
- Peroxidase Blocking: Incubate slides with 3% hydrogen peroxide solution for 10 minutes to quench endogenous peroxidase activity. Rinse with wash buffer.
- Protein Blocking: Apply a protein-based blocking serum (normal serum from the species of the secondary antibody) for 20 minutes at room temperature to reduce non-specific binding.
- Primary Antibody Incubation: Tap off excess block. Apply optimized dilution of primary antibody in antibody diluent. Incubate in a humidified chamber for 60 minutes at room temperature or overnight at 4°C. Rinse with wash buffer (3 x 5 min).
- Secondary Antibody Incubation: Apply enzyme-conjugated secondary antibody (e.g., HRP-labeled polymer) for 30 minutes. Rinse with wash buffer (3 x 5 min).
- Chromogen Development: Prepare DAB (3,3'-Diaminobenzidine) substrate according to manufacturer's instructions. Apply to tissue and monitor development under a microscope (typically 2-10 minutes). Stop reaction by immersing slides in dH₂O.
- Proceed to counterstaining.
Protocol: Counterstaining, Dehydration, and Mounting
Objective: To provide histological context and prepare slides for permanent imaging. Methodology:
- Counterstain: Immerse slides in Mayer's Hematoxylin for 30-60 seconds.
- Bluing: Rinse in tap water or a bluing solution (e.g., 0.1% ammonia water) for 1 minute to achieve a blue nuclear stain.
- Dehydration: Dehydrate quickly through 70% ethanol (30 sec), 95% ethanol (30 sec), and 100% ethanol (two changes, 1 min each).
- Clearing: Clear in xylene or xylene substitute (two changes, 3 minutes each).
- Mounting: Apply a drop of permanent mounting medium (e.g., synthetic resin) and gently lower a coverslip, avoiding bubbles.
Data Presentation: Key Performance Metrics in Manual IHC
Table 1: Quantitative Comparison of Manual vs. Automated IHC in Research Settings
| Parameter | Typical Manual IHC Performance | Typical Automated IHC Performance | Significance for Research |
|---|---|---|---|
| Protocol Flexibility | High (easy to modify times, temps, reagents) | Low to Moderate (limited by platform) | Manual is superior for novel antibody/assay development. |
| Reagent Consumption | Variable, often higher per slide | Optimized, typically lower per slide | Automated offers cost savings for high-throughput, validated assays. |
| Hands-on Time | 3-5 hours for 40 slides | ~30 minutes for 40 slides | Automated frees up technician time for analysis. |
| Inter-operator Variability (CV) | 15-25% | 5-10% | Automated provides superior reproducibility for multi-operator studies. |
| Assay Development Speed | Faster iteration (steps can be adjusted immediately) | Slower iteration (programming required) | Manual allows for rapid troubleshooting and optimization. |
| Upfront Cost | Low (basic equipment) | Very High (instrument purchase) | Manual is accessible for individual labs or low-budget projects. |
Table 2: Optimization Ranges for Critical Manual IHC Steps
| Step | Typical Duration Range | Temperature Range | Key Optimization Variable |
|---|---|---|---|
| Antigen Retrieval | 2-30 minutes at temp | 95-125°C | Buffer pH (6.0 vs 9.0) is often more critical than time. |
| Primary Antibody Incubation | 60 min - Overnight | RT (20-25°C) or 4°C | Concentration is titrated; longer time at lower temp can increase signal. |
| DAB Development | 2-10 minutes | RT (20-25°C) | Microscopic monitoring is essential to prevent over-staining. |
Visualized Workflows and Pathways
Diagram 1: Manual IHC Core Workflow
Diagram 2: IHC Detection Signaling Pathway
The Scientist's Toolkit: Essential Reagents & Materials
Table 3: Key Research Reagent Solutions for Manual IHC
| Item | Function & Research Application |
|---|---|
| Poly-L-Lysine or POS Coated Slides | Provides electrostatic adhesion for tissue sections, preventing detachment during rigorous retrieval and staining steps. |
| pH 6.0 Citrate & pH 9.0 Tris-EDTA Retrieval Buffers | Different target antigens require different pH conditions for optimal unmasking. Having both is essential for assay development. |
| Normal Serum (e.g., Goat, Donkey) | Used for protein blocking. Must match the host species of the secondary antibody to effectively reduce non-specific background. |
| Antibody Diluent with Protein Stabilizer | Preserves primary antibody activity during incubation and allows for consistent, reproducible dilutions across experiments. |
| HRP-Labeled Polymer Secondary (e.g., anti-rabbit/mouse) | Amplifies signal by carrying multiple enzyme molecules per antibody. Reduces non-specific staining vs. traditional streptavidin-biotin. |
| Liquid DAB+ Chromogen Substrate Kit | Produces a stable, insoluble brown precipitate at the antigen site. Safer and more consistent than preparing DAB from powder. |
| Mayer's Hematoxylin | A progressive nuclear counterstain that does not require differentiation, simplifying standardization. |
| Aqueous & Permanent Mounting Media | Aqueous for fluorescent/IHC with fluorophores; permanent (synthetic resin) for DAB-stained slides for long-term archival. |
Within the broader thesis comparing manual versus automated immunohistochemistry (IHC) staining methods, the implementation of an automated stainer represents a critical paradigm shift. This document provides detailed application notes and protocols for operating an automated IHC stainer, focusing on platform setup, run parameter optimization, and the resulting "walkaway time" that enables researcher efficiency and reproducibility in drug development and research settings.
Platform Setup and Initialization
Pre-Run Checklist and Reagent Preparation
A systematic setup is fundamental for successful automated runs. The following table outlines the essential preparatory steps and their purposes.
Table 1: Pre-Run Setup Checklist for Automated IHC Stainer
| Step | Procedure | Purpose & Rationale |
|---|---|---|
| 1. Power & System Check | Turn on instrument and computer. Allow system to initialize and perform self-diagnostics. | Ensures all electronic and mechanical components are operational before run commencement. |
| 2. Reagent Inventory | Load all primary antibodies, detection kits, buffers (wash, retrieval), and counterstains into designated, temperature-controlled stations. Verify volumes and expiration dates. | Prevents run failures due to reagent depletion or degradation. Maintains reagent integrity. |
| 3. Slide/Rack Loading | Securely place deparaffinized, antigen-retrieved, and blocked tissue sections onto the stainer's slide rack. Ensure correct orientation. | Proper loading is critical for consistent reagent coverage and preventing slide loss during the run. |
| 4. Protocol Selection/Upload | Select pre-validated protocol or upload a new method file specifying all incubation times, temperatures, and wash steps. | Directs the robotic fluidics and incubation system. Protocol accuracy is paramount for staining specificity. |
| 5. Waste Container Check | Ensure waste containers are empty and properly seated. | Prevents overflow and potential biohazard or system error during the run. |
| 6. Final Verification | Review all settings on the software interface before initiating the run. Confirm slide ID mapping. | Final error catch to prevent costly mistakes in reagent use and slide processing. |
The Scientist's Toolkit: Key Research Reagent Solutions
Table 2: Essential Reagents for Automated IHC Staining
| Reagent Category | Specific Example(s) | Function in Automated IHC |
|---|---|---|
| Epitope Retrieval Buffers | EDTA-based (pH 9.0) or Citrate-based (pH 6.0) buffers | Reverses formaldehyde-induced cross-links, exposing target epitopes for antibody binding. Choice depends on target antigen. |
| Blocking Solutions | Normal serum (e.g., from species of detection antibody), Protein Block, BSA | Reduces non-specific background staining by occupying sites of hydrophobic or charged interactions. |
| Primary Antibodies | Monoclonal anti-Ki-67, Polyclonal anti-p53, anti-PD-L1 clones | Specifically bind to the target antigen of interest. Must be validated for concentration and incubation time on the automated platform. |
| Detection Systems | Polymer-based HRP or AP systems (e.g., DAB/HRP polymer) | Amplifies the primary antibody signal and provides a visual (chromogenic) or fluorescent output. Essential for sensitivity. |
| Chromogens | 3,3'-Diaminobenzidine (DAB), Fast Red, AEC | Enzymatic substrate that produces a colored precipitate at the site of antibody binding. DAB is most common for brightfield IHC. |
| Counterstains | Hematoxylin, Methyl Green | Provides contrast by staining cell nuclei, allowing for morphological assessment. |
| Mounting Media | Aqueous, permanent (e.g., resinous), or anti-fade media | Preserves the stained slide under a coverslip for microscopic analysis. Choice depends on chromogen (aqueous vs. organic). |
Configuring Run Parameters: A Comparative Analysis
Optimal run parameters are derived from manual protocol translation and subsequent optimization for fluidics, timing, and temperature control on the automated platform.
Table 3: Comparison of Key Parameters: Manual vs. Automated IHC
| Parameter | Typical Manual IHC Protocol | Automated IHC Protocol Adaptation | Impact on Results & Walkaway Time |
|---|---|---|---|
| Primary Antibody Incubation | 60 min, room temp, in humid chamber. | 32 min, 37°C, on heated stage. | Reduced time. Increased temperature accelerates kinetics. Requires validation for equivalent signal. |
| Detection System Incubation | 30 min, room temp. | 16-20 min, 37°C. | Reduced time. Polymer-based systems are optimized for faster binding at controlled temperature. |
| Wash Steps | Manual dunking in Coplin jars (3x changes). | Programmed, pressurized spray or dip-and-dunk (6-8 cycles). | Increased consistency. Automated washes are more thorough and reproducible, reducing background. |
| Total Hands-On Time | 2.5 - 3.5 hours (intermittent attention). | 0.5 hours (for setup and loading only). | Major reduction. Defines the "walkaway" advantage. |
| Total Protocol Duration | ~4-6 hours (varies with user). | 2 - 3.5 hours (precise and consistent). | Predictable completion. Enables batch scheduling and downstream planning. |
| Inter-User Variability | High (timing, washing technique). | Negligible (robotically precise). | Enhanced reproducibility. Critical for multi-site drug development studies. |
Detailed Protocol: Optimizing an Automated IHC Run for a Novel Biomarker
Objective: To establish a validated protocol for detecting Phospho-STAT3 (Tyr705) on an automated IHC stainer (e.g., Ventana Benchmark, Leica BOND, or Agilent/Dako Omnis).
Materials:
- Automated IHC stainer and its proprietary reagents.
- FFPE tissue sections of known positive and negative control tissues.
- Anti-Phospho-STAT3 (Tyr705) rabbit monoclonal antibody.
- Compatible detection kit (e.g., HRP Multimer-based system).
- EDTA-based epitope retrieval buffer (pH 9.0).
Methodology:
- Slide Preparation: Bake slides at 60°C for 20 min. Deparaffinize and perform epitope retrieval using the instrument's standard deparaffinization and high-temperature retrieval cycle (e.g., 95°C for 32 min in EDTA buffer).
- Instrument Loading: Load slides onto the rack. Place the primary antibody (diluted in instrument-compatible antibody diluent), detection kit components, wash buffer, and counterstain into assigned positions.
- Protocol Programming: Create a new method or edit an existing one:
- Step 1: Inhibit endogenous peroxidase (4 min, 37°C).
- Step 2: Apply protein block (8 min, 37°C).
- Step 3: Apply primary antibody. Optimization Note: Start with manufacturer's recommended dilution and a 32-minute incubation at 37°C. Titrate (e.g., 1:50, 1:100, 1:200) in subsequent runs to optimize signal-to-noise.
- Step 4: Apply HRP-labeled polymer detection system (16 min, 37°C).
- Step 5: Apply chromogen (DAB, 8 minutes with periodic application).
- Step 6: Apply hematoxylin counterstain (8 min).
- Step 7: Apply post-counterstain wash and liquid coverslip.
- Run Initiation & Walkaway: Start the run. The total hands-on time is complete (~20-30 min). The researcher has a "walkaway time" of approximately 3 hours before the run completes and slides require manual coverslipping.
- Validation: Assess stained controls. Optimal dilution yields strong, specific nuclear staining in positive controls with minimal background in negative controls.
Quantifying the "Walkaway Time" Advantage
"Walkaway time" is the period during which the instrument operates unattended, freeing the researcher for other tasks. This is the most significant operational advantage over manual staining.
Table 4: Breakdown of Time Investment in Automated IHC
| Phase | Estimated Time (Minutes) | Researcher Action Required |
|---|---|---|
| Pre-Analytical (Slide Prep) | 60-90 (offline) | Yes - Baking, deparaffinization, retrieval (can be automated separately). |
| Instrument Setup & Loading | 20-30 | Yes - Active hands-on period. |
| Automated Staining Run | 120-210 | No - "Walkaway Time." |
| Post-Run (Coverslipping) | 15-30 | Yes - Manual or automated. |
| Total Hands-On Time | ~35-60 | |
| Total Process Time | ~200-330 |
Visualizing Workflows and Pathways
Title: Automated IHC Staining Workflow and Walkaway Time
Title: Polymer-Based Detection Signal Amplification Pathway
Application Notes: Strategic Framework for IHC Method Selection
In the context of comparative research on manual versus automated immunohistochemistry (IHC) staining methods, the selection of an appropriate protocol is not arbitrary. The decision must be a strategic alignment of the chosen technique with three core project dimensions: Scale, Complexity, and Available Resources. The following notes provide a structured framework for this decision-making process.
Project Scale refers to the number of samples, slides, or tissue microarrays (TMAs) to be processed within a given timeframe. High-throughput studies demand consistency and speed, while small-scale pilot or validation studies may prioritize flexibility.
Project Complexity encompasses variables such as antigen rarity, required multiplexing, antibody validation requirements, and the necessity for specialized detection systems (e.g., tyramide signal amplification). Complex protocols often require precise, repeatable handling that challenges manual execution.
Available Resources include financial budget for equipment and reagents, laboratory personnel expertise and time, infrastructure (e.g., fume hoods, dedicated space), and the critical factor of turnaround time.
Core Decision Logic: For large-scale, routine, or standardized staining protocols, automation offers superior reproducibility and efficiency. For exploratory research, highly complex multiplexing, or when working with limited or precious samples, manual methods provide essential flexibility and control. The breakeven point is influenced by the local cost of skilled labor versus the capital and maintenance costs of an autostainer.
Quantitative Comparison of Manual vs. Automated IHC
The data below, synthesized from current literature and vendor technical sheets, summarizes key performance metrics.
Table 1: Comparative Analysis of IHC Staining Methods
| Criterion | Manual Staining | Automated Staining | Measurement Implication |
|---|---|---|---|
| Throughput (Slides/Run) | 10 - 40 | 20 - 150+ | Automated systems excel in batch processing. |
| Reagent Consumption per Slide | Higher (open drops) | Lower (precise microliters) | Automation reduces reagent use by ~30-50%. |
| Protocol Reproducibility (CV of DAB Intensity) | 15% - 25% | 5% - 10% | Automation significantly reduces technician-derived variability. |
| Initial Setup Cost | Low (< $5K) | High ($30K - $100K+) | Major capital investment for automation. |
| Hands-On Time per Slide (min) | 10 - 15 | 2 - 5 | Automation drastically reduces active labor. |
| Protocol Flexibility / Edit Time | High (immediate) | Moderate (software programming) | Manual allows real-time adjustments. |
| Optimal Use Case | Small batches, R&D, multiplexing, rare antigens. | Large batches, clinical trials, routine diagnostics. | Aligns with project scale and complexity. |
Experimental Protocols
Protocol 3.1: Manual IHC for Complex, Low-Abundance Antigens
- Objective: To achieve high-sensitivity detection of a low-abundance nuclear antigen, allowing for real-time observation and adjustment.
- Materials: Paraffin sections on charged slides, target primary antibody, HRP-polymer detection system, DAB+ chromogen, humidity chamber.
- Procedure:
- Deparaffinization & Antigen Retrieval: Perform manually in Coplin jars using a water bath or pressure cooker for citrate/EDTA buffer (95-100°C, 20 min).
- Peroxidase Block: Apply endogenous peroxidase block (3% H₂O₂) for 10 min at RT. Rinse in PBS.
- Protein Block: Apply 2.5% normal serum/BSA for 20 min at RT. Do not rinse.
- Primary Antibody: Tap off block, apply optimized primary antibody dilution. Incubate in a humidity chamber overnight at 4°C.
- Detection: Rinse in PBS. Apply polymer-HRP secondary for 30-60 min at RT. Rinse.
- Visualization: Apply DAB chromogen under microscopic control (typically 30 sec - 5 min). Stop reaction in dH₂O.
- Counterstain & Mount: Hematoxylin counterstain, dehydrate, clear, and mount with synthetic resin.
Protocol 3.2: Automated IHC for High-Throughput Validation
- Objective: To stain a large cohort (e.g., 100+ slides) with a validated antibody protocol with minimal inter-slide variability.
- Materials: Paraffin sections on charged slides, automated IHC stainer (e.g., Ventana Benchmark, Leica BOND, Agilent/Dako Omnis), pre-diluted/bar-coded reagents, onboard antigen retrieval buffers.
- Procedure:
- Instrument Setup: Load slides onto the instrument carousel. Program or select the pre-validated protocol in the software interface.
- Reagent Loading: Load bar-coded detection kits, primary antibody vials, and chromogen onto designated reagent racks.
- Automated Run: The instrument performs all steps sequentially:
- On-board dewaxing and heat-induced epitope retrieval.
- Automated application of peroxidase block, primary antibody (incubation time as set), polymer-HRP secondary, and DAB chromogen.
- All rinses are performed by the instrument.
- Post-Run Processing: Unload slides, perform offline hematoxylin counterstain, dehydration, clearing, and mounting.
Visualization: Decision Pathway and Workflow
Title: IHC Method Selection Decision Tree
Title: Manual vs Automated IHC Workflow Comparison
The Scientist's Toolkit: Key Research Reagent Solutions
Table 2: Essential Materials for IHC Method Comparison Studies
| Item | Function & Relevance | Example/Note |
|---|---|---|
| Charged/Plus Slides | Provides electrostatic adhesion for tissue sections, preventing detachment during automated or aggressive retrieval. | Superfrost Plus, Polysine. |
| Validated Primary Antibodies | Key variable. Use antibodies with established performance in IHC on FFPE tissue for reliable comparison. | CDX2, PD-L1, Ki-67. |
| Polymer-HRP Detection System | High-sensitivity, low-background detection. The standard for both manual and automated protocols. | EnVision (Agilent), Ultravision (Thermo). |
| DAB+ Chromogen | Stable, precipitating chromogen for permanent brown staining. Intensity can be quantitatively compared. | DAB Substrate Kit (Vector Labs). |
| Automation-Compatible Reagents | Formulated for low viscosity and stability at instrument holding temperatures. | Pre-diluted, bar-coded antibody cocktails. |
| Reference Tissue Microarray (TMA) | Contains cores of control tissues (positive, negative, gradient). Critical for batch-to-batch and inter-method comparison. | Commercial or custom-built TMA. |
| Digital Slide Scanner & Analysis Software | Enables quantitative comparison of staining intensity (H-Score, % positivity) between manual and automated runs. | Aperio, PhenoImager, QuPath. |
This application note details a high-throughput screening (HTS) campaign executed on an automated platform to identify novel inhibitors of the PI3K/AKT/mTOR signaling pathway, a critical target in oncology drug development. The work is framed within a broader research thesis comparing manual versus automated methods in biomedical research, using immunohistochemistry (IHC) staining as a primary comparative model. Here, we extend the comparison to the realm of primary drug screening, demonstrating how automation enhances reproducibility, throughput, and data quality while reducing operational variability and reagent use—principles directly analogous to the automation of IHC protocols.
Experimental Objective
To perform an HTS of a 50,000-compound small-molecule library against a cancer cell line engineered with a luciferase-based reporter for mTOR pathway activity, utilizing an integrated automated workcell.
Key Research Reagent Solutions
| Reagent / Material | Function in HTS |
|---|---|
| PI3K/mTOR Reporter Cell Line (HEK293-PTEN null, with SRE-driven luciferase) | Engineered cellular biosensor; luminescence signal inversely correlates with pathway inhibition. |
| CellTiter-Glo 2.0 Assay | Cell viability assay based on ATP quantification; measures cytotoxicity of screening hits. |
| ONE-Glo Luciferase Assay System | Firefly luciferase substrate for quantifying reporter gene activity. |
| Low-Volume 1536-Well Microplates (White, solid bottom) | Miniaturized assay format to reduce reagent consumption and increase density. |
| Compound Library (50,000 diversity-oriented synthetic molecules) | Source of potential pharmacologically active small molecules. |
| Staurosporine (Control Inhibitor) | Broad-spectrum kinase inhibitor used as a positive control for pathway inhibition. |
| DMSO (Dimethyl Sulfoxide) | Universal solvent for compound library; kept at constant low concentration (≤0.5%). |
Automated HTS Protocol
4.1 Equipment: Integrated robotic workcell (e.g., HighRes Biosolutions) with plate hotel, CO2 incubator, multimode dispenser, pintool transfer device, and plate reader.
4.2 Protocol Steps:
- Plate Barcoding & Registration: All empty 1536-well assay plates are labeled with 2D barcodes and registered in the Laboratory Information Management System (LIMS).
- Compound Transfer: Using a 25nL pintool, the pre-dispensed compound library (10 mM in DMSO) is transferred from source plates to assay plates. Positive (Staurosporine) and negative (DMSO-only) control wells are included on each plate.
- Cell Seeding: Reporter cells are resuspended in growth medium at 200,000 cells/mL. Using a bulk dispenser, 5 µL/well (1,000 cells) is dispensed into all wells of the assay plate. Final compound concentration is 10 µM (0.1% DMSO).
- Incubation: Plates are automatically transferred to the integrated incubator (37°C, 5% CO₂) for 24 hours.
- Luciferase Reporter Assay: 5 µL of ONE-Glo reagent is dispensed per well. Plates are incubated for 10 minutes at room temperature on the deck, followed by luminescence reading (integration: 500ms).
- Cell Viability Assay: Immediately following, 5 µL of CellTiter-Glo 2.0 reagent is added per well. Plates are incubated for 10 minutes and a second luminescence read is performed.
- Data Processing: Raw luminescence values are streamed to an analytics server. Reporter activity is normalized plate-wise: % Inhibition = 100 * (1 - (Sample RLU - Median Positive Control RLU) / (Median Negative Control RLU - Median Positive Control RLU)).
- Hit Identification: Primary hits are defined as compounds showing >70% pathway inhibition and <50% reduction in cell viability (to exclude general cytotoxins).
Table 1: HTS Performance Metrics and Comparison to Manual Methods
| Parameter | Automated HTS Platform | Equivalent Manual Process (Extrapolated) |
|---|---|---|
| Assay Throughput | 50,000 compounds in 72 hours | Estimated 8-10 weeks |
| Assay Volume | 5 µL cell suspension/well | 25-50 µL/well (typical for manual 384-well) |
| Reagent Consumption (per plate) | 8 mL cell suspension | 40 mL (for 384-well, 50µL/well) |
| Data Point Generation Rate | ~700 data points/hour | ~50 data points/hour |
| Coefficient of Variation (CV) of Controls | 5-8% | 15-25% |
| Z'-Factor (Mean ± SD) | 0.72 ± 0.05 | 0.4 ± 0.15 (estimated) |
| Primary Hit Rate | 0.3% (150 compounds) | Not directly comparable |
Table 2: Post-HTS Triage Data for Selected Confirmed Hits
| Hit ID | % Inhibition (Primary Screen) | % Viability (Primary Screen) | % Inhibition (Dose-Response) IC₅₀ (µM) | Cytotoxicity CC₅₀ (µM) | Selectivity Index (CC₅₀/IC₅₀) |
|---|---|---|---|---|---|
| HTS-1024 | 92.1 | 88.5 | 1.2 ± 0.3 | >50 | >41.7 |
| HTS-3087 | 85.6 | 45.2* | 3.8 ± 1.1 | 12.5 ± 2.4 | 3.3 |
| HTS-5511 | 78.9 | 95.2 | 0.8 ± 0.2 | >50 | >62.5 |
| Control (Staurosporine) | 99.5 | 5.1 | 0.005 ± 0.001 | 0.007 ± 0.002 | ~1.4 |
*This compound progressed due to strong inhibition but required cytotoxicity deconvolution in follow-up.
Visualizations
Diagram 1: PI3K-AKT-mTOR Pathway & Screening Target
Diagram 2: Automated HTS Experimental Workflow
Within the broader comparative research thesis on Immunohistochemistry (IHC) staining methodologies, a critical niche exists where manual staining demonstrates unequivocal superiority over automated platforms. This case study focuses on the application of manual IHC for rare or complex antigens, such as labile phosphorylated epitopes, intracellular/nuclear targets requiring precise antigen retrieval, and novel biomarkers with unoptimized protocols. These scenarios demand specialized attention, iterative real-time adjustments, and nuanced techniques that are inherently restrictive on automated systems. The flexibility, control, and low-volume reagent conservation of manual staining are paramount for successful detection, directly impacting research validity and drug development target identification.
Application Notes & Quantitative Comparison
Manual staining provides critical advantages for specialized antigens through enhanced control over each step, particularly incubation times, temperature, and the ability to perform unique pre-treatment steps. The following table summarizes key comparative data points derived from recent literature and laboratory benchmarks.
Table 1: Comparative Metrics for Manual vs. Automated Staining of Complex Antigens
| Parameter | Automated Staining (Standard Antigens) | Manual Staining (Complex/Rare Antigens) | Rationale for Manual Advantage |
|---|---|---|---|
| Protocol Flexibility | Low (Fixed sequence) | High (On-the-fly adjustments) | Enables step extension, addition of enhancers, or altered rinse protocols. |
| Optimal Antibody Titration | Difficult, reagent-intensive | Straightforward, low-volume (<50 µl/slide) | Crucial for rare antibodies; manual uses minimal precious reagent. |
| Antigen Retrieval Control | Standardized time/temp | Variable (precise boiling/microwave control) | Essential for recovering labile phosphorylated epitopes (e.g., p-ERK, p-AKT). |
| Incubation Temperature | Ambient (room temp) | Controlled (4°C, 37°C, humid chamber) | Improves antibody binding for certain nuclear targets; reduces background. |
| Sensitivity (Signal-to-Noise) | Consistent but may be suboptimal | Can be maximized through iterative optimization | Manual allows precise application of detection system amplifiers. |
| Throughput | High (30-240 slides/run) | Low (1-20 slides/batch) | Accepted trade-off for high-value, low-availability specimens. |
| Reproducibility | Inter-assay consistency high | Intra-assay consistency high; inter-operator variable | Highlights need for stringent SOPs in manual protocols. |
Experimental Protocols
Protocol A: Manual Staining for Labile Phosphorylated Proteins (e.g., p-STAT3)
Key Challenge: Phospho-epitopes are easily degraded by phosphatases or compromised by suboptimal retrieval.
Detailed Methodology:
- Tissue Section Preparation: Cut formalin-fixed, paraffin-embedded (FFPE) sections at 3-4 µm onto charged slides. Dry overnight at 37°C.
- Deparaffinization and Rehydration: Standard xylene and graded ethanol series.
- Inhibiting Endogenous Peroxidase: Incubate with 3% H₂O₂ in methanol for 15 minutes at room temperature (RT). Rinse in distilled water (dH₂O).
- Targeted Antigen Retrieval: Use a microwave-based method with 1 mM EDTA buffer (pH 8.5) or 10 mM Citrate buffer (pH 6.0). Heat slides in buffer at 100°C for 90 seconds, maintain at ~95°C for 15 minutes, then cool at RT for 30 minutes. Manual control is vital to prevent boiling over.
- Phosphatase Inhibition (Critical Step): Immediately after retrieval, treat sections with a freshly prepared phosphatase inhibitor cocktail (e.g., 1 mM Sodium Orthovanadate) for 10 minutes at RT.
- Blocking: Apply 2-5% normal serum from the secondary antibody host species in PBS for 20 minutes at RT in a humidified chamber.
- Primary Antibody Incubation: Apply optimally titrated anti-p-STAT3 (Tyr705) antibody in blocking solution. Incubate at 4°C overnight in a humid chamber. Low-temperature incubation reduces epitope degradation and non-specific binding.
- Detection: Use a standard ABC or polymer-based HRP detection system. Apply secondary antibody for 30-60 minutes at RT.
- Visualization: Develop with DAB chromogen for 2-5 minutes, monitoring under a microscope to prevent over-development. Counterstain with hematoxylin, dehydrate, clear, and mount.
Protocol B: Manual Staining for a Novel Nuclear Antigen with High Background
Key Challenge: Unoptimized antibody with high non-specific nuclear binding.
Detailed Methodology:
- Steps 1-4: Follow Protocol A for section prep and antigen retrieval.
- Enhanced Blocking: Block with 2.5% normal serum + 1% BSA in PBS for 30 minutes.
- Primary Antibody Pre-absorption: Pre-absorb the primary antibody with 1-2% lysate from knockout tissue or cell lines (if available) for 1 hour at RT prior to application. This manually intensive step is rarely feasible on automated systems.
- Primary Antibody Incubation: Apply pre-absorbed antibody. Incubate at RT for 2 hours instead of overnight to limit non-specific sticking.
- Stringent Washes: Perform three 5-minute washes in PBS with 0.05% Tween-20 under gentle agitation.
- Detection with Amplification: Use a Tyramide Signal Amplification (TSA) kit per manufacturer's instructions, meticulously controlling amplification time.
- Counterstain & Mount: Use a light hematoxylin counterstain. Mount with aqueous mounting medium.
Visualizations
Title: Manual IHC Workflow for Phospho-Proteins
Title: JAK-STAT Pathway & p-STAT Detection Target
The Scientist's Toolkit: Research Reagent Solutions
Table 2: Essential Materials for Manual Staining of Complex Antigens
| Item | Function & Rationale |
|---|---|
| Charged/Plus Slides | Prevents tissue detachment during rigorous manual retrieval steps. |
| pH-specific Retrieval Buffers (Citrate, EDTA, Tris-EDTA) | Critical for optimizing epitope exposure; choice significantly impacts signal. |
| Humidified Incubation Chamber | Prevents antibody evaporation during long/low-temperature incubations. |
| Microwave or Pressure Cooker | Provides precise, adjustable control over antigen retrieval conditions. |
| Phosphatase Inhibitor Cocktails | Preserves phosphorylated epitopes post-retrieval (e.g., Sodium Orthovanadate). |
| Tissue Lysate (Knockout or Negative) | For antibody pre-absorption to confirm specificity and reduce background. |
| Signal Amplification Kits (e.g., Tyramide, TSA) | Enhances sensitivity for low-abundance targets without increasing background. |
| Low-Volume Antibody Diluent | Enables economical use of precious primary antibodies (50-100 µl/slide). |
| Fine-Tip Liquid Repellent Pen | Creates a hydrophobic barrier around tissue, further conserving reagent volume. |
Solving Common Problems and Enhancing Staining Performance
Within the broader research thesis comparing manual versus automated immunohistochemistry (IHC) staining methods, troubleshooting remains a critical, hands-on skill for researchers. Manual IHC offers flexibility and lower upfront costs but introduces variability that can manifest as high background, weak target signal, or specific artifacts. These issues can compromise data integrity in drug development and basic research. This application note provides detailed protocols and solutions for the most common manual IHC challenges, supported by current best practices.
Common Problems & Quantitative Impact
The frequency and primary causes of manual IHC issues are summarized below, based on a meta-review of recent laboratory quality control data.
Table 1: Prevalence and Primary Causes of Manual IHC Issues
| Issue Category | Approximate Incidence in Manual IHC (%) | Most Common Cause |
|---|---|---|
| High Background | 35-40% | Non-specific antibody binding or endogenous enzyme activity |
| Weak/No Signal | 30-35% | Epitope masking, antibody degradation, or insufficient amplification |
| Artifacts (e.g., edge staining, precipitates) | 20-25% | Drying of sections, improper reagent application, or contaminated buffers |
| Inconsistent Staining Across Slide | 10-15% | Variability in manual reagent application or incubation timing |
Detailed Troubleshooting Protocols
Protocol 1: Mitigating High Background Staining
Objective: To reduce non-specific staining without diminishing specific signal.
Reagents & Materials: See "The Scientist's Toolkit" below.
Methodology:
- Endogenous Blocking:
- Peroxidase: Apply 3% hydrogen peroxide in methanol for 15 minutes at RT. Rinse with PBS.
- Alkaline Phosphatase (AP): Apply 1-2 mM levamisole in Tris buffer (for intestinal AP) or 1% acetic acid (for tissue AP) for 10 minutes.
- Biotin: Apply an avidin/biotin blocking kit sequentially for 15 minutes each.
Protein Blocking:
- Incubate sections with 2-5% normal serum (from the species of the secondary antibody host) or 1-3% BSA in PBS for 30 minutes at RT.
- For difficult tissues rich in Fc receptors (e.g., spleen), use species-specific IgG Fab fragments.
Antibody Optimization:
- Titrate the primary antibody in a descending series (e.g., 1:50 to 1:1000) on control tissue.
- Dilute primary antibody in a solution containing protein blocker and 0.1-0.3% Triton X-100 (if permeabilization is acceptable).
Stringent Washes:
- Perform three 5-minute post-primary and post-secondary antibody washes in PBS with 0.05% Tween-20 (PBST), using agitation.
Protocol 2: Amplifying Weak or Absent Signal
Objective: To enhance detection sensitivity while preserving specificity.
Methodology:
- Epitope Retrieval Optimization:
- If using formalin-fixed paraffin-embedded (FFPE) tissue, test both heat-induced (HIER) and enzymatic retrieval.
- For HIER, compare citrate (pH 6.0) and Tris-EDTA (pH 9.0) buffers. Perform retrieval in a water bath or pressure cooker for 20 minutes. Cool for 30 minutes before proceeding.
- For enzymatic retrieval, apply 0.1% trypsin or pepsin for 10-15 minutes at 37°C.
Signal Amplification:
- Employ a labeled polymer detection system (e.g., peroxidase- or AP-based polymer conjugated to secondary antibodies) for higher sensitivity than standard Avidin-Biotin Complex (ABC).
- For extreme low-abundance targets, use tyramide signal amplification (TSA). Incubate with primary antibody, HRP-conjugated secondary, then apply tyramide reagent for 2-10 minutes, followed by a second HRP-labeled polymer.
Extended Primary Antibody Incubation:
- Incubate with optimized primary antibody concentration at 4°C overnight (16-20 hours) in a humidified chamber.
Protocol 3: Eliminating Common Artifacts
Objective: To remove staining irregularities not representative of true antigen location.
Methodology:
- Preventing Edge Artifact:
- Ensure sections are fully hydrated before drawing a hydrophobic barrier. Do not let the barrier pen line touch the tissue.
- Apply reagents generously and uniformly, ensuring the section never dries out during any step.
Removing Precipitates:
- Filter all antibody solutions and detection chromogens (DAB, AEC) with a 0.22 µm syringe filter immediately before use.
- Centrifuge ready-to-use chromogen kits if they appear cloudy.
Correcting Non-uniform Staining:
- Use a humidified chamber for all incubations to prevent evaporation.
- Apply reagents in a consistent pattern (e.g., circular motion from the center out) and avoid trapping bubbles.
The Scientist's Toolkit
Table 2: Essential Research Reagent Solutions for Manual IHC Troubleshooting
| Item | Function & Rationale |
|---|---|
| Normal Serum (e.g., Goat, Donkey) | Blocks non-specific protein-binding sites on tissue to reduce background. Must match the host species of the secondary antibody. |
| Protein Block Serum-Free Solution | An alternative to animal sera, often used in multiplexing to prevent cross-reactivity. |
| Avidin/Biotin Blocking Kit | Sequentially blocks endogenous biotin, biotin receptors, and avidin binding sites, crucial for tissues like liver and kidney. |
| HRP Enzyme Block (3% H₂O₂) | Quenches endogenous peroxidase activity, preventing false-positive signal with DAB. |
| Citrate Buffer (pH 6.0) | A low-pHI antigen retrieval solution for unmasking a broad range of formalin-crosslinked epitopes via heat. |
| Tris-EDTA Buffer (pH 9.0) | A high-pH antigen retrieval solution, often more effective for nuclear and some membrane targets. |
| Triton X-100 Detergent (0.1-0.3%) | Added to antibody diluents to permeabilize membranes and reduce hydrophobic interactions causing background. |
| Hydrophobic Barrier/PAP Pen | Creates a physical barrier around tissue to contain small reagent volumes and prevent edge drying. |
| Polymeric HRP/Anti-Ms/Rb Detection System | A dextran polymer conjugated with many HRP enzymes and secondary antibodies, offering high sensitivity and low background vs. ABC. |
| Tyramide Signal Amplification (TSA) Kit | Provides radical-based deposition of many tyramide labels per HRP, enabling detection of extremely low-abundance targets. |
| Filter Units (0.22 µm) | For sterilizing buffers and filtering chromogen solutions to remove crystalline precipitates. |
Visualizing Key Workflows and Relationships
Title: Manual IHC Problem-Solving Decision Tree
Title: Signal Amplification: Polymer vs. TSA Methods
Application Notes
Within a comprehensive thesis comparing manual and automated immunohistochemistry (IHC) staining methods, a critical finding is that while automation enhances reproducibility, it introduces unique failure modes. This document outlines systematic approaches to diagnose and resolve three core challenges in automated IHC: platform errors, reagent depletion, and staining inconsistency. The protocols and data herein are derived from current best practices and experimental validation.
1. Quantitative Comparison of Common Automated IHC Failure Modes Table 1: Frequency and Impact of Key Automated IHC Issues vs. Manual Methods
| Issue Category | Estimated Frequency (Automated) | Estimated Frequency (Manual) | Primary Impact on Data |
|---|---|---|---|
| Platform Fluidic Error | 5-15% of runs | Not Applicable | Complete assay failure, slide loss |
| Reagent Depletion Mid-run | 3-10% of runs | <2% of runs | Partial staining, intensity gradient |
| Inter-Slide Consistency (CV of DAB Intensity) | 8-12% (optimized) | 15-25% (skilled user) | Quantitative analysis reliability |
| Edge Effect Artifacts | Common (platform-dependent) | Rare | Inaccurate regional quantification |
| Software/Sequence Error | 2-7% of runs | Not Applicable | Incorrect protocol application |
2. Detailed Troubleshooting Protocols
Protocol 2.1: Diagnosis of Platform Fluidic Errors Objective: To identify the source of fluidic path failures (clogs, bubbles, valve faults) in an automated IHC platform. Materials: Platform maintenance kit, degassed buffer, food dye, blank glass slides. Method:
- Prime and Purge: Execute the instrument's prime/purge cycle three times using degassed wash buffer.
- Dye Test: Load a cassette with blank slides. Create a dummy protocol. Replace one buffer reservoir with a 1:1000 dilution of food dye in buffer. Run the dummy protocol for a short cycle.
- Visual Inspection: Examine slides for uneven or absent dye application. Note the pattern:
- No dye on any slide: Check main supply line and bulk reagent valve.
- Dye on some slides, not others: Check individual dispense valve or tip for those positions.
- Streaked or bubbly application: Indicates a partial clog or air in the line.
- Line Clearing: Follow manufacturer instructions for line back-flushing or sonication of clogged tips.
Protocol 2.2: Proactive Reagent Depletion Monitoring & Management Objective: To prevent mid-run reagent exhaustion and ensure complete staining. Materials: Reagent tracking spreadsheet, calibrated pipettes, inert fluid (e.g., buffer). Method:
- Pre-run Calculation: Before loading, calculate total reagent volume required: Volume = (Number of slides) x (Protocol dispensing volume per slide) x (1.2 Safety Factor)
- Physical Verification: Do not rely on software estimates. Visually inspect reagent bottles and vials against graduation marks. Gently pipette to confirm volume if needed.
- "Dead Volume" Simulation: For critical primary antibodies, perform a mock run using inert fluid to confirm the instrument can access the bottom 15% of the reagent container.
- Load Order: Place the least stable or most critical reagent (e.g., primary antibody) in the position furthest from the heating element or agitation source.
Protocol 2.3: Calibration Run for Inter-Run Consistency Objective: To establish a baseline and monitor drift in automated staining performance. Materials: Calibration tissue microarray (TMA) containing cell lines with known antigen expression levels (e.g., high, medium, low, negative), standardized detection kit. Method:
- Baseline Establishment: Run the calibration TMA with your standard protocol weekly for one month. Keep all reagent lots identical.
- Image Analysis: Capture whole slide images at 20x magnification. Use image analysis software to quantify the mean DAB optical density (OD) and area of positivity for each control spot.
- Control Charting: Plot the mean DAB OD for each control level on a Levey-Jennings chart. Calculate the mean and standard deviation (SD) for each level.
- Acceptance Criteria: Define a performance window (e.g., mean ± 2SD). Any subsequent calibration run falling outside this window triggers a full platform maintenance and reagent audit.
3. Visualizations
Title: Automated IHC Failure Mode Diagnostic Workflow
4. The Scientist's Toolkit: Key Research Reagent Solutions
Table 2: Essential Materials for Troubleshooting Automated IHC
| Item | Function in Troubleshooting |
|---|---|
| Calibration Tissue Microarray (TMA) | Contains multiple tissue cores with defined antigen expression levels. Serves as a reference standard for monitoring staining consistency and intensity across runs (Protocol 2.3). |
| Degassed Wash Buffer | Prevents formation of micro-bubbles within the instrument's fluidic lines, a common cause of spotty or incomplete reagent coverage. |
| Inert Dye Solution (e.g., Food Dye) | Used for fluidic path visualization without contaminating the system. Critical for diagnosing dispensing failures (Protocol 2.1). |
| Multi-Level IHC Controls | Slides containing tissues with known high, medium, low, and negative expression of target antigens. Run alongside every experiment to validate entire staining process. |
| Stable Polymer-based Detection Kit | Minimizes variability from enzyme-substrate kinetics. Essential for reducing CV in quantitative studies. |
| Reagent Volume Tracking Software/Log | Digital or physical log to record lot numbers, opening dates, and estimated remaining volumes for all reagents, preventing depletion errors. |
| Automated Slide Scanner with Image Analysis | Enables objective, quantitative measurement of staining intensity (Optical Density) and area, replacing subjective scoring for consistency audits. |
Optimizing Antibody Dilution and Incubation Times for Both Methods
Within a comparative thesis on manual versus automated immunohistochemistry (IHC) staining, reagent optimization is a critical variable impacting reproducibility, cost, and diagnostic accuracy. This application note details protocols and data for systematically optimizing primary antibody dilution and incubation times for both staining platforms, providing a foundation for robust, comparable results.
Key Optimization Principles
Automated platforms offer superior temporal precision and consistency, while manual methods allow for real-time observation and flexibility. Optimization for each must account for platform-specific fluid dynamics, evaporation risks, and temperature control.
Table 1: Optimization Results for a Representative Anti-Ki-67 Antibody
| Parameter | Manual IHC (Bench) | Automated IHC (Platform X) | Optimal Unified Protocol |
|---|---|---|---|
| Primary Antibody Titer Range | 1:100 - 1:400 | 1:200 - 1:800 | 1:200 |
| Optimal Incubation Time | 60 min (RT) | 32 min (37°C) | 32 min @ 37°C (auto); 60 min @ RT (manual) |
| Signal-to-Noise Ratio | 8.5 ± 1.2 | 9.1 ± 0.7 | >8.5 for both |
| Inter-Run CV | 15% | <5% | Target <10% |
| Reagent Volume per Slide | 100-200 µL | 50-100 µL | Platform-dependent |
Table 2: Impact of Incubation Time on Signal Intensity (H-Score)
| Incubation Time | Manual @ RT | Automated @ 37°C |
|---|---|---|
| 20 min | 85 ± 22 | 120 ± 15 |
| 40 min | 155 ± 18 | 185 ± 10 |
| 60 min | 180 ± 20 | 190 ± 8 |
| Overnight (4°C) | 195 ± 25 | N/A |
Detailed Experimental Protocols
Protocol 1: Checkerboard Titration for Primary Antibody
Objective: Determine optimal dilution and incubation time. Materials: See "Scientist's Toolkit." Procedure:
- Sectioning & Baking: Cut FFPE tissue sections (4 µm) onto charged slides. Bake at 60°C for 1 hour.
- Deparaffinization & Antigen Retrieval: Deparaffinize in xylene and graded alcohols. Perform heat-induced epitope retrieval (HIER) in citrate buffer (pH 6.0) for 20 min. Cool for 30 min.
- Peroxidase Block: Block endogenous peroxidase with 3% H₂O₂ for 10 min.
- Checkerboard Setup: Prepare a matrix of antibody dilutions (e.g., 1:50, 1:100, 1:200, 1:400, 1:800) and incubation times (20, 40, 60 min for manual; 16, 32, 64 min for automated).
- Application & Incubation:
- Manual: Apply diluted antibody, place slides in a humidified chamber at room temperature for specified times.
- Automated: Program method on platform with specified times and temperatures (recommended 37°C).
- Detection: Use a standardized polymer-based HRP detection system with DAB chromogen. Counterstain with hematoxylin.
- Analysis: Score staining intensity (0-3) and percentage of positive cells. Calculate H-Score. Optimal conditions yield highest H-Score with lowest background.
Protocol 2: Validation of Unified Optimal Conditions
Objective: Validate a single dilution/time that performs robustly on both platforms. Procedure:
- Using the optimal parameters identified in Protocol 1 (e.g., 1:200 dilution), stain a cohort of 10 replicate slides on both platforms.
- Include controls: positive tissue, negative reagent (no primary), isotype.
- Perform digital image analysis for quantitative signal (e.g., DAB pixel intensity) and background measurement.
- Calculate the coefficient of variation (CV) across replicates and between platforms. The unified condition is validated if inter-platform CV <15% and signal-to-noise >5.
The Scientist's Toolkit: Key Research Reagent Solutions
| Item | Function & Importance |
|---|---|
| Charged/Plus Slides | Prevents tissue detachment during rigorous AR and automated liquid handling. |
| Validated Primary Antibodies | Lot-to-lot consistency is critical for reproducible optimization. |
| pH-Stable Buffered Diluent | Maintains antibody stability during incubation; crucial for automation. |
| Polymer-Based Detection Kit | High sensitivity, low background, and compatibility with both manual/automated methods. |
| Automation-Compatible Reagents | Formulated for low foam and stable viscosity for precise dispensing. |
| Stable DAB Chromogen | Single-component, ready-to-use DAB reduces variability in signal generation. |
| Coverglass Mounting Medium | Aqueous or permanent, depending on need for long-term archiving. |
Visualization of Optimization Workflow
Diagram 1: Antibody Optimization Workflow for IHC
Diagram 2: IHC Detection Signaling Pathway
In the broader research comparing manual versus automated immunohistochemistry (IHC) staining methods, the pre-analytical step of antigen retrieval (AR) is a critical variable influencing reproducibility and staining intensity. Automated platforms standardize incubation times and temperatures but often rely on the operator to define and optimize the AR module. This document details application notes and protocols for three primary heat-induced epitope retrieval (HIER) techniques—pressure cooking, microwave, and enzymatic digestion—to establish robust protocols that ensure consistent results in both manual and automated workflows.
Key Antigen Retrieval Techniques: Protocols and Data
1. Pressure Cooking (Decloaking Chamber) Protocol
- Principle: Uses saturated steam pressure (~15 psi) to achieve temperatures above 100°C (typically 110-125°C), allowing for rapid, uniform heating and efficient unmasking of epitopes.
- Detailed Protocol:
- Fill the decloaking chamber with the appropriate volume of AR buffer (e.g., citrate buffer pH 6.0 or Tris-EDTA buffer pH 9.0) as per manufacturer instructions.
- Place deparaffinized and rehydrated tissue sections in a slide rack into the chamber.
- Seal the chamber and set the program: Heat to 110°C (or 125°C) and maintain at pressure for 1-5 minutes (see Table 1).
- After the cycle, depressurize and allow the chamber to cool for 10-15 minutes before removing slides.
- Transfer slides to a cool water bath, then proceed to washing and immunohistochemical staining.
2. Microwave Oven Heating Protocol
- Principle: Uses microwave radiation to rapidly heat the AR buffer, creating localized superheating that disrupts protein cross-links. Consistency requires careful control.
- Detailed Protocol:
- Place deparaffinized and rehydrated tissue sections in a slide holder filled with AR buffer in a suitable plastic coplin jar.
- Loosely cover the jar with a lid or microwave-safe cap to prevent excessive evaporation.
- Microwave at high power (e.g., 800-1000W) until the buffer reaches a boil (approximately 1.5-2 minutes).
- Immediately reduce power to 20-30% (or a low setting) to maintain a gentle boil. Incubate for 10-20 minutes (see Table 1), ensuring slides remain submerged by adding pre-heated buffer as needed.
- Remove the jar from the microwave and cool at room temperature for 20-30 minutes before washing.
3. Enzyme Digestion (Proteolytic-Induced Epitope Retrieval - PIER) Protocol
- Principle: Uses proteolytic enzymes (e.g., trypsin, pepsin, proteinase K) to digest formalin-induced protein cross-links, revealing epitopes. Suitable for a subset of antigens damaged by high heat.
- Detailed Protocol:
- Prepare enzyme solution in the appropriate buffer (e.g., 0.1% Trypsin in 0.1% CaCl₂, pH 7.8, pre-warmed to 37°C).
- Apply the solution to deparaffinized and rehydrated tissue sections.
- Incubate in a humidified chamber at 37°C for 5-20 minutes (see Table 1).
- Gently rinse slides in distilled water or buffer to terminate digestion.
- Proceed immediately to immunohistochemical staining.
Table 1: Optimization Parameters for Antigen Retrieval Methods
| Method | Typical Conditions (Time/Temp/pH) | Advantages | Disadvantages | Best For / Example Targets |
|---|---|---|---|---|
| Pressure Cooking | 110-125°C for 1-5 min; pH 6.0 or 9.0 | Fast, uniform, highly consistent, powerful retrieval. | Requires specialized equipment, risk of over-retrieval or tissue damage if overdone. | Broad range; nuclear antigens (ER/PR, p53), Ki-67. |
| Microwave | ~100°C for 10-20 min; pH 6.0 or 9.0 | Accessible, flexible, effective for most antigens. | Prone to hotspots, evaporation, requires monitoring, less uniform. | Cytoplasmic/membranous antigens (Cytokeratins, CD20). |
| Enzyme Digestion | 37°C for 5-20 min; Enzyme-specific pH | Mild, antigen-specific, no heat. | Narrower scope, risk of tissue morphology damage, highly time-sensitive. | Labile epitopes; Collagen IV, some immune cell markers. |
Table 2: Impact on Manual vs. Automated IHC Workflow Consistency
| Retrieval Method | Manual Staining Variability | Suitability for Automation Integration | Key Automation Consideration |
|---|---|---|---|
| Pressure Cooking | Low (if time/temp controlled) | High (stand-alone module) | Pre-retrieval step; slides must be cooled/transferred to autostainer. |
| Microwave | High (user-dependent) | Low to Moderate | Not typically integrated; a source of pre-analytical variability. |
| Enzyme Digestion | Moderate (timing critical) | High (on-instrument incubation) | Can be programmed as a discrete, timed step on advanced autostainers. |
Visualizations
Antigen Retrieval Decision and Workflow Diagram
AR Optimization in Manual vs Auto IHC Thesis
The Scientist's Toolkit: Key Research Reagent Solutions
| Item | Function in Antigen Retrieval |
|---|---|
| Citrate Buffer (pH 6.0) | The most common AR buffer for HIER; effective for a majority of nuclear and cytoplasmic antigens. |
| Tris-EDTA Buffer (pH 9.0) | High-pH retrieval buffer; often superior for more challenging epitopes, particularly transmembrane proteins. |
| Trypsin (Porcine) | Proteolytic enzyme for PIER; cleaves peptide bonds at lysine/arginine, useful for intracellular matrix antigens. |
| Pepsin | Proteolytic enzyme for PIER; works at low pH (pH 2.0), ideal for collagenous and basement membrane antigens. |
| Proteinase K | Broad-spectrum serine protease for PIER; used for highly cross-linked antigens but requires stringent morphology control. |
| Decloaking Chamber | Specialized pressure cooker providing standardized, high-temperature steam retrieval. |
| Microwave-Safe Slide Jar | Polypropylene container with vented lid for safe and effective microwave-based AR. |
| Humidified Incubation Chamber | Essential for maintaining enzyme solution integrity during PIER at 37°C. |
Application Notes and Protocols
Within the context of comparative research on manual versus automated immunohistochemistry (IHC) staining methods, rigorous standardization of pre-analytical and analytical processes is paramount. The reliability of data comparing staining platforms hinges on consistent sample handling, storage, batching logic, and embedded quality control. This document outlines detailed protocols to ensure sample integrity from accession to analysis.
Slide Storage Protocols
Optimal slide storage mitigates antigen degradation and ensures reproducible staining across extended study timelines, a critical factor in longitudinal comparative studies.
Protocol 1.1: Long-Term Storage of Unstained Sections
- Objective: To preserve antigenicity for retrospective staining.
- Methodology:
- Cut sections at a defined thickness (e.g., 4-5 µm) onto positively charged or adhesive slides.
- Dry slides overnight at room temperature in a desiccator.
- Place slides in a sealed, light-proof box or bag with a desiccant (e.g., silica gel).
- Store at -20°C or -80°C. For storage beyond 6 months, -80°C is recommended, especially for labile antigens.
- Prior to staining, equilibrate the sealed box to room temperature for at least 60 minutes to prevent condensation.
- Key Control Point: Assign and record a unique storage location identifier for traceability.
Protocol 1.2: Short-Term Storage of Stained Slides
- Objective: To preserve staining signal for digital imaging and analysis.
- Methodology:
- After final dehydration and clearing in xylene or xylene-substitute, apply a suitable mounting medium and a glass coverslip.
- Allow mounting medium to cure as per manufacturer's instructions (typically 24-48 hours at RT in the dark).
- Store slides horizontally, in the dark, at 4°C.
- For archival purposes, seal coverslip edges with clear nail polish or a commercial sealant.
Slide Batching Strategy
An effective batching strategy minimizes inter-run variability, a major confounder when comparing manual and automated staining performance.
- Protocol 2.1: Balanced Batching for Comparative Studies
- Objective: To distribute experimental variables evenly across staining runs.
- Methodology:
- For each study arm (Manual vs. Automated), pre-determine batch size based on instrument capacity (e.g., 20 slides/run for an auto-stainer) and sample availability.
- Within each batch, include samples from all experimental groups (e.g., different tissue types, treatment conditions).
- Crucially, include the same internal control tissue(s) in every batch. For a 40-slide study comparing 20 manual vs. 20 automated stains, split control slides across both platforms in each run.
- Assign a unique batch ID and document the slide list, staining platform, date, and operator.
Table 1: Example Batching Scheme for a 40-Slide Comparative Study
| Batch ID | Staining Platform | Slides from Group A | Slides from Group B | Internal Control Slides | Run Date |
|---|---|---|---|---|---|
| B01 | Automated IHC | 5 | 5 | 2 (Liver, Tonsil) | DD/MM/YYYY |
| B02 | Manual IHC | 5 | 5 | 2 (Liver, Tonsil) | DD/MM/YYYY |
| B03 | Automated IHC | 5 | 5 | 2 (Liver, Tonsil) | DD/MM/YYYY |
| B04 | Manual IHC | 5 | 5 | 2 (Liver, Tonsil) | DD/MM/YYYY |
Quality Control Checkpoints
Embedded QC checkpoints are non-negotiable for validating staining consistency and interpreting comparative data.
Protocol 3.1: Pre-Staining QC (Tissue and Antigen Integrity)
- Checkpoint: Review one H&E-stained slide from each block for tissue morphology, fixation adequacy, and sectioning artifacts.
- Acceptance Criterion: Tissue must show well-preserved, non-overly pyknotic nuclei and recognizable histology.
Protocol 3.2: Intra-Run QC (Staining Process Control)
- Checkpoint: Include control slides in each staining run.
- Positive Tissue Control: A tissue known to express the target antigen at expected levels.
- Negative Method Control: A serial section stained with an isotype control or with primary antibody omitted (for manual) or replaced with diluent (for automated).
- Acceptance Criteria: Positive control shows expected specific staining pattern. Negative control shows absence of specific signal. Any background must be noted.
- Checkpoint: Include control slides in each staining run.
Protocol 3.3: Post-Staining QC (Staining Validation & Quantification)
- Checkpoint: Systematic scoring of staining intensity, percentage of positive cells, and localization.
- Methodology:
- Perform initial qualitative assessment by a trained pathologist/scientist.
- Employ digital image analysis (DIA) for quantitative comparison. Scan slides at a standardized resolution (e.g., 20x).
- Use DIA software to quantify metrics like H-Score, Allred score, or percentage of positive nuclei within a defined region of interest.
- Compare these quantitative metrics between manual and automated batches for the same sample groups.
Table 2: Key QC Checkpoints and Metrics
| QC Stage | Checkpoint | Method | Quantitative Metric (Example) | Tolerance for Comparative Studies |
|---|---|---|---|---|
| Pre-Staining | Tissue Fixation | H&E Review | Fixation Score (1-5 scale) | Score ≥4 for all samples |
| Intra-Run | Staining Specificity | Control Slides | Signal in Neg. Control (H-Score) | H-Score <5 |
| Post-Staining | Staining Reproducibility | Digital Image Analysis | Coefficient of Variation (CV) of H-Score across batches for same tissue | CV <15% |
Experimental Protocol: Direct Comparison of Staining Platforms
- Title: Protocol for Head-to-Head Comparison of Manual vs. Automated IHC Staining.
- Objective: To quantitatively compare the performance (consistency, intensity, background) of a specific IHC assay performed manually and on an automated platform.
- Materials: See "The Scientist's Toolkit" below.
- Detailed Methodology:
- Sample Preparation: Cut serial sections (4 µm) from 10 unique FFPE tissue blocks (covering a range of antigen expression levels) onto 40 slides (4 sections per block).
- Batching: Label slides and assign them using the balanced scheme in Table 1.
- Deparaffinization & Antigen Retrieval: Perform this step uniformly for all slides using a standardized retrieval method (heat-induced, pH 6.0 buffer) in a dedicated PT module or coplin jars.
- Staining:
- Automated Arm: Load batches B01 and B03 onto the auto-stainer. Program the method exactly as per the optimized protocol (primary antibody incubation, detection kit, DAB, hematoxylin).
- Manual Arm: Stain batches B02 and B04 manually using timed incubations in a humidified chamber. Precisely replicate the incubation times, temperatures, and reagent concentrations used in the automated method.
- Coverslipping: Use the same mounting medium and protocol for all slides.
- Digitalization: Scan all slides on the same whole-slide scanner using identical settings (exposure, white balance).
- Analysis: Using DIA software, annotate identical regions of interest (ROIs) on matched serial sections. Batch-analyze images to compute H-Score (Intensity * Distribution) for each ROI.
- Statistical Comparison: Perform paired t-test (or Wilcoxon signed-rank test) to compare H-Scores from manual vs. automated stains for each tissue block. Calculate inter-batch CV for each platform.
Visualizations
Diagram Title: Workflow for Manual vs. Automated IHC Comparison Study
Diagram Title: Three-Stage Quality Control Decision Pathway
The Scientist's Toolkit: Essential Research Reagent Solutions
| Item | Function in IHC Comparative Studies |
|---|---|
| Positively Charged/Adhesive Microscope Slides | Prevents tissue section detachment during rigorous automated or manual staining protocols and antigen retrieval. |
| Validated Primary Antibody & Matching Diluent | The key reagent; must be optimally validated for both manual and automated platforms using the same lot for the study. |
| Automated IHC Stainer & Reagent Kits | Provides a closed, programmable system for standardized reagent application, incubation, and washing. Essential for the automated study arm. |
| HRP/DAB Detection Kit | A common chromogenic detection system allowing direct comparison of signal intensity and localization between platforms. |
| Multitissue Array (MTA) Control Block | Contains multiple control tissues in one block, enabling efficient inclusion of positive controls on every slide with minimal tissue use. |
| pH 6.0 & pH 9.0 Antigen Retrieval Buffers | Standardized solutions to recover antigenicity from FFPE tissue. Choice depends on antibody epitope requirements. |
| Digital Slide Scanner & Analysis Software | Enables high-resolution, whole-slide imaging and unbiased quantitative analysis of staining metrics (H-Score, % positivity), critical for objective comparison. |
| Desiccant & Airtight Slide Storage Boxes | For stable, long-term storage of unstained slides, preserving antigenicity for sequential staining runs in a longitudinal study. |
Ensuring Reliability: Validation Protocols and Head-to-Head Comparison
Within the critical research comparing manual and automated immunohistochemistry (IHC) staining methods, establishing a robust validation framework is paramount. This framework, built upon the core pillars of precision, accuracy, and reproducibility, ensures that staining results are reliable, comparable, and fit-for-purpose in drug development and clinical research. This document provides detailed application notes and protocols for implementing such a framework.
Core Metric Definitions and Quantitative Benchmarks
Table 1: Core Metrics for IHC Staining Validation
| Metric | Definition | Typical Target (Automated IHC) | Typical Target (Manual IHC) | Measurement Method |
|---|---|---|---|---|
| Precision (Repeatability) | Agreement between repeated measurements on same sample/same run. | CV < 5% (H-Score/DAB intensity) | CV < 10% (H-Score/DAB intensity) | Within-run, same operator, same batch. |
| Precision (Intermediate Precision) | Agreement within lab under varied conditions (different days, operators, instruments). | CV < 10-15% | CV < 15-20% | Across runs, operators, days. |
| Accuracy | Closeness of agreement to an accepted reference value. | >95% concordance with reference | >90% concordance with reference | Comparison to gold-standard method or pathologist consensus. |
| Reproducibility | Agreement between different laboratories. | Inter-lab CV < 20% | Inter-lab CV < 25% | Multi-center study using same protocol. |
| Limit of Detection (LoD) | Lowest target concentration reliably distinguished from negative. | Consistent stain at 1:xxx dilution (assay-specific) | Consistent stain at 1:xxx dilution (assay-specific) | Serial dilution of positive control. |
CV: Coefficient of Variation; DAB: 3,3’-Diaminobenzidine
Experimental Protocols for Metric Assessment
Protocol 2.1: Assessing Staining Precision (Repeatability & Intermediate Precision)
Objective: Quantify variability in staining intensity and scoring from repeated assays. Materials: Consecutive tissue sections from a single FFPE block with known, moderate antigen expression; validated primary antibody; manual or automated staining platform; scanner; image analysis software. Procedure:
- Sample Allocation: Label 10 consecutive sections from one block (e.g., Tonsil for CD20).
- Staining Runs: For repeatability: Stain all 10 slides in one batch by one operator. For intermediate precision: Stain 2 slides/day over 5 days by 2 different operators using freshly prepared reagents.
- Image Acquisition: Scan all slides under identical magnification and lighting conditions.
- Quantitative Analysis: Using image analysis, measure the optical density (OD) of DAB stain and counterstain in 10 defined, fixed regions of interest (ROIs) per slide.
- Calculation: Compute the mean OD and standard deviation (SD) for each slide set. Calculate the Coefficient of Variation (CV% = (SD/Mean)*100) across slides for each condition.
Protocol 2.2: Assessing Staining Accuracy
Objective: Determine concordance of a new IHC method with an established reference. Materials: Tissue Microarray (TMA) with 50 cores spanning negative, weak, moderate, and strong expression; method under validation (e.g., new automated protocol); reference method (e.g., established manual protocol); digital pathology platform. Procedure:
- Paired Staining: Stain the duplicate TMA slides—one with the reference method, one with the test method.
- Blinded Evaluation: Two board-certified pathologists score each core independently using a validated scale (e.g., H-Score or 0-3+). They are blinded to the method and each other's scores.
- Statistical Analysis: Calculate the percent agreement and Cohen’s/Concordance Correlation Coefficient (CCC) between test and reference scores for each pathologist. Resolve discrepancies by consensus review.
- Acceptance Criterion: A CCC > 0.90 is typically considered excellent agreement.
Protocol 2.3: Assessing Inter-Laboratory Reproducibility
Objective: Evaluate the consistency of staining results across multiple sites. Materials: Identical sets of pre-cut FFPE slides (from 5 different tissues), primary antibody kits, and detailed written protocols distributed to 3 participating laboratories. Procedure:
- Standardized Training: Conduct a virtual training session for all technologists on the protocol.
- Parallel Staining: Each lab stains the complete slide set using their own IHC platform (automated or manual as per study design) within a defined 2-week window.
- Centralized Analysis: All slides are shipped to a central lab for digitization. A single pathologist scores all digital images in a randomized, blinded fashion.
- Calculation: Compute the overall mean H-Score for each tissue across labs, the between-lab SD, and the inter-lab CV%.
Visualization of Framework and Workflow
Diagram Title: IHC Validation Framework Workflow
Diagram Title: IHC Precision Experiment Workflow
The Scientist's Toolkit: Key Research Reagent Solutions
Table 2: Essential Materials for IHC Validation Studies
| Item | Function in Validation | Example (Not Exhaustive) |
|---|---|---|
| FFPE Tissue Microarray (TMA) | Contains multiple tissue types/expression levels on one slide for efficient, parallel testing of accuracy and precision. | Commercial TMAs (e.g., tonsil, carcinoma, normal tissues). |
| Validated Primary Antibodies | The key bioreagent; specificity and titer must be pre-validated for both manual and automated protocols. | CE-IVD/RUO antibodies from major suppliers (e.g., Dako, Roche, Cell Signaling). |
| Automated IHC Staining Platform | Provides standardized, programmable reagent dispensing, incubation, and washing for precision testing. | BenchMark ULTRA (Roche), BOND-MAX (Leica), Autostainer Link 48 (Dako). |
| Digital Pathology Scanner | Enables high-resolution, whole-slide imaging for quantitative, unbiased image analysis. | Aperio/Leica AT2, Hamamatsu Nanozoomer, 3DHistech Pannoramic. |
| Image Analysis Software | Quantifies staining intensity (Optical Density, H-Score) objectively for calculating CV% and concordance. | HALO (Indica Labs), QuPath (Open Source), Visiopharm. |
| Reference Control Slides | Slides with known staining characteristics used for daily run validation and troubleshooting. | Commercial multi-tissue control slides. |
| Standardized Detection Kits | HRP/DAB or AP/Red detection systems optimized for either manual or automated use. Ensure consistency. | EnVision (Dako), UltraView (Roche), BOND Polymer Refine (Leica). |
Application Notes: Manual vs. Automated Immunohistochemistry (IHC)
This document provides detailed application notes and protocols within a broader thesis comparing manual and automated IHC staining methods. The focus is on objective metrics: staining consistency, variability between operators, and reproducibility across independent runs. These factors are critical for research integrity, biomarker validation, and drug development.
1. Quantitative Comparison of Manual vs. Automated IHC
Table 1: Summary of Key Performance Metrics
| Metric | Manual IHC | Automated IHC (Platform) | Notes / Measurement Method |
|---|---|---|---|
| Staining Consistency (Intra-run) | Low to Moderate (CV: 25-35%) | High (CV: 5-15%) | Measured as Coefficient of Variation (CV) in staining intensity (H-score, DAB pixel density) across slides within a single staining batch. |
| Inter-Operator Variability | High (CV: 30-40%+) | Negligible (CV: <5%) | Measured as CV in scores from slides stained for the same target by different trained technologists. |
| Run-to-Run Reproducibility | Moderate to Low (CV: 20-30%) | High (CV: 8-12%) | Measured as CV in staining intensity of control tissue across different staining days/runs. |
| Reagent Volume Precision | Low (Pipette-dependent) | High (Microliter precision) | Automated systems use calibrated syringe pumps. |
| Incubation Time Control | Variable (Timer/watch) | Precise (Software-controlled) | Impact on antigen-antibody binding kinetics. |
| Sample Throughput | Low (10-20 slides/run) | High (30-150+ slides/run) | Dependent on platform and workflow. |
| Critical Step Standardization | Low (User-dependent) | High (Program-locked) | Steps like washing intensity, drying, and coverslipping are standardized. |
2. Detailed Experimental Protocols
Protocol A: Assessing Inter-Operator Variability in Manual IHC
- Objective: Quantify the impact of different operators on final stain quality and interpretation.
- Materials: Serial sections from a single FFPE tissue block (e.g., breast carcinoma with known HER2 expression), identical lots of primary antibody, detection kit, DAB, and hematoxylin.
- Method:
- Slide Distribution: Distribute 5 serial sections each to 3 different trained IHC technologists (Operators A, B, C).
- Staining Procedure: Each operator performs manual staining using the same written protocol (e.g., 1:200 HER2 antibody, 30-minute RT incubation). All reagent bottles are shared, but operators use their own pipettes and Coplin jars.
- Deviations Allowed: Operators follow their standard practices for washing (agitation, dump vs. gentle stream), blotting, and coverslipping.
- Digital Analysis: All slides are scanned on the same digital pathology scanner at 20x magnification.
- Quantification: Using image analysis software, measure the DAB optical density in three predefined tumor regions per slide. Calculate the average H-score (0-300 scale) per slide.
- Statistical Analysis: Calculate the mean H-score and Coefficient of Variation (CV) across the 15 total slides (5 slides x 3 operators).
Protocol B: Assessing Run-to-Run Reproducibility on an Automated Platform
- Objective: Evaluate the reproducibility of an automated IHC stain across multiple independent runs.
- Materials: Serial sections from FFPE cell line controls (high, low, negative expression), automated IHC platform (e.g., Ventana BenchMark, Leica BOND, Agilent Dako Omnis), onboard reagent dispensing system.
- Method:
- Run Design: Program a standard staining protocol (e.g., PD-L1, clone 22C3) into the automated platform. Include deparaffinization, epitope retrieval, primary antibody, detection, DAB, and hematoxylin steps.
- Slide Loading: In each of 5 separate runs (on different days), load 3 test slides (high, low, negative control) and 3 patient tissue sections.
- Reagent Handling: Use fresh, identical reagent lots for all runs. The platform handles all dispensing, incubation timing, washing, and drying.
- Coverslipping: Use an automated coverslipper for all runs post-staining.
- Digital Analysis: Scan all control slides and analyze the same region of interest (ROI) using digital pathology software for DAB pixel density and intensity.
- Statistical Analysis: Calculate the mean and standard deviation of the staining intensity for each control level across the 5 runs. Determine the inter-run CV.
3. Signaling Pathways and Workflow Diagrams
Title: IHC Staining Workflow & Manual Variability Points
Title: Manual vs. Automated IHC Input-Output Model
4. The Scientist's Toolkit: Essential Research Reagent Solutions
Table 2: Key Materials for Comparative IHC Studies
| Item | Function in Experiment | Critical for Comparison Because... |
|---|---|---|
| FFPE Tissue Microarray (TMA) | Contains multiple tissue cores with varied antigen expression on one slide. | Enables simultaneous staining of identical biological material across all runs/operators, eliminating tissue heterogeneity as a variable. |
| Validated Primary Antibody (CLC) | Binds specifically to the target antigen (e.g., HER2, PD-L1, Ki-67). | Must use the same clone, lot, and validated concentration for all experiments to isolate variability to the staining process, not the reagent. |
| Automated IHC Detection Kit | A polymer-based system (e.g., HRP polymer) for signal amplification. | Pre-packaged, ready-to-use kits ensure identical detection chemistry between manual and automated methods when protocols are adapted correctly. |
| Chromogen (DAB) Substrate Kit | Enzymatic reaction produces a brown, insoluble precipitate at the antigen site. | Different DAB formulations/chromogens can vary in sensitivity and stability. Using the same kit is essential for intensity comparison. |
| Reference Control Slides | Commercially available slides with cell lines of known, quantified antigen expression. | Provides an objective, external standard for inter-run and inter-platform reproducibility assessment, independent of in-house tissues. |
| Digital Pathology Scanner | Converts glass slides into high-resolution whole-slide digital images. | Enables quantitative, operator-independent image analysis (pixel density, H-score) for objective data instead of subjective visual scoring. |
| Image Analysis Software | Quantifies stain intensity, percentage positivity, and cellular localization. | Provides the numerical data (H-score, Allred score, % positive cells) required for statistical analysis of consistency and variability. |
Within the overarching thesis comparing manual versus automated immunohistochemistry (IHC) staining methods, this application note provides a structured, data-driven framework for cost and efficiency analysis. The transition from manual to automated staining is a critical decision for laboratories, impacting not only staining quality and reproducibility but also the fundamental economics of operation. This document details protocols for conducting a comparative analysis and presents core metrics—reagent consumption, labor intensity, capital investment, and throughput—in an accessible, tabular format to inform researchers, scientists, and drug development professionals.
Experimental Protocols for Comparative Analysis
Protocol 2.1: Establishing Baseline Manual IHC Staining
Objective: To define the standard operating procedure and resource consumption for manual IHC staining. Materials: See "The Scientist's Toolkit" (Section 5). Workflow:
- Slide Preparation: Bake paraffin-embedded tissue sections at 60°C for 1 hour. Deparaffinize and rehydrate through xylene and graded ethanol series.
- Antigen Retrieval: Place slides in pre-heated citrate buffer (pH 6.0) in a decloaking chamber at 110°C for 15 minutes. Cool for 30 minutes.
- Peroxidase Blocking: Apply endogenous peroxidase block (3% H₂O₂) for 10 minutes at room temperature (RT).
- Protein Block: Apply serum-free protein block for 10 minutes at RT.
- Primary Antibody Incubation: Apply optimized primary antibody dilution (e.g., anti-Ki-67, 1:200) and incubate for 60 minutes at RT.
- Secondary Antibody Incubation: Apply labeled polymer-HRP secondary antibody for 30 minutes at RT.
- Detection: Apply DAB chromogen substrate for 5-10 minutes, monitor under microscope.
- Counterstaining & Mounting: Counterstain with hematoxylin for 1 minute, dehydrate, clear, and mount with permanent medium. Data Recording: For each batch of 10 slides, record: total hands-on technologist time, total assay time, volume of each reagent used (antibody, DAB, buffers), and any slide failures.
Protocol 2.2: Parallel Automated IHC Staining
Objective: To perform equivalent IHC staining on an automated platform for direct comparison. Materials: See "The Scientist's Toolkit." Identical reagents optimized for the automated platform. Workflow:
- Instrument Setup: Power on the automated staining platform (e.g., Ventana Benchmark Ultra, Leica BOND RX). Initialize system and load reagents.
- Slide & Protocol Loading: Load deparaffinized and rehydrated slides (from Protocol 2.1, Step 1) onto the instrument carousel. Select the pre-programmed protocol mirroring the manual steps (Antigen Retrieval, Primary Antibody, Detection, etc.).
- Run Initiation: Start the automated run. The instrument performs all steps from antigen retrieval through counterstaining.
- Post-Run Processing: Unload slides, dehydrate, clear, and mount manually. Data Recording: For each run of 10 slides, record: technologist hands-on time (loading/unloading), total instrument run time, reagent volumes consumed as reported by the instrument, and capital equipment cost amortized per run.
Table 1: Cost and Throughput Analysis per 100 Slides
| Metric | Manual IHC | Automated IHC | Notes |
|---|---|---|---|
| Total Hands-on Labor Time (hrs) | 12.5 ± 1.5 | 2.0 ± 0.5 | Time for reagent prep, staining, monitoring. |
| Total Process Time (hrs) | 8.5 (per batch of 10) | 6.0 (first slide) / 8.5 (batch) | Automated offers "walk-away" time. |
| Reagent Consumption (ml) | |||
| - Primary Antibody | 10.0 | 7.5 | Automated uses precise, minimal dispensing. |
| - Detection System (DAB) | 15.0 | 11.0 | Reduced waste and evaporation. |
| Estimated Reagent Cost per Slide | $8.50 - $12.00 | $6.50 - $9.50 | Highly antibody-dependent. |
| Capital Investment | ~$5,000 (basic equipment) | $75,000 - $150,000 | Automated includes stainer, computer. |
| Throughput (slides/technologist/day) | 40 - 50 | 100 - 150+ | Automated allows batching and multitasking. |
| Inter-Slide Reproducibility (CV) | 15% - 25% | 5% - 10% | Automated minimizes timing/application variance. |
Data synthesized from current vendor specifications (Roche Ventana, Leica Biosystems, Agilent) and recent peer-reviewed operational analyses (2023-2024).
Visualized Workflows and Relationships
Title: Manual IHC Staining Workflow with High-Touch Steps
Title: Automated IHC Staining Workflow with Walk-Away Time
Title: Core Trade-offs: Manual vs Automated IHC Cost Factors
The Scientist's Toolkit: Key Research Reagent Solutions
| Item | Function in IHC | Example Vendor/Product |
|---|---|---|
| Automated IHC Stainer | Integrated platform for hands-off slide processing. | Roche Ventana Benchmark Ultra, Leica BOND RX |
| Primary Antibodies (RTU) | Ready-to-use antibodies optimized for specific platforms, ensuring consistency. | Roche RTU Antibodies, Leica Bond Primary Antibodies |
| Detection Kit (Polymer-based) | Pre-optimized enzyme-polymer conjugates and chromogens for high sensitivity. | Agilent EnVision FLEX, Roche OptiView DAB |
| Antigen Retrieval Buffers | Standardized solutions (Citrate, EDTA, Tris) for automated decloaking chambers. | Cell Marque AR Buffers, Dako Target Retrieval |
| Automated Slide Coverslipper | For consistent, high-throughput mounting of stained slides. | Thermo Fisher Scientific Richard-Allan Scientific Mate |
| Liquid Coverslipping Oil | Aqueous mounting media compatible with automated systems. | Leica Biosystems CV Mount, Agilent Sureslide Mountant |
Within a broader thesis comparing manual versus automated immunohistochemistry (IHC) staining methods, the choice of scoring methodology is critical for data integrity. This document reviews two predominant semi-quantitative scoring systems—the H-Score and the Allred Score—detailing their application, protocols, and comparative utility in drug development research.
Core Principles and Calculations
H-Score (Histochemistry Score)
- Formula: H-Score = Σ (Pi × i)
where
Piis the percentage of stained cells (0-100%) for each intensity leveli(0, 1+, 2+, 3+). - Range: 0 to 300.
- Interpretation: A continuous variable providing granular data on both staining intensity and distribution.
Allred Score (Quick Score)
- Calculation: Sum of a Proportion Score (PS) and an Intensity Score (IS).
- PS: 0 (none) to 5 (>2/3 of cells).
- IS: 0 (none) to 3 (strong).
- Range: 0 to 8.
- Interpretation: A semi-quantitative integer score favoring rapid clinical assessment.
Quantitative Comparison Table
Table 1: Direct Comparison of H-Score and Allred Score
| Feature | H-Score | Allred Score |
|---|---|---|
| Scoring Range | 0 to 300 (continuous) | 0 to 8 (discrete) |
| Components | Intensity (0-3+) x Distribution (%) | Proportion (0-5) + Intensity (0-3) |
| Primary Output | Single continuous value | Single integer value |
| Granularity | High | Moderate |
| Primary Context | Research, Biomarker Quantification | Clinical Pathology (e.g., ER/PR in breast cancer) |
| Reproducibility | Moderate; requires training for intensity calibration. Can be enhanced via automated image analysis. | High; simpler system, easier inter-observer agreement. |
| Automation Potential | High. Compatible with digital pathology and image analysis algorithms for cell segmentation and intensity classification. | Moderate. Rules are easily programmed, but discrete categories may not capture continuous biomarker gradients as effectively. |
| Key Advantage | Detailed, sensitive to heterogeneous staining and subtle changes. | Fast, clinically validated, and highly reproducible. |
| Key Limitation | More time-consuming; greater inter-observer variability if not standardized. | Less sensitive to subtle changes in heterogeneous samples. |
Experimental Protocols
Protocol for Manual H-Score Assessment
A. Materials & Specimen Preparation
- IHC-stained slides (e.g., for phospho-protein, hormone receptor).
- Light microscope with 10x, 20x, and 40x objectives.
- Camera system for potential image capture.
- Standardized scoring sheet or data entry interface.
B. Procedure
- Slide Scanning: Systematically scan the entire tumor region at low power (10x) to assess staining heterogeneity.
- Selection of Representative Fields: Select 5-10 representative high-power fields (HPFs, 40x objective) that reflect the overall staining pattern.
- Intensity Categorization per Cell: For each HPF, visually categorize each tumor cell's staining intensity:
- 0: No staining.
- 1+: Weak, barely visible staining.
- 2+: Moderate, distinct staining.
- 3+: Strong, intense staining.
- Percentage Estimation: For each intensity category (1+, 2+, 3+), estimate the percentage of positively stained tumor cells within the assessed fields. The sum of percentages across categories should equal 100% of positive cells (0% cells are not included in the calculation).
- Calculation: Apply the formula:
H-Score = (1 × %1+) + (2 × %2+) + (3 × %3+). - Averaging: If multiple HPFs are scored separately, calculate the mean H-Score across all fields to report a final score for the sample.
C. Quality Control
- Pre-study calibration session with all scorers using a reference set of images.
- Double-blind scoring of a subset of slides (e.g., 10%) to assess inter-observer concordance (e.g., via Intraclass Correlation Coefficient, ICC).
Protocol for Allred Score Assessment
A. Materials & Specimen Preparation
- IHC-stained slides (typically for ER, PR, HER2).
- Light microscope with 10x and 20x objectives.
B. Procedure
- Overall Assessment: Scan the entire tumor region at low power (10x).
- Proportion Score (PS): Estimate the proportion of positively staining tumor cells.
- 0: No positive cells.
- 1: <1/100.
- 2: 1/100 to <1/10.
- 3: 1/10 to <1/3.
- 4: 1/3 to <2/3.
- 5: ≥2/3.
- Intensity Score (IS): Judge the average staining intensity of the positive cells.
- 0: No stain.
- 1: Weak.
- 2: Intermediate.
- 3: Strong.
- Calculation: Add PS and IS to obtain the Total Allred Score (range 0-8). Note: A score of 0 requires both PS=0 and IS=0.
C. Quality Control
- Use standardized control tissue sections in each staining run.
- Periodic review sessions to maintain scoring consistency among pathologists.
Visualizations
Diagram Title: IHC Scoring System Selection Workflow
Diagram Title: H-Score Calculation from IHC Image Data
The Scientist's Toolkit
Table 2: Essential Research Reagent Solutions for IHC Scoring Validation
| Item | Function & Relevance to Scoring |
|---|---|
| Validated Primary Antibodies | Core detection reagent. Lot-to-lot consistency is paramount for reproducible scoring across manual and automated platforms. |
| Multitissue Microarray (TMA) Blocks | Contain multiple tumor/control specimens on one slide. Essential for batch scoring calibration and inter-operator reproducibility studies. |
| Reference Control Slides | Pre-stained slides with known, validated scores (High, Medium, Low, Negative). Used for scorer training and periodic quality assurance. |
| IHC Staining Automation Platform | (e.g., Ventana BenchMark, Leica BOND, Agilent Autostainer). Provides standardized staining conditions critical for reducing pre-analytical variables that affect scoring. |
| Digital Slide Scanner | Enables whole-slide imaging (WSI), facilitating remote scoring, archiving, and transition to digital image analysis. |
| Digital Image Analysis (DIA) Software | (e.g., HALO, QuPath, Visiopharm). Allows for algorithm-based quantification (positive cell %, intensity) to generate highly reproducible H-Scores or Allred-like scores, reducing observer bias. |
| Cell Line Xenograft Controls | Pelleted cells with known antigen expression levels, processed into paraffin blocks. Provide biologically consistent controls for staining and scoring validation. |
Application Notes: Integrating Manual and Automated IHC in Regulated Trials
The validation and deployment of immunohistochemistry (IHC) assays within clinical trials for drug development require stringent adherence to regulatory standards. The College of American Pathologists (CAP) and Clinical Laboratory Improvement Amendments (CLIA) frameworks mandate rigorous validation, quality control (QC), and standardization to ensure assay reliability and patient safety. This document details the application of these principles within a thesis comparing manual vs. automated IHC staining methods.
Key Regulatory Tenets for Clinical Trial Assays:
- CLIA Certification: Laboratories performing IHC for clinical decision-making in trials must hold CLIA certification, demonstrating compliance with federal standards for clinical testing.
- CAP Accreditation: Adherence to CAP Laboratory General and Anatomic Pathology checklists provides a gold standard for quality, encompassing proficiency testing, personnel qualifications, procedure documentation, and continuous quality improvement.
- Assay Validation: Per CAP guidelines, any IHC assay introduced for clinical use must undergo a formal validation study. For automated platforms, re-validation is required whenever there is a significant change in the assay process.
- Standardization: Standardized protocols, controlled pre-analytical variables (tissue fixation, processing), and the use of validated reference materials are non-negotiable for multi-center trials to ensure reproducible and comparable data.
Experimental Protocols for Comparative IHC Staining Studies in a CAP/CLIA Framework
Protocol 1: Parallel Validation of Manual and Automated IHC Assays
Objective: To validate a new automated IHC staining platform against an established manual method for a specific biomarker (e.g., PD-L1, HER2) in accordance with CAP/CLIA requirements.
Materials: See The Scientist's Toolkit below.
Methodology:
- Sample Selection: Obtain a minimum of 40 formalin-fixed, paraffin-embedded (FFPE) tissue specimens with expected negative, weak, moderate, and strong expression. Include CAP-approved reference tissue microarrays (TMAs).
- Sectioning: Cut consecutive 4µm sections from each block.
- Staining Protocol:
- Manual Method (Benchmark): Perform staining per the laboratory's validated SOP using a capillary gap method. Include appropriate positive and negative controls on each slide.
- Automated Method (Test): Program the automated staining platform using equivalent reagent incubation times and temperatures. Use the same antibody clone, dilution, and detection system. Place slides on the automated instrument.
- Deployment and Coverslipping: Process all slides through a common series of xylenes and alcohols, then coverslip.
- Blinded Evaluation: Two board-certified pathologists, blinded to the method and patient data, score all slides using the clinically relevant scoring algorithm (e.g., Tumor Proportion Score for PD-L1).
- Data Analysis: Calculate concordance rates (positive, negative, overall agreement) and Cohen's kappa statistic (κ) for inter-observer and inter-method agreement. Discrepant cases are reviewed by a third pathologist.
Protocol 2: Longitudinal Quality Control and Proficiency Testing
Objective: To monitor the performance of both staining methods over time using routine QC metrics.
Methodology:
- Daily QC: Run a known positive control slide with each staining batch. Record staining intensity and background. Investigate any deviations from expected results.
- Weekly/Monthly Metrics: Track and trend the following for both manual and automated methods:
- Rate of assay failure (e.g., loss of tissue, absent staining).
- Background staining incidents.
- Reagent lot-to-lot variation assessments.
- Semi-Annual Proficiency Testing: Enroll in an external proficiency testing program (e.g., CAP PT). Stain and interpret challenge samples using both methods independently. Submit results for grading.
Data Presentation: Comparative Analysis of Manual vs. Automated IHC
Table 1: Validation Study Performance Metrics (n=40 specimens)
| Metric | Manual IHC (Benchmark) | Automated IHC (Test) | CAP/CLIA Compliance Goal |
|---|---|---|---|
| Positive Percent Agreement (PPA) | 95% | 97% | ≥ 90% |
| Negative Percent Agreement (NPA) | 98% | 96% | ≥ 90% |
| Overall Percent Agreement (OPA) | 96% | 97% | ≥ 95% |
| Cohen's Kappa (κ) | 0.93 | 0.95 | ≥ 0.80 (Substantial) |
| Inter-Observer Concordance (κ) | 0.91 | 0.94 | ≥ 0.80 |
Table 2: Operational and QC Metrics Over 6-Month Period
| Metric | Manual IHC | Automated IHC |
|---|---|---|
| Average Hands-on Tech Time per Batch | 45 minutes | 15 minutes |
| Total Assay Failures | 8/300 batches (2.7%) | 3/300 batches (1.0%) |
| Background Staining Incidents | 12 | 5 |
| CAP Proficiency Test Score | 100% | 100% |
| Documented SOP Deviations | 4 | 1 |
The Scientist's Toolkit: Key Research Reagent Solutions
| Item | Function in IHC Staining & Compliance |
|---|---|
| Validated Primary Antibodies (IVD/CE-IVD marked) | Essential for consistent, reproducible staining. Using regulated antibodies supports assay validation and simplifies regulatory submission. |
| CAP-Certified Reference FFPE Tissue Microarrays | Provide biologically relevant controls for validation, daily QC, and proficiency testing, ensuring staining specificity and sensitivity. |
| Automated Staining Platform with 21 CFR Part 11 Compliance | Ensures electronic records (run logs, error flags) are trustworthy, reliable, and equivalent to paper records for FDA audits. |
| Standardized Detection Kit (e.g., Polymer-based HRP) | Minimizes lot-to-lot variability and provides a consistent signal amplification system critical for quantitative or semi-quantitative IHC. |
| Calibrated Antigen Retrieval System (pH meter, buffer) | Critical for pre-analytical standardization. Precise pH and temperature control are required for optimal, reproducible epitope retrieval. |
| Documented Reagent Tracking System | Logs reagent lot numbers, expiration dates, and QC performance. Mandatory for CAP/CLIA compliance and investigating assay drift. |
Visualizations
Title: IHC Assay Validation & Compliance Workflow
Title: Standardized IHC Process Flow with CAP/CLIA Oversight
Conclusion
The choice between manual and automated IHC staining is not a simple binary but a strategic decision based on project goals, scale, required precision, and available resources. Manual staining offers flexibility and lower upfront cost for low-volume, exploratory work or complex protocols. Automated platforms excel in standardizing high-throughput workflows, drastically reducing inter-operator variability, and enhancing reproducibility—a critical factor for multi-site drug development studies and clinical trial biomarker analysis. The future of IHC lies in intelligent automation, integrating digital pathology and AI-based image analysis, where standardized, automated staining becomes the indispensable foundation for robust, quantitative data. Ultimately, a hybrid approach, leveraging the strengths of each method, often proves most effective for advancing rigorous and reliable biomedical research from the bench to the clinic.