RSV Vaccine Design: Why the F Protein's Antigenic Stability Outperforms the G Protein
This article provides a comprehensive analysis for researchers, scientists, and drug development professionals on the comparative antigenic stability of Respiratory Syncytial Virus (RSV) surface proteins.
RSV Vaccine Design: Why the F Protein's Antigenic Stability Outperforms the G Protein
Abstract
This article provides a comprehensive analysis for researchers, scientists, and drug development professionals on the comparative antigenic stability of Respiratory Syncytial Virus (RSV) surface proteins. It explores the foundational biology defining the high variability of the G protein's extracellular domain versus the conserved nature of the prefusion F conformation. It details methodological approaches for evaluating antigenic drift, troubleshooting challenges in targeting the G protein, and validating the F protein as the superior target through comparative immunogenicity and neutralization studies. The synthesis offers critical insights for rational vaccine and therapeutic antibody design.
Decoding RSV's Surface: The Inherent Structural and Genetic Drivers of Antigenic Diversity
Introduction Within the landscape of Respiratory Syncytial Virus (RSV) research, the antigenic stability of surface glycoproteins is a critical determinant for successful vaccine and therapeutic antibody development. This guide objectively compares the core structural and antigenic properties of the two major RSV surface proteins, the fusion (F) protein and the attachment (G) protein, framing the discussion within the broader thesis of antigenic stability comparison.
1. Structural & Functional Comparison
| Feature | RSV F Protein | RSV G Protein |
|---|---|---|
| Primary Function | Membrane fusion, viral entry. | Host cell attachment, immunomodulation. |
| Protein Class | Type I fusion glycoprotein. | Type II mucin-like glycoprotein. |
| Quaternary Structure | Trimeric (pre-fusion & post-fusion). | Dimeric and multimeric forms. |
| Glycosylation | N-linked glycosylation sites (5-6). | Heavy O-linked and N-linked glycosylation. |
| Conserved Domains | Highly conserved fusion peptide, heptad repeats. | Central conserved domain (CCD) flanked by highly variable mucin domains. |
| Antigenic Sites | Well-defined, conserved sites (Ø, V, etc.) targeted by potent neutralizing antibodies (e.g., palivizumab). | Poorly defined, strain-variable sites; antibodies are often less potent and non-neutralizing. |
| Antigenic Stability | High. Pre-fusion F (pre-F) conformation is a stable, dominant neutralization target. | Low. High sequence variability and glycan shielding lead to immune evasion. |
2. Quantitative Antigenic Stability Data
| Experimental Metric | RSV F Protein (pre-F stabilized) | RSV G Protein (C-terminal CCD) | Implication |
|---|---|---|---|
| Sequence Identity (Strain A vs. B) | ~90% | ~50% | F is genetically more conserved. |
| Neutralizing Antibody Titer (Human sera vs. protein) | High (log10 > 3.0) | Low to undetectable | Pre-F elicits robust neutralization. |
| Escape Mutation Frequency (in vitro) | Low | Very High | F epitopes are less prone to immune escape. |
| Thermal Stability (Tm) | ~65°C (DS-Cav1 pre-F) | Variable, often <50°C | Pre-F is a structurally stable immunogen. |
| Impact of Glycan Removal on Antibody Binding | Moderate increase | Dramatic increase | G protein glycans are a major shield. |
3. Key Experimental Protocols
3.1. Surface Plasmon Resonance (SPR) for Binding Kinetics
- Purpose: Quantify the binding affinity and stability of monoclonal antibodies (mAbs) to F vs. G proteins.
- Methodology:
- Immobilize purified antigen (e.g., pre-F trimer or G protein CCD) on a CMS sensor chip via amine coupling.
- Inject a series of concentrations of mAbs (e.g., 0-100 nM) in HBS-EP buffer at a flow rate of 30 µL/min.
- Monitor association (120 s) and dissociation (300 s) phases.
- Regenerate the surface with 10 mM Glycine-HCl, pH 2.0.
- Analyze sensorgrams using a 1:1 Langmuir binding model to calculate association (ka) and dissociation (kd) rate constants and the equilibrium dissociation constant (KD = kd/ka).
3.2. Microneutralization Assay for Antigenic Potency
- Purpose: Assess the neutralizing capacity of serum or mAbs elicited by F or G proteins.
- Methodology:
- Serially dilute heat-inactivated test serum or mAb in duplicate in 96-well plates.
- Mix with an equal volume of RSV (e.g., strain A2) containing ~100 plaque-forming units (PFU).
- Incubate virus-antibody mixture at 37°C for 1 hour.
- Add the mixture to pre-seeded HEp-2 cell monolayers and incubate for 72 hours.
- Fix cells with 80% acetone and stain RSV-infected cells using an anti-RSV antibody (e.g., anti-F) and enzymatic detection.
- Calculate the 50% neutralization titer (NT50) using non-linear regression.
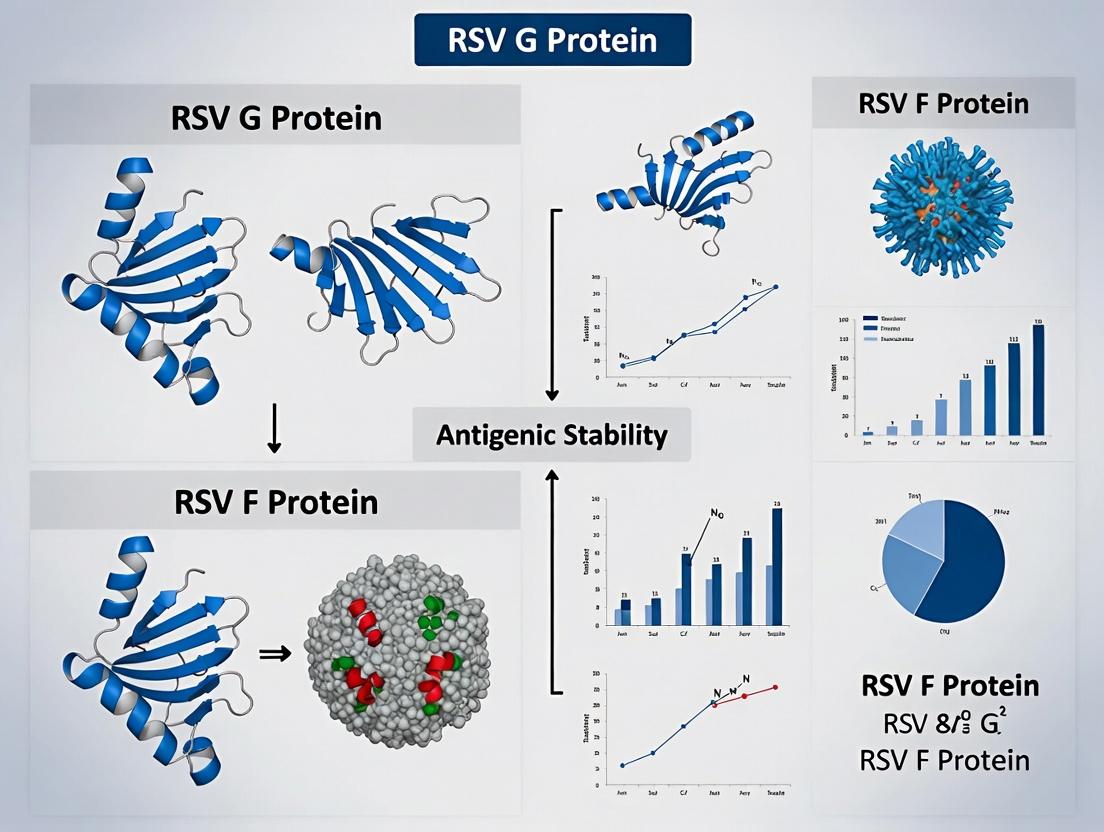
4. Visualizing Antigenic Determinants and Workflow
Title: Antigenic Fate of RSV F vs. G Proteins
Title: Workflow for Comparing Antigenic Stability
5. The Scientist's Toolkit: Key Research Reagents
| Reagent / Material | Function in F vs. G Research | Example/Target |
|---|---|---|
| Stabilized Pre-F Trimer | Gold-standard immunogen for eliciting potent neutralizing antibodies. | DS-Cav1, SC-TM variants. |
| Recombinant G Protein (CCD) | Isolated conserved domain for studying cross-reactive antibody responses. | Soluble G ectodomain (strain A/B). |
| Site-Specific mAbs | Probes for mapping and competing antigenic sites. | Palivizumab (Site II), D25 (Site Ø) for F; 3D3 for G CCD. |
| Glycosidase Enzymes | To remove N- or O-linked glycans and assess glycan shielding effects. | PNGase F, Endo H, O-glycosidase. |
| RSV A & B Strain Viruses | For in vitro neutralization and escape mutation studies. | RSV A2, Long (A); RSV B1, 18537 (B). |
| HEp-2 or Vero Cell Lines | Permissive cell lines for virus propagation and neutralization assays. | ATCC CCL-23, ATCC CCL-81. |
This guide compares the antigenic stability of the Respiratory Syncytial Virus (RSV) glycoprotein G and fusion protein F, a critical parameter for vaccine and therapeutic development. The analysis focuses on mutation rates, sequence variability, and resulting implications for immunogenicity.
Key Metrics Comparison
Table 1: Comparative Analysis of RSV Protein Variability
| Metric | RSV G Protein | RSV F Protein | Measurement Method |
|---|---|---|---|
| Mutation Rate (nt/site/year) | 3.5 x 10⁻³ | 1.2 x 10⁻³ | Next-generation sequencing of longitudinal clinical isolates |
| Nucleotide Diversity (π) | 0.075 ± 0.012 | 0.023 ± 0.005 | Population sequencing analysis (Illumina MiSeq) |
| dN/dS Ratio (Selection Pressure) | 1.85 | 0.45 | PAL2NAL pipeline on aligned sequences |
| Conserved Antigenic Sites (#) | 2 | 6 | Crystallography & monoclonal antibody escape mapping |
| Glycosylation Sites Variability | High (Hypervariable) | Low (Conserved) | Mass spectrometry of expressed proteins |
Table 2: Experimental Neutralization Data Against Variants
| Assay Type | Target Protein | Wild-type Titer (GMT) | Variant Titer (GMT) | Fold Reduction | Reference Strain |
|---|---|---|---|---|---|
| Plaque Reduction | RSV F | 1280 | 1120 | 1.1 | RSV A2 |
| Microneutralization | RSV F | 980 | 820 | 1.2 | RSV Long |
| Plaque Reduction | RSV G | 540 | 85 | 6.4 | RSV A2 |
| Microneutralization | RSV G | 610 | 95 | 6.4 | RSV Long |
Detailed Experimental Protocols
Protocol 1: Calculating Mutation Rates from Longitudinal Samples
- Sample Collection: Collect nasopharyngeal swabs from a defined cohort during consecutive RSV seasons (e.g., 5 years).
- Viral Sequencing: Extract viral RNA, perform RT-PCR targeting the G and F gene open reading frames, and sequence using Illumina MiSeq with >1000x coverage.
- Sequence Alignment: Align consensus sequences to a reference genome (e.g., RSV A2) using MAFFT v7.
- Phylogenetic Analysis: Construct maximum-likelihood trees using IQ-TREE. Estimate the molecular clock rate (substitutions/site/year) using Bayesian methods in BEAST2.
- Data Analysis: Compare the root-to-tip divergence for G versus F gene sequences to calculate differential mutation rates.
Protocol 2: Antigenic Cartography for Escape Variants
- mAb Generation: Generate a panel of monoclonal antibodies (mAbs) against F and G proteins from immunized mice or convalescent human B cells.
- Escape Mutant Selection: Incubate RSV with a single mAb under selective pressure. Propagate breakthrough virus in HEp-2 cells.
- Sequencing & Mapping: Sequence the complete F and G genes of escape mutants. Map mutations onto known protein structures (PDB IDs: 4JHW for pre-F, 4MMQ for G core).
- Cross-Neutralization: Test mAbs and polyclonal sera against all selected escape variants in a plaque reduction neutralization test (PRNT). Calculate antigenic distances.
- Visualization: Construct antigenic maps using AntigenMap to plot the spatial relationship between variants based on neutralization data.
Visualization of Analysis Workflow
Title: Workflow for Comparing RSV F and G Protein Variability
Title: RSV Entry Pathway Highlighting Key Protein Roles
The Scientist's Toolkit: Research Reagent Solutions
Table 3: Essential Reagents for RSV Antigenic Stability Research
| Item | Function in Research | Example Product/Catalog # |
|---|---|---|
| Recombinant RSV F Protein (Prefusion) | Key antigen for neutralization assays; standard for antibody response measurement. | Sino Biological, cat# 11049-V08H (Stabilized pre-F) |
| Recombinant RSV G Protein (Strain A & B) | Critical for studying strain-specific and variable region antibody responses. | Native Antigen Company, cat# RSV-GA1 |
| RSV-Specific Neutralizing mAbs | Positive controls for assays; tools for selecting escape mutants. | Palivizumab (Synagis), Motavizumab. Anti-G mAbs (e.g., 3D3). |
| Reference RSV Strains (A & B) | Essential for in vitro challenge experiments and sequence benchmarking. | ATCC: RSV A2 (VR-1540), RSV B1 (VR-1580). |
| HEp-2 or Vero Cell Lines | Permissive cell lines for RSV propagation, plaque assays, and microneutralization. | ATCC CCL-23 (HEp-2). |
| Plaque Assay Methylcellulose Overlay | Semi-solid overlay for plaque formation and PRNT quantification. | Sigma, Methocel MC (cat# M0512). |
| Next-Gen Sequencing Kit | For deep sequencing of viral genomes from clinical or lab samples. | Illumina COVIDSeq Test (adapted for RSV). |
| BEAST2 Software Package | Bayesian phylogenetic analysis for estimating mutation rates and divergence times. | Open-source (beast2.org). |
Within the broader thesis on Antigenic stability comparison between RSV G and F proteins, this guide objectively compares the inherent antigenic instability of the Respiratory Syncytial Virus (RSV) attachment (G) protein against the more stable fusion (F) protein. The central challenge of the G protein lies in its hypervariable mucin-like domains and extensive glycosylation, which act as immunological shields, complicating antibody recognition and vaccine design. This comparison is critical for researchers and drug developers targeting RSV neutralization.
Comparative Performance: RSV G vs. F Protein Antigenic Stability
Table 1: Structural & Antigenic Property Comparison
| Property | RSV G Protein | RSV F Protein | Experimental Support |
|---|---|---|---|
| Primary Function | Attachment to host cell (CX3CR1 binding) | Membrane fusion | Cell-binding vs. fusion assays |
| Domain Architecture | Central conserved domain flanked by hypervariable mucin-like domains | Trimeric pre-fusion & post-fusion conformations | X-ray crystallography, Cryo-EM |
| Glycosylation Level | High (~60-70% O-linked glycosylation, 4-5 N-linked sites) | Moderate (~6 N-linked glycosylation sites) | Mass spectrometry, Glycan profiling |
| Sequence Variability | High in mucin regions; strain-dependent polymorphisms | Highly conserved across strains and subgroups | Genomic sequence alignment (e.g., GISAID) |
| Antigenic Stability | Low; glycan shield and variability impede consistent Ab response | High; conserved neutralization-sensitive epitopes | ELISA with mAbs (e.g., D25, 5C4), serum competition |
| Neutralizing Antibody Target | Poor target; few potent neutralizing epitopes (e.g., site Ø in conserved domain) | Prime target; multiple pre-fusion-specific sites (sites Ø, V, III) | Plaque reduction neutralization test (PRNT) |
| Vaccine Development Success | Limited; no successful G-only vaccine candidate | High; basis for all approved vaccines (Arexvy, Abrysvo) | Clinical trial efficacy data (Phase III) |
Table 2: Quantitative Neutralization Data from Key Experiments
| Experiment / Assay | Target Protein | Result Metric (Mean ± SD) | Key Implication |
|---|---|---|---|
| PRNT50 with Human Convalescent Sera | Soluble G (sG) | NT50 Titer: 120 ± 45 | Weak neutralization response |
| Pre-fusion F (pre-F) | NT50 Titer: 2150 ± 320 | Dominant neutralization target | |
| mAb Binding Affinity (Surface Plasmon Resonance) | Anti-G mAb (Clone 3D3) | KD: 1.8 x 10⁻⁷ M | Low-affinity binding |
| Anti-pre-F mAb (Palivizumab) | KD: 1.2 x 10⁻⁹ M | High-affinity, therapeutic grade | |
| Serum Depletion/Adsorption | Adsorption with sG protein | Residual anti-F neutralization: >90% | G antibodies contribute minimally |
| Adsorption with pre-F protein | Residual neutralization: <10% | F antibodies account for most activity |
Detailed Experimental Protocols
Protocol 1: Plaque Reduction Neutralization Test (PRNT) for RSV
- Objective: Quantify neutralizing antibody titers in serum against RSV G vs. F.
- Method:
- Virus & Cells: Use HEp-2 cells and RSV A2 strain.
- Serum Dilution: Perform 2-fold serial dilutions of test sera.
- Virus-Serum Incubation: Mix equal volumes of diluted serum with ~100 PFU of RSV. Incubate at 37°C for 1 hour.
- Inoculation: Add mixture to confluent HEp-2 monolayers in 24-well plates. Adsorb for 2 hours with gentle rocking.
- Overlay: Replace inoculum with 0.8% methylcellulose overlay medium.
- Incubation & Staining: Incubate plates at 37°C, 5% CO₂ for 5-7 days. Fix with 10% formaldehyde and stain with 0.1% crystal violet.
- Analysis: Count plaques. The PRNT50 titer is the serum dilution that reduces plaques by 50% compared to virus-only controls.
Protocol 2: Glycan Shield Analysis via Glycanase Treatment and ELISA
- Objective: Assess the impact of glycosylation on antibody access to G protein epitopes.
- Method:
- Protein Treatment: Treat purified recombinant G protein (full-length or mucin domains) with O-glycanase (to remove O-linked glycans) and/or PNGase F (to remove N-linked glycans). Use untreated and buffer-only controls.
- ELISA Plate Coating: Coat ELISA plates with treated and untreated proteins overnight at 4°C.
- Antibody Binding: Block plates, then add a panel of anti-G monoclonal antibodies (targeting conserved vs. variable domains). Incubate.
- Detection: Use HRP-conjugated secondary antibody and TMB substrate. Measure absorbance at 450nm.
- Analysis: Compare absorbance values. Increased signal in deglycosylated samples indicates epitope unmasking by the glycan shield.
The Scientist's Toolkit: Research Reagent Solutions
Table 3: Essential Reagents for RSV G/F Antigenic Studies
| Reagent | Function & Application | Example Product/Source |
|---|---|---|
| Recombinant pre-F Protein (Stabilized) | Gold-standard antigen for eliciting/measuring neutralizing antibodies. | RSV A2 pre-F DS-Cav1 (NIH) |
| Recombinant G Protein (sG or domains) | Studying G-specific immune responses, glycan shield, and receptor binding. | RSV A2 G ectodomain (Native Antigen) |
| Anti-RSV F mAbs (Neutralizing) | Positive controls for neutralization assays; epitope mapping (sites Ø, V, III). | Palivizumab, Motavizumab, 5C4, D25 |
| Anti-RSV G mAbs (Various) | Probes for conserved vs. variable domain accessibility; neutralization studies. | Clones 3D3, 2D5, 131-2A |
| Glycanase Enzymes | Enzymatic removal of glycans to probe shield effect (O-glycanase, PNGase F). | New England Biolabs |
| CX3CR1-Expressing Cell Line | Functional assays for G protein attachment and inhibition. | Recombinant HEK293-CX3CR1 |
| RSV Reporter Virus | High-throughput neutralization assays (luciferase, GFP). | RSV-A2-GFP (Kerafast) |
Visualization: Pathways and Workflows
Diagram Title: Workflow for Comparing RSV G and F Protein Antigenic Stability
Diagram Title: G Protein's Glycosylation Shield Architecture
Comparative Analysis of RSV Glycoprotein Antigenic Stability
This comparison guide analyzes the antigenic stability of the Respiratory Syncytial Virus (RSV) Fusion (F) protein relative to the Attachment (G) protein, focusing on structural conservation, epitope presentation, and implications for vaccine and therapeutic development.
Antigenic & Structural Comparison: RSV F vs. G Proteins
Table 1: Core Characteristics and Antigenic Properties
| Feature | RSV F Glycoprotein | RSV G Glycoprotein |
|---|---|---|
| Primary Function | Mediates viral-host membrane fusion. | Facilitates initial attachment to host cells. |
| Protein Class | Class I viral fusion protein. | Type III transmembrane protein. |
| Conformational States | Prefusion (meta-stable), Postfusion (stable). | No major conformational rearrangement. |
| Sequence Conservation | High (>90% identity across RSV A/B). | Low, especially in the central mucin-like domain. |
| Epitope Conservation | Highly conserved neutralizing epitopes (e.g., sites Ø, V, II, IV). | Hypervariable, with strain-specific and genotype-specific epitopes. |
| Glycan Shield | Moderate, N-linked glycans. | Extensive O-linked and N-linked glycosylation. |
| Key Neutralizing Target | Dominant target for potent neutralizing antibodies (nAbs). | Target for nAbs, but responses are weaker and less consistent. |
| Antigenic Stability | High. Prefusion conformation presents conserved, vulnerable sites. | Low. Sequence variability and glycan shielding drive immune evasion. |
Supporting Experimental Data from Recent Studies
Table 2: Summary of Key Comparative Experimental Data
| Experiment Type | Findings on F Protein | Findings on G Protein | Implication |
|---|---|---|---|
| Structural Studies (Cryo-EM/X-ray) | Prefusion F structure reveals conserved antigenic sites Ø & V. | G protein core is conserved but obscured by a highly variable, glycosylated mucin domain. | F protein structure is ideal for rational immunogen design. |
| Neutralization Assays | mAbs targeting site Ø (e.g., D25, 5C4) show potent, cross-neutralizing activity against RSV A & B. | mAbs to G show limited breadth; neutralization is often strain-dependent. | F is the superior target for eliciting broad protection. |
| Human Serology | Prefusion F-specific antibodies correlate strongly with neutralization titers in human sera. | Anti-G antibody titers show poor correlation with neutralization potency. | Prefusion F is the primary determinant of protective humoral immunity. |
| Animal Challenge Studies | Prefusion F vaccines confer robust protection against heterologous and heterosubtypic challenge. | G-based vaccines induce protection that can be less broad and potent. | F's conserved nature enables broader vaccine efficacy. |
| Immune Evasion Analysis | Limited escape mutants; mutations at key epitopes often reduce viral fitness. | Rapid evolution under immune pressure; high tolerance for variation. | F is antigenically stable, reducing risk of vaccine escape. |
Detailed Experimental Protocols
Protocol 1: Surface Plasmon Resonance (SPR) for Epitope Conservation Analysis Objective: Quantify binding kinetics of monoclonal antibodies (mAbs) to F and G proteins from different RSV strains. Methodology:
- Immobilization: Purified prefusion F (e.g., DS-Cav1) or G protein core is immobilized on a CM5 sensor chip via amine coupling.
- Analyte Preparation: A series of mAbs (anti-site Ø, anti-site V, anti-G) are diluted in HBS-EP+ buffer.
- Binding Kinetics: mAbs are flowed over the chip surface at varying concentrations (e.g., 0.5-100 nM) at 30 µL/min.
- Data Analysis: Sensoryrams are fitted using a 1:1 Langmuir binding model to calculate association (ka) and dissociation (kd) rate constants. The equilibrium dissociation constant (KD = kd/ka) is derived.
- Cross-reactivity: The experiment is repeated with F/G proteins from phylogenetically distinct RSV A and B strains.
Protocol 2: Microneutralization Assay for Breadth Assessment Objective: Determine the cross-neutralizing potency of sera or mAbs against a panel of RSV strains. Methodology:
- Virus Panel: A panel of RSV clinical isolates (e.g., RSV A2, RSV B1, contemporary strains) is titrated.
- Serum/mAb Incubation: Two-fold serial dilutions of test samples are incubated with ~100 TCID50 of each virus for 1-2 hours at 37°C.
- Cell Infection: The mixture is added to HEp-2 or Vero cell monolayers in 96-well plates.
- Incubation & Detection: Plates are incubated for 3-5 days. Cytopathic effect (CPE) is scored microscopically, or infection is quantified by immunostaining (e.g., for RSV N protein).
- Analysis: The 50% neutralization titer (NT50) is calculated for each virus strain. Breadth is defined as the number of strains neutralized at a threshold NT50.
Visualization of Key Concepts
Title: RSV F vs. G: Structural Basis for Neutralization Breadth
Title: Antigenic Stability Assessment Workflow
The Scientist's Toolkit: Key Research Reagent Solutions
Table 3: Essential Reagents for RSV Glycoprotein Comparative Research
| Reagent / Material | Function / Purpose | Example & Notes |
|---|---|---|
| Stabilized Prefusion F Antigens | Key immunogen and reagent for structural studies and antibody characterization. | DS-Cav1 (RSV A) / SC-TM (RSV B): Mutations lock F in the prefusion conformation. |
| RSV G Protein (Core or Full) | Comparative antigen for binding and neutralization studies. | Recombinant G core (aa 130-230): Lacks the hypervariable mucin domain, reveals conserved structure. |
| Reference Monoclonal Antibodies | Critical positive controls for assays; define antigenic sites. | Anti-site Ø: D25, 5C4. Anti-site V: AM22. Anti-G: 131-2A, 3D3. |
| RSV Virus Strain Panel | For assessing the breadth of neutralization. | Should include historical (A2, B1) and contemporary circulating strains of both subgroups. |
| SPR or BLI Biosensor | Label-free quantitative analysis of antibody-antigen binding kinetics. | Biacore (SPR) or Octet (BLI) systems. Requires amine-coupling or anti-tag capture chips. |
| Neutralization Assay Cell Line | Permissive cells for virus infection and neutralization readout. | HEp-2 cells: Standard for RSV. Vero cells: Often used for plaque-reduction tests. |
| Cryo-EM Grids & Vitrobot | For high-resolution structural determination of antigen-antibody complexes. | Quantifoil grids. Vitrobot standardizes ice thickness for optimal sample preparation. |
| Adjuvants for Animal Studies | To enhance immunogenicity of protein immunogens in preclinical models. | AS01B, MF59: Used in prefusion F vaccine studies to boost potent responses. |
This comparison guide evaluates the antigenic stability of the Respiratory Syncytial Virus (RSV) fusion (F) and attachment (G) proteins under immune selective pressure. A core thesis in RSV research posits that the F protein is a superior target for intervention due to its higher conservation, a direct result of differential evolutionary constraints. This guide compares the performance of F and G as antigenic targets, supported by experimental data.
Table 1: Comparative Antigenic & Genetic Landscape of RSV F and G Proteins
| Feature | RSV F Protein | RSV G Protein | Experimental Support & Implication |
|---|---|---|---|
| Genetic Variability | Highly conserved (<5% aa divergence between RSV A & B). | Highly variable (up to 55% aa divergence between RSV A & B). | Sequencing of clinical isolates shows G evolves ~4x faster than F. |
| Immune Selection Driver | Strong functional constraint for membrane fusion. | Immune escape via sequence hypervariation in the central conserved domain. | Phylodynamic analyses identify positive selection sites predominantly in G. |
| Key Neutralizing Epitopes | Well-defined, conserved sites Ø (pre-F specific), I-V. | Poorly defined, strain-dependent; limited cross-neutralization. | mAb competition assays and cryo-EM structures map epitopes on pre-F. |
| Impact of Glycosylation | Conserved N-linked sites shield conserved epitopes. | Extensive and variable O-/N-linked glycosylation creates a glycan shield. | Glycan deletion mutants show increased antibody accessibility for G. |
| Therapeutic Outcome | High barrier to resistance; target for all approved mAbs/vaccines. | High escape potential; not a successful target for licensed interventions. | In vitro escape studies with palivizumab (anti-F) vs. anti-G mAbs. |
Experimental Protocols
1. Phylodynamic Analysis for Positive Selection
- Objective: Identify codons under diversifying positive selection in F and G genes.
- Method: Codon-aligned sequences from global surveillance databases are analyzed using algorithms (e.g., FEL, MEME, or FUBAR) within phylogenetic software (HyPhy, Datamonkey). Sites with a statistically significant excess of non-synonymous over synonymous substitutions indicate positive selection.
2. In Vitro Viral Escape Assay
- Objective: Compare the resistance development rate against F-targeting vs. G-targeting monoclonal antibodies.
- Method: RSV is passaged in cell culture (e.g., HEp-2 cells) under increasing sub-neutralizing concentrations of a mAb. Viral supernatant is sequenced at each passage to identify emerging mutations. The number of passages required for breakthrough is recorded.
3. Cross-Neutralization Assay
- Objective: Assess the breadth of serum or mAb neutralization against diverse RSV strains.
- Method: Pseudotyped viruses or historical clinical isolates expressing matched or mismatched F/G proteins are incubated with serial dilutions of test antibody/serum. Neutralization titers (IC50/IC80) are determined via plaque reduction or luminescence-based assays. A >4-fold drop in titer indicates antigenic drift.
Visualizations
Title: Immune Selection Drives Divergent F and G Protein Evolution
Title: Workflow for Comparative Genetic Analysis of F and G
The Scientist's Toolkit: Research Reagent Solutions
| Item | Function in F/G Comparative Research |
|---|---|
| Stabilized Pre-F Protein (DS-Cav1) | Recombinant antigen for structural studies and measuring pre-F specific neutralizing antibodies. |
| RSV G Protein (Cytoplasmic Tail Deleted) | Soluble recombinant G protein for binding assays and polyclonal serum adsorption studies. |
| Strain-Panel Pseudovirus Kit | Replication-deficient viruses expressing matched/mismatched F and G from historical strains for neutralization breadth assays. |
| Anti-RSV F mAb Panel (e.g., D25, AM22, 5C4) | Site Ø/V-specific antibodies for epitope mapping and competition assays. |
| Anti-RSV G mAbs (e.g., 2D10, 3D3) | Strain-specific G antibodies for escape mutant selection experiments. |
| Glycosidase Enzymes (PNGase F, O-glycosidase) | Enzymes to remove N- or O-linked glycans from protein lysates to assess glycan shielding effects. |
| HyPhy/Datamonkey Platform | Bioinformatics software suite for phylogenetic analysis and detecting positive selection. |
Quantifying Antigenic Drift: Assays and Models to Measure Protein Stability
This guide compares the performance of leading in silico tools for phylogenetic analysis and B-cell epitope prediction, framed within research on the antigenic stability of Respiratory Syncytial Virus (RSV) G and F proteins. A core thesis posits that the F protein's conserved nature makes it a superior vaccine target compared to the highly variable G protein. Validating this requires robust computational analysis of genetic evolution and antigenic epitope conservation, areas where these tools are indispensable.
Performance Comparison of Phylogenetic Analysis Tools
Phylogenetic tools are critical for quantifying the genetic divergence and evolutionary rates of RSV F and G proteins.
Table 1: Comparison of Phylogenetic Analysis Software
| Tool | Algorithm (Default) | Speed (Benchmark*) | Best For RSV Analysis? | Key Metric for Antigenic Stability |
|---|---|---|---|---|
| IQ-TREE 2 | Maximum Likelihood (ML) | Very Fast (100 sequences, ~2 min) | Yes | ModelFinder for best-fit substitution model (e.g., JTT+G+I for F protein). |
| RAxML-NG | Maximum Likelihood (ML) | Fast (100 sequences, ~5 min) | Yes | High bootstrap support values for clade certainty. |
| BEAST 2 | Bayesian MCMC | Very Slow (100 sequences, hours-days) | For dated phylogenies | Estimated rate of evolution (subs/site/year) directly compares G vs. F. |
| MEGA 11 | Neighbor-Joining, ML | Moderate (100 sequences, ~10 min) | Accessibility | Integrated suite for distance calculation and tree visualization. |
| Nextstrain (Augur) | Parsimony/ML | Fast for pipelines | Real-time surveillance | Direct visualization of geographic/temporal spread of G vs. F variants. |
*Benchmark: Approximate wall-clock time for a ~100 amino acid sequence alignment on a standard workstation.
Experimental Protocol for Phylogenetic Analysis:
- Sequence Retrieval: Curate RSV F and G protein sequences from NCBI Virus or GISAID spanning 10+ years.
- Alignment: Use MAFFT (L-INS-i algorithm) for multiple sequence alignment. Visually inspect with AliView.
- Model Selection: In IQ-TREE 2, run
iqtree -s alignment.fasta -m MFPto determine optimal substitution model via BIC. - Tree Inference: Construct ML tree:
iqtree -s alignment.fasta -m JTT+G+I -b 1000 -alrt 1000(with 1000 ultrafast bootstraps). - Analysis: Calculate mean genetic distances (p-distance) in MEGA 11 between temporal samples for F and G separately.
- Bayesian Dating (Optional): Use BEAST 2 with a relaxed clock model to estimate evolutionary rates for G and F genes.
Title: Phylogenetic Analysis Workflow for RSV Proteins
Performance Comparison of Epitope Prediction Algorithms
B-cell epitope prediction tools help map conserved surface regions, directly informing vaccine design against stable antigenic sites.
Table 2: Comparison of B-Cell Epitope Prediction Servers
| Tool | Method | Accuracy (Benchmark) | RSV Application | Key Output for Thesis |
|---|---|---|---|---|
| IEDB BepiPred-2.0 | LSTM on antibody epitopes | AUC ~0.65 (DiscoTope-2) | Primary Screening | Linear epitope propensity score across G & F sequences. |
| DiscoTope-3.0 | 3D structure & sequence | AUC ~0.78 (on benchmark) | Best for F Protein | Conformational epitopes on prefusion F crystal structure. |
| Ellipro | Thornton's method (PI) | Moderate | Conserved Region ID | Estimates conserved, surface-accessible epitopes. |
| ABCpred | Recurrent Neural Network | AUC ~0.67 | Linear Epitope Scan | 16-mer linear epitope predictions. |
| EpiScan | Variant cross-reactivity | N/A | Critical for G protein | Predicts impact of G protein variation on antibody binding. |
Experimental Protocol for Epitope Conservation Analysis:
- Target Selection: Use prefusion RSV F protein structure (PDB: 4JHW) and consensus G protein sequence.
- Linear Epitope Prediction: Run BepiPred-2.0 via IEDB server on aligned F and G sequences. Threshold: score > 0.55.
- Conformational Epitope Prediction: Submit 4JHW to DiscoTope-3.0 server. Identify top-scoring patches.
- Conservation Mapping: Use ConSurf to map phylogenetic conservation scores onto the 3D structure.
- Overlay Analysis: Superimpose DiscoTope-predicted epitopes with ConSurf conservation scores in PyMOL. Identify predicted epitopes with high conservation (score >= 8 on ConSurf).
- Variant Analysis (G protein): Use EpiScan to input known G protein escape mutants and predict B-cell reactivity loss.
Title: Computational Epitope Prediction Logic for RSV F vs. G
The Scientist's Toolkit: Research Reagent Solutions
| Item / Resource | Function in RSV Antigenic Stability Research | Example / Source |
|---|---|---|
| RSV Protein Sequence Database | Source of raw genetic data for phylogenetic and epitope analysis. | NCBI Virus, GISAID EpiRSV |
| Reference 3D Structures | Essential for conformational B-cell epitope prediction. | PDB IDs: 4JHW (Prefusion F), 2WJ8 (G core) |
| Multiple Sequence Alignment Tool | Aligns homologous sequences for comparative analysis. | MAFFT, Clustal Omega, MUSCLE |
| Phylogenetic Inference Software | Reconstructs evolutionary relationships and calculates divergence. | IQ-TREE 2, BEAST 2 |
| B-Cell Epitope Prediction Server | Predicts regions likely recognized by antibodies. | IEDB (BepiPred-2.0, DiscoTope-3.0) |
| Protein Conservation Analysis Server | Maps evolutionary conservation onto sequences/structures. | ConSurf |
| Molecular Visualization Software | Visualizes epitope locations on 3D structures. | PyMOL, ChimeraX |
| High-Performance Computing (HPC) Cluster | Runs computationally intensive Bayesian phylogenetics/machine learning. | Local university cluster, Cloud computing (AWS, GCP) |
Within the broader thesis investigating the antigenic stability comparison between RSV G and F proteins, selecting the appropriate serological assay to quantify strain cross-reactivity is critical. This guide objectively compares two gold-standard virological assays: Microneutralization (MN) and Plaque Reduction Neutralization Tests (PRNT).
Comparative Performance: MN vs. PRNT
The choice between MN and PRNT hinges on the specific research question, throughput needs, and required precision. The table below summarizes key performance characteristics based on published data and established protocols.
Table 1: Assay Comparison for RSV Strain Cross-Reactivity Studies
| Parameter | Microneutralization (MN) | Plaque Reduction Neutralization (PRNT/PRNT₅₀) |
|---|---|---|
| Primary Readout | Inhibition of cytopathic effect (CPE) or immunostaining signal. | Reduction in plaque-forming units (PFU). |
| Throughput | Higher (amenable to 96/384-well plate formats). | Lower (6/12/24-well plate formats). |
| Turnaround Time | ~2-3 days (RSV A2). | ~5-7 days (requires plaque formation and staining). |
| Quantification | Endpoint titer (e.g., NT₅₀) or half-maximal inhibitory concentration (IC₅₀). | Plaque reduction neutralization titer (PRNT₅₀, PRNT₉₀). |
| Subjectivity | Lower with quantitative immunostaining. | Higher, dependent on accurate plaque identification/counting. |
| Key Advantage | Suitable for large-scale serosurveys and high-titer monoclonal antibody screening. | Considered the "gold standard" for functional neutralizing antibody titers; visual confirmation. |
| Key Limitation | May not correlate perfectly with PRNT₅₀ for low-titer sera. | Labor-intensive, low throughput, higher reagent/cell usage. |
| Optimal Use Case | Rapid comparison of cross-reactivity across many serum samples/variants. | Definitive confirmation of neutralization potency and cross-reactivity for lead candidates. |
Supporting Data Context: A pivotal study comparing neutralization of RSV A2 vs. lineage-matched clinical isolates demonstrated a strong correlation (R²=0.89) between MN (IC₅₀) and PRNT₅₀ titers for monoclonal antibodies targeting the pre-F protein. However, for polyclonal sera from vaccinated animals, the MN assay showed a statistically significant 2.1-fold average decrease in titer against a heterologous strain compared to PRNT₅₀, highlighting assay-dependent sensitivity in cross-reactivity assessments.
Detailed Experimental Protocols
Protocol 1: Microneutralization Assay (with Immunostaining)
- Virus & Cell Preparation: Grow RSV strains (e.g., A2, BA, ON1) in HEp-2 or Vero cells. Titrate to determine TCID₅₀. Seed 96-well plates with Vero cells (1.5x10⁴ cells/well) 24h prior.
- Serum/Antibody Dilution: Prepare 3- or 4-fold serial dilutions of test samples in duplicate in infection medium.
- Virus Neutralization: Mix equal volumes of each serum dilution with a pre-titrated RSV inoculum (~100 TCID₅₀/well). Incubate (1-2h, 37°C).
- Infection: Transfer virus-antibody mixtures onto cell monolayers. Include virus-only (no antibody) and cell-only controls.
- Incubation: Incubate (3-5 days, 37°C, 5% CO₂) until clear CPE is observed in virus controls.
- Fixation & Staining: Fix cells with 80% acetone. Detect RSV-infected cells using a primary antibody (e.g., mouse anti-RSV F protein), followed by an enzyme-conjugated secondary antibody (e.g., HRP-anti-mouse) and a chromogenic substrate (e.g., AEC).
- Analysis: Image plates with an ELISA spot reader or microscope. Calculate the NT₅₀ or IC₅₀ using non-linear regression (e.g., 4-parameter logistic model) from the percentage of neutralization.
Protocol 2: Plaque Reduction Neutralization Test (PRNT₅₀)
- Cell Seeding: Seed 12- or 24-well plates with Vero cells to achieve 100% confluency at assay time.
- Serum-Virus Incubation: Prepare serial dilutions of heat-inactivated test sera. Mix a fixed volume (e.g., 150 µL) of each dilution with an equal volume of virus diluted to yield ~50-80 PFU/well. Incubate (1-2h, 37°C).
- Inoculation: Aspirate media from cell monolayers. Add the serum-virus mixture (in duplicate/triplicate) to each well. Adsorb (1-2h, 37°C, with gentle rocking).
- Overlay: Remove inoculum and overlay cells with a semi-solid medium (e.g., 1% methylcellulose or 0.8% Avicel in maintenance medium).
- Incubation: Incubate (5-7 days, 37°C, 5% CO₂) to allow plaque development.
- Plaque Visualization: Remove overlay, fix cells with formaldehyde or methanol, and stain with crystal violet or immunostain using an anti-RSV antibody for enhanced sensitivity.
- Analysis: Count plaques. The PRNT₅₀ titer is the serum dilution that reduces plaque count by 50% compared to virus-only controls, calculated via probit or non-linear regression analysis.
Visualization of Assay Workflows
MN vs. PRNT Assay Selection and Workflow
The Scientist's Toolkit: Key Research Reagent Solutions
Table 2: Essential Reagents for RSV Cross-Reactivity Neutralization Assays
| Reagent/Material | Function & Role in Assay | Example & Notes |
|---|---|---|
| Cell Line | Provides susceptible host cells for RSV infection and replication. | Vero (ATCC CCL-81) or HEp-2 cells. Vero cells often preferred for PRNT due to clear plaque morphology. |
| Reference RSV Strains | Antigenic standards for comparison against clinical/variant strains. | RSV A2 (prototype), RSV B1. Include contemporary strains (e.g., GA2, ON1, BA) for cross-reactivity. |
| Virus Growth Medium | Supports viral propagation and maintenance during assay. | DMEM or MEM supplemented with 2-5% FBS, L-glutamine, and antibiotics. |
| Semi-Solid Overlay (PRNT) | Restricts virus spread to allow discrete plaque formation. | Methylcellulose or Avicel (RC-581) in maintenance medium. |
| Anti-RSV Antibody (Detection) | Enables specific detection of RSV-infected cells in MN or immunostained PRNT. | Mouse monoclonal anti-RSV F protein (e.g., clone 131-2A). Critical for quantifying neutralization. |
| Detection System | Visualizes antibody-bound, infected cells. | HRP-conjugated secondary antibody with AEC substrate, or fluorescent conjugate for automated imaging. |
| Neutralization Standard | Controls for inter-assay variability; validates sensitivity. | WHO International Standard for anti-RSV antibody (NIBSC 16/284) or a well-characterized human monoclonal antibody (e.g., Palivizumab). |
| Data Analysis Software | Calculates neutralization titers from raw data (OD, plaque counts). | PRISM (GraphPad), SigmaPlot; or dedicated immunology software (e.g., ELISA/PRNT calculator). |
This guide objectively compares Cryo-Electron Microscopy (Cryo-EM) and X-ray Crystallography for determining the high-resolution structures of antigen-antibody complexes. The analysis is framed within ongoing research on the comparative antigenic stability of Respiratory Syncytial Virus (RSV) G and F proteins, crucial for vaccine and therapeutic antibody design.
Technique Comparison and Performance Data
The following table summarizes the core performance characteristics of both techniques, synthesized from recent literature and experimental benchmarks.
Table 1: Comparative Performance of Cryo-EM and X-ray Crystallography for Antigen-Antibody Complexes
| Parameter | X-ray Crystallography | Cryo-EM (Single-Particle Analysis) |
|---|---|---|
| Typical Resolution Range | 1.0 – 3.5 Å | 2.5 – 4.5 Å (State-of-the-art: 1.8-2.5 Å) |
| Sample Requirement | High-purity, homogeneous, crystallizable complex. | High-purity, homogeneous complex; tolerates some heterogeneity. |
| Sample State | Static crystal lattice. | Solution state, frozen-hydrated (vitreous ice). |
| Size Suitability | Typically < 500 kDa. Challenging for flexible complexes. | Excellent for > 150 kDa. Suitable for large, flexible complexes. |
| Key Advantage | Atomic detail, precise bonding information, high throughput. | No crystallization needed, captures multiple conformational states. |
| Key Limitation | Requires crystallization; crystal packing may distort epitopes. | Lower resolution for small targets; requires significant data processing. |
| Data Collection Time | Hours to days (synchrotron). | Days to weeks. |
| Primary Output | Atomic model from electron density map. | Atomic model from 3D electrostatic potential map. |
Experimental Protocols for RSV Antigen-Antibody Complexes
Protocol 1: X-ray Crystallography of RSV F-protein Fab Complex
- Complex Formation & Purification: Purified, prefusion-stabilized RSV F protein is incubated with a 1.2 molar excess of antigen-binding fragment (Fab). The complex is purified via size-exclusion chromatography (SEC) in a low-salt buffer (e.g., 20 mM Tris pH 8.0, 50 mM NaCl).
- Crystallization: Screening is performed via vapor diffusion (sitting drop). A common condition: 0.1 M HEPES pH 7.5, 10% PEG 8000, 8% ethylene glycol. Microseeding is often required.
- Data Collection & Processing: A crystal is flash-cooled in liquid N₂. Data collected at a synchrotron (100 K) is indexed, integrated, and scaled (e.g., with XDS, AIMLESS).
- Structure Solution: Molecular replacement is performed using known F protein and Fab structures (Phaser). The model is refined (phenix.refine, BUSTER) with iterative manual building (Coot).
Protocol 2: Cryo-EM of RSV G-protein Nanobody Complex
- Grid Preparation: The RSV G protein ectodomain complexed with a neutralizing nanobody is applied to a glow-discharged holey carbon grid (Quantifoil R1.2/1.3), blotted, and plunge-frozen in liquid ethane (Vitrobot, 4°C, 100% humidity).
- Data Collection: Movies are collected on a 300 kV cryo-TEM (e.g., Titan Krios) with a Gatan K3 detector in counting mode. A defocus range of -0.8 to -2.5 µm is used. Total exposure ~50 e⁻/Ų.
- Image Processing: Motion correction (MotionCor2) and CTF estimation (Gctf). Particles are picked (BlocRes, crYOLO), extracted, and subjected to 2D classification. Multiple rounds of 3D classification (CryoSPARC/Relion) are used to isolate bound complexes. Homogeneous subsets are refined and sharpened.
- Model Building & Refinement: An initial model is docked into the map and real-space refined (ISOLDE, phenix.realspacerefine).
Visualizing Workflow and Context
Title: Structural Biology Workflow for RSV Antigen-Antibody Complexes
The Scientist's Toolkit: Key Research Reagent Solutions
Table 2: Essential Materials for Structural Studies of RSV Antigen-Antibody Complexes
| Reagent/Material | Function in Experiment | Example/Note |
|---|---|---|
| Prefusion-Stabilized RSV F Protein | Antigen target for complex formation. Maintains the neutralization-sensitive pre-fusion conformation. | DS-Cav1 or SC-TM variants. Critical for relevant epitope display. |
| RSV G Protein Ectodomain | Antigen target for G-specific studies. Often includes the central conserved domain. | Mosaic or trimeric constructs to mimic native presentation. |
| Therapeutic Fabs or Nanobodies | High-affinity binding partners for co-structure determination. | Palivizumab-derivatives, D25, or novel clones from phage display. |
| Size-Exclusion Chromatography (SEC) Column | Final purification step for homogeneous antigen-antibody complexes. | Superdex 200 Increase, 10/300 GL for analytical or preparative runs. |
| Crystallization Screening Kits | To identify initial conditions for crystal growth of complexes. | JCGSG+, MemGold, or PEG/Ion screens. |
| Holey Carbon Grids (Cryo-EM) | Support film for vitrified, thin ice layers containing the sample. | Quantifoil (Cu R1.2/1.3, 300 mesh) or UltrAuFoil gold grids. |
| Vitrification Robot | Standardized, reproducible plunge-freezing of samples for Cryo-EM. | Thermo Fisher Vitrobot or Leica EM GP. Controls blot time, humidity. |
| Negative Stain Reagents | Rapid validation of complex formation and sample homogeneity pre-Cryo-EM. | Uranyl acetate or methylamine tungstate (Nano-W). |
This guide compares the performance of different antigenic characterization methods within longitudinal surveillance programs, framed by the thesis that the Respiratory Syncytial Virus (RSV) fusion (F) protein exhibits greater antigenic stability than the attachment (G) protein, making it a more reliable target for intervention strategies.
Comparison of Antigenic Characterization Methods
Table 1: Comparison of Core Antigenic Characterization Techniques for Longitudinal Surveillance
| Method | Primary Output | Throughput | Quantitative Precision | Key Advantage for Surveillance | Key Limitation |
|---|---|---|---|---|---|
| Plaque Reduction Neutralization Test (PRNT) | Neutralizing antibody titer (NT50/90) | Low | High | Gold standard functional readout; measures potent neutralizing activity. | Labor-intensive, low throughput, subjective plaque counting. |
| Focus Reduction Neutralization Test (FRNT) | Neutralizing antibody titer (FRNT50/90) | Medium-High | High | Higher throughput than PRNT; automated readout possible. | Requires specific imaging/analysis equipment. |
| Microneutralization (MN) Assay | Neutralization percentage or titer | Medium | Medium | Scalable for larger serum panels; uses standard lab equipment. | Can be less sensitive than PRNT/FRNT. |
| Hemagglutination Inhibition (HAI)* | Inhibitory titer (HAI titer) | High | Low-Medium | Very high throughput; low cost. | Only applicable to specific viruses (e.g., influenza); not for RSV. |
| Antigenic Cartography | Antigenic map distance (AU) | N/A (Analysis) | High (Comparative) | Visualizes evolutionary relationships; quantifies antigenic drift. | Dependent on underlying neutralization data quality. |
*Included for general virology context; not applicable to RSV.
Table 2: Illustrative Longitudinal Surveillance Data: RSV F vs. G Protein Antigenic Drift
| Study Period | Protein Analyzed | Cumulative Antigenic Distance (from baseline season) | Key Amino Acid Substitutions Identified | Impact on Vaccine/Efficacy mAb Neutralization (Fold-Change) |
|---|---|---|---|---|
| 2015-2018 | F Protein | 2.1 - 3.5 Antigenic Units (AU) | K201R, S190N, N276S, S398F | Palivizumab: <2-fold change. Pre-F mAbs (e.g., Suptavumab): 2-5 fold change in rare variants. |
| 2015-2018 | G Protein | 8.7 - 12.4 Antigenic Units (AU) | Extensive changes in Central Conserved Domain (CCD) and hypervariable regions. | Not directly quantified; high genetic variability implies low antigenic stability. |
| 2019-2023 | F Protein | 3.8 - 4.9 Antigenic Units (AU) | I206M, D294N, S398L | Current Pre-F targeting mAbs (Nirsevimab): <4-fold change for vast majority of isolates. |
| 2019-2023 | G Protein | >15 Antigenic Units (AU) | Continued diversification; emergence of novel genotypes. | N/A |
Experimental Protocols
1. Plaque Reduction Neutralization Test (PRNT) for Serum Cross-Reactivity
- Objective: Quantify the potency of sera (e.g., post-vaccination or convalescent) against historical and contemporary viral isolates.
- Protocol:
- Serum Preparation: Heat-inactivate test sera at 56°C for 30 minutes. Perform serial two-fold dilutions in cell culture medium.
- Virus-Serum Incubation: Mix equal volumes of diluted serum with a challenge virus (e.g., 100 plaque-forming units (PFU) of RSV A2 or clinical isolate). Incubate at 37°C for 1 hour.
- Infection: Add the virus-serum mixture to confluent Vero or HEp-2 cell monolayers in 12-well plates. Adsorb for 1-2 hours with gentle rocking.
- Overlay: Replace inoculum with a semi-solid overlay (e.g., methylcellulose or agarose in maintenance medium).
- Incubation & Staining: Incubate plates for 4-7 days. Fix cells with formaldehyde and stain plaques with crystal violet or immunostain with RSV-specific antibodies.
- Analysis: Count plaques. The PRNT50/90 titer is the serum dilution that reduces plaques by 50% or 90% compared to virus-only controls.
2. Antigenic Cartography Workflow
- Objective: Create a quantitative map of antigenic relationships between viral isolates.
- Protocol:
- Data Generation: Perform cross-neutralization assays (e.g., FRNT) using a panel of post-infection ferret sera (raised against key historical strains) against all contemporary and historical isolates.
- Titer Table Construction: Compile a table of log2(FRNT50) titers, with antigens as columns and sera as rows.
- Dimensionality Reduction: Use multidimensional scaling (MDS) algorithms to position antigens and sera on a 2D map where distances optimally represent the log2 titer differences.
- Map Interpretation: The distance between two virus points (in Antigenic Units, AU) corresponds to their antigenic difference. A distance of 1 AU typically represents a 2-fold change in neutralization titer across multiple sera.
Visualizations
Title: Antigenic Cartography Data Workflow
Title: Evidence Map for RSV F vs. G Antigenic Stability Thesis
The Scientist's Toolkit: Research Reagent Solutions
Table 3: Essential Reagents for Antigenic Surveillance of RSV
| Reagent/Material | Function in Surveillance | Example/Note |
|---|---|---|
| Reference Sera Panels | Gold standard for antigenic comparison; measure cross-reactivity. | Post-infection ferret sera against key historic strains (e.g., RSV A2, Long, 9320). |
| Clinical Virus Isolates | Represent circulating strains for phenotypic testing. | Must be minimally passaged in cell culture to avoid adapting mutations. |
| Recombinant RSV F & G Proteins | Standardized antigens for binding assays (ELISA) to dissect humoral responses. | Pre-fusion stabilized F (DS-Cav1) is critical for vaccine-relevant antibody assessment. |
| Monoclonal Antibodies (mAbs) | Probes for specific epitope availability and conservation. | Palivizumab (site II), Motavizumab (site II), Nirsevimab (site Ø), D25 (site Ø). |
| Cell Lines for Neutralization | Host cells for PRNT/FRNT/MN assays. | HEp-2 cells (native RSV receptor), Vero cells (commonly used, interferon-deficient). |
| Next-Generation Sequencing (NGS) Reagents | For genomic surveillance and identifying amino acid substitutions. | Pan-RSV amplicon sequencing kits for whole-genome coverage from isolates. |
| Antigenic Cartography Software | Analyzes neutralization data to generate quantitative antigenic maps. | Racmacs (R package) or similar computational tools. |
Within the broader thesis on the antigenic stability of RSV G and F proteins, evaluating vaccine candidates requires robust animal models that can predict protection against genetically diverse, heterologous virus challenges. This guide compares the performance of key preclinical models and their correlates of protection.
Comparison of Animal Models for Heterologous RSV Challenge Studies
| Animal Model | Key Challenge Strain(s) | Primary Readout (Correlate) | Protection Against Heterologous Challenge (F vs. G-based) | Quantitative Data Summary |
|---|---|---|---|---|
| Cotton Rat | RSV A2 (Lineage A) / RSV B1 (Lineage B) | Lung Viral Titers (Day 4-5 post-challenge) | Prefusion F (Pre-F): >2.0 log10 reduction vs. both lineages.G Protein: ~1.0-1.5 log10 reduction, strain-dependent. | Pre-F IgG (≥ log10 2.7) correlates with 100% protection (≥1.0 log10 reduction). G-specific Ab correlates poorly. |
| BALB/c Mouse | RSV A (e.g., A2) / RSV B (e.g., 18537) | Lung Viral Load (qPCR, plaque assay) | Pre-F: Strong, broad neutralization. >4.0 log10 reduction in A, >3.5 in B.G: Limited cross-lineage protection; ~1.8 log10 reduction. | Serum Neutralizing Titers (SNT) ID50: Pre-F (>10^4) vs. G (~10^2-10^3). Th1-skewed cellular response critical. |
| Calf Model (Bovine RSV) | Heterologous bRSV field strains | Clinical score, nasal shedding, lung pathology | F Protein: Consistent reduction in shedding and severe pathology.G Protein: Partial clinical protection, less reduction in viral load. | F-specific SNT titers >256 correlate with reduced shedding duration (from 10 to 4 days). |
| African Green Monkey (NHP) | RSV A / RSV B clinical isolates | Nasopharyngeal viral replication (qPCR) | Pre-F: Potent, cross-reactive neutralization. ~3.0 log10 reduction in AUC.G: Minimal impact on heterologous challenge replication. | Pre-F ELISA titers and SNT show strong inverse correlation (r=-0.89) with AUC of viral replication. |
Experimental Protocols for Key Cited Studies
1. Protocol: Cotton Rat Heterologous Challenge
- Immunization: Animals (n=8/group) immunized intramuscularly (IM) with 10μg of purified Pre-F protein, G protein, or adjuvant control at days 0 and 28.
- Serology: Serum collected at day 42 for RSV-specific IgG ELISA and plaque reduction neutralization test (PRNT) against RSV A and B strains.
- Challenge: At day 56, animals are challenged intranasally (IN) with 10^6 PFU of a heterologous RSV B lineage strain.
- Necropsy & Titration: Lungs harvested on day 5 post-challenge. Homogenized lung tissue is plaque-assayed on HEp-2 cells to determine viral titer (log10 PFU/g).
2. Protocol: BALB/c Mouse T-Cell Response Analysis
- Prime/Boost: Mice (n=10/group) immunized with plasmid DNA or viral vector expressing F or G at weeks 0 and 3.
- Challenge: Mice challenged IN with 10^7 PFU heterologous strain at week 6.
- Sample Collection: Lungs and spleens harvested 5 days post-challenge.
- ICS & ELISA: Lung mononuclear cells stimulated with RSV peptide pools (F vs. G). Intracellular cytokine staining (ICS) for IFN-γ, IL-4, TNF-α. Bronchoalveolar lavage (BAL) analyzed for cytokines by multiplex ELISA.
- Viral Load: Lung RNA extracted for qPCR measuring RSV N gene copies.
Visualization of Experimental and Immunologic Pathways
The Scientist's Toolkit: Key Research Reagent Solutions
| Reagent/Material | Function in Heterologous Challenge Studies | Example/Target |
|---|---|---|
| Stabilized Prefusion F Protein | Gold-standard immunogen to elicit broad, potent neutralizing antibodies for protection correlation. | DS-Cav1, SC-TM mutants |
| Recombinant G Protein (ECD) | Immunogen to evaluate strain-specific and cross-reactive, non-neutralizing protective responses. | Recombinant G from RSV A and B lineages |
| RSV A & B Challenge Stocks | Genetically defined, heterologous virus pools for in vivo challenge to test breadth of protection. | RSV A2 (Lineage A), RSV B/18537 (Lineage B) |
| Plaque Reduction Neutralization Test (PRNT) | Assay to quantify serum neutralizing antibody titers against homologous and heterologous strains. | Performed on HEp-2 or Vero cells |
| RSV-Specific Peptide Pools | Stimulate T-cells for ICS to dissect F-specific vs. G-specific cellular immune correlates. | Overlapping peptides spanning F or G protein sequences |
| Species-Specific Cytokine ELISA/Multiplex | Quantify cytokine profiles in BAL/sera to characterize Th1/Th2/Th17 skewing of immune response. | IFN-γ, IL-4, IL-5, IL-13, IL-17A assays |
| RSV qPCR Assay | Sensitive quantification of viral load in lung tissue post-challenge, independent of virus lineage. | Primers/probes targeting conserved RSV N or L gene |
Navigating the Pitfalls: Challenges in Targeting the RSV G Protein for Immunization
Within the broader research thesis comparing the antigenic stability of the Respiratory Syncytial Virus (RSV) attachment (G) and fusion (F) proteins, a critical consideration is the neutralization breadth elicited by immunity targeting each antigen. This guide compares the performance of G-protein-targeting versus F-protein-targeting immunogens in generating broadly neutralizing antibodies (bNAbs), supported by experimental data.
Comparison of Neutralization Breadth: RSV G vs. F Protein Immunogens
| Parameter | G-Protein-Targeted Immunity | F-Protein-Targeted Immunity | Supporting Experimental Summary |
|---|---|---|---|
| Primary Antigenic Character | High variability, especially in the central conserved domain (CCD). Antigenic sites are strain-dependent. | High conservation. Key neutralization sites (Ø, V, III, IV) are preserved across RSV A/B strains and subgroups. | Cryo-EM and sequence alignment show >90% conservation in F pre-fusion epitopes vs. ~50% in G-protein ectodomains. |
| Typical Neutralization Breadth | Narrow. Antibodies often neutralize homologous strains (e.g., RSV A2) but show weak or no activity against heterologous strains (e.g., RSV B) or clinical isolates. | Broad. Potent neutralization across both RSV A and B subgroups, and diverse clinical isolates. | Palivizumab (anti-F site II) shows cross-subgroup activity. Pre-F-specific bNAbs like D25 and AM22 neutralize >90% of tested strains. |
| Mechanism of Escape | High propensity for escape via point mutations and glycosylation changes in the CCD, without fitness cost. | Escape mutations in key bNAb epitopes (e.g., site Ø) often impair viral fitness and fusion function. | In vitro escape studies with anti-G mAbs yield resistant mutants rapidly. Anti-F bNAb escape mutants show reduced infectivity and replication. |
| Correlate of Protection | Strain-specific binding antibody titers. Poor correlation with cross-neutralization. | Serum neutralization titer (NT50/IC50) against a heterologous virus is a strong correlate. | Clinical study meta-analysis shows F-protein antibody levels correlate with protection; G-protein antibodies show inconsistent correlation. |
Key Experimental Protocols
Neutralization Breadth Assay (Microneutralization):
- Method: Serum or monoclonal antibodies (mAbs) are serially diluted and incubated with a standardized inoculum (e.g., 100 TCID50) of diverse RSV strains (e.g., RSV A/Long, A/Taylor, B/Washington, clinical isolates). The mixture is added to HEp-2 or Vero cell monolayers in 96-well plates. After incubation (1-2 hours), the inoculum is replaced with overlay medium. Plaques or viral cytopathic effect (CPE) are quantified after 4-7 days by immunostaining or microscopy. The 50% neutralization titer (NT50) is calculated for each virus strain.
- Purpose: Directly compares the potency and breadth of neutralization across genotypes.
In Vitro Viral Escape Mutant Selection:
- Method: RSV (e.g., strain A2) is passaged in the presence of sub-neutralizing concentrations of a mAb (anti-G or anti-F). Viral growth is monitored. Surviving virus is plaque-purified and sequenced (whole-genome or target gene) to identify escape mutations. The fitness of escape mutants is assessed by growth kinetics compared to wild-type.
- Purpose: Evaluates the genetic barrier to resistance and the functional constraint of antigenic sites.
Visualization: Comparative Immunogen Performance Workflow
Diagram Title: Workflow Comparing G vs F Protein Immunogen Outcomes
The Scientist's Toolkit: Key Research Reagents
| Reagent / Material | Function in RSV Neutralization Breadth Research |
|---|---|
| Stabilized Pre-Fusion F (Pre-F) Proteins (e.g., DS-Cav1, SC-TM) | Recombinant immunogens that preserve neutralization-sensitive epitopes. Essential for eliciting bNAbs in animal models. |
| Recombinant G Protein Ectodomains (Strain-specific & chimeric) | Used to assess strain-specific antibody binding and map variable vs. conserved region responses. |
| RSV Reporter Viruses (Luciferase, GFP-expressing) | Enable high-throughput, quantitative neutralization assays across diverse strains without plaque counting. |
| Panel of Diverse RSV Strains (A/B subgroups, historical & contemporary clinical isolates) | Critical for empirically defining neutralization breadth, moving beyond prototype lab strains. |
| Monoclonal Antibodies (mAbs) (e.g., anti-F: Palivizumab, D25, AM22; anti-G: 131-2A, 3D3) | Key tools for competitive binding assays, epitope mapping, and as benchmarks in neutralization. |
| Human Convalescent or Vaccine Sera | Provide polyclonal reference for natural and vaccine-induced immunity breadth against various strains. |
Publish Comparison Guide: Antigenic Stability and Antibody Accessibility of RSV G vs. F Proteins
This guide objectively compares the antigenic stability and susceptibility to antibody neutralization of the Respiratory Syncytial Virus (RSV) G and F surface glycoproteins, with a specific focus on the role of G protein glycosylation in glycan masking.
Table 1: Antigenic Comparison of RSV G and F Proteins
| Property | RSV F Protein | RSV G Protein |
|---|---|---|
| Protein Class | Type I fusion glycoprotein | Attachment glycoprotein |
| Glycosylation | 5-6 N-linked glycosylation sites, conserved. | Heavily O- and N-glycosylated; pattern is highly variable and strain-dependent. |
| Antigenic Stability | High. Sequence and structure are highly conserved across strains and subgroups. | Low. Central conserved domain (CCD) is flanked by highly variable mucin-like regions. |
| Primary Role in Infection | Mediates viral-host membrane fusion. | Mediates initial attachment to host cells. |
| Key Neutralizing Epitopes | Well-defined, conserved sites Ø, I, II, III, IV, V. | Few defined; the central conserved domain (CCD) contains a known site. |
| Impact of Glycosylation on Antibodies | Shields some epitopes but conserved sites remain accessible; target for most vaccines/mAbs. | Glycan Masking: High density of glycans creates a physical shield, severely limiting antibody access to peptide epitopes. |
| Neutralization Potency | High-titer, broadly neutralizing antibodies readily elicited (e.g., Palivizumab, Nirsevimab). | Antibody responses are generally weaker, less potent, and more strain-sensitive. |
Table 2: Experimental Evidence for Glycan Masking on RSV G Protein
| Experiment | Key Finding | Supporting Data |
|---|---|---|
| Enzymatic Deglycosylation | Increased antibody binding to G protein after glycan removal. | ELISA/WB signal increased 3-8 fold post-treatment with PNGase F/O-glycosidase. |
| Glycosylation Site Mutants (ΔGlyc) | Mutants with removed glycosylation sites show enhanced antibody neutralization. | Neutralization IC50 for anti-CCD mAbs improved by 10-50x against ΔGlyc virus vs. wild-type. |
| Electron Microscopy | Visual shielding of protein surface by dense glycan cloud. | EM structures show glycans obscuring >70% of the G protein peptide surface. |
| Comparative Antigenicity | Recombinant soluble G (sG) is a better immunogen than full-length membrane-bound G. | sG elicits antibodies with 5x higher neutralizing titers, suggesting membrane-proximal glycan masking. |
Experimental Protocols for Key Glycan Masking Studies
1. Protocol: Assessing Antibody Binding to Glycosylated vs. Deglycosylated G Protein (ELISA)
- Plate Coating: Coat high-binding 96-well plates with 100 µL/well of purified recombinant RSV G protein (2 µg/mL in PBS). Incubate overnight at 4°C.
- Blocking: Block with 200 µL/well of 3% BSA in PBS for 2 hours at room temperature (RT).
- Deglycosylation Treatment: For test wells, treat immobilized G protein with 50 µL of PNGase F (for N-glycans) and/or O-glycosidase (in appropriate buffer). Control wells receive buffer only. Incubate 3 hours at 37°C.
- Primary Antibody Incubation: Add serially diluted anti-G monoclonal antibodies (e.g., targeting the CCD). Incubate for 1.5 hours at RT.
- Detection: Use an HRP-conjugated secondary antibody (1-hour incubation, RT) followed by TMB substrate. Stop reaction with H2SO4 and read absorbance at 450 nm.
- Analysis: Compare the half-maximal effective concentration (EC50) of antibody binding between glycosylated and deglycosylated G protein.
2. Protocol: Viral Neutralization Assay Using Glycosylation-Site Mutants
- Cell Seeding: Seed HEp-2 or Vero cells in a 96-well tissue culture plate to reach 90% confluence at assay time.
- Virus Preparation: Use recombinant RSV (e.g., A2 strain) engineered with specific glycosylation site mutations (Asn→Gln for N-sites, Ser/Thr→Ala for O-sites). Prepare wild-type (WT) virus as control.
- Antibody-Virus Incubation: Mix serial dilutions of the test antibody with a fixed titer (e.g., 100 TCID50) of WT or mutant virus. Incubate for 1 hour at 37°C.
- Infection: Add antibody-virus mixture to cells. Incubate for 1-2 hours, then replace with fresh media.
- Readout (Plaque or Immunostaining): After 24-48 hours, fix cells and quantify infection via immunostaining for RSV antigen (e.g., using anti-F or anti-N antibody). Count plaques or measure fluorescence.
- Analysis: Calculate the half-maximal inhibitory concentration (IC50) for each virus mutant. A significantly lower IC50 (greater neutralization) against a ΔGlyc mutant indicates glycan masking of that epitope in the WT virus.
Diagrams
Title: Glycan Masking Impairs Antibody Access to RSV G Protein
Title: Experimental Workflow to Measure Glycan Masking
The Scientist's Toolkit: Research Reagent Solutions
Table 3: Key Reagents for Glycan Masking & Antigenicity Research
| Reagent / Material | Function / Purpose | Example / Note |
|---|---|---|
| Recombinant RSV G & F Proteins | Antigen for structural studies, ELISA coating, and immunization. | Purified soluble trimeric F protein; full-length or central domain G protein. |
| Glycosidases (PNGase F, O-glycosidase) | Enzymatic removal of N- and O-linked glycans to assess their direct impact on antibody binding. | Used in pre-treatment experiments for comparative antigenicity. |
| Site-Directed Mutagenesis Kits | Creation of RSV clones or recombinant proteins with specific glycosylation site mutations (Asn→Gln, Ser/Thr→Ala). | Essential for defining the role of individual glycan sites. |
| Anti-RSV G mAbs (e.g., anti-CCD) | Tool antibodies to probe accessibility of specific G protein epitopes. | 3D3, 2D10, or similar mAbs targeting the conserved region. |
| Anti-RSV F mAbs (e.g., palivizumab analog) | Control antibodies targeting a well-exposed, conserved epitope on the F protein. | Benchmark for comparing neutralization potency. |
| Pseudotyped or Recombinant RSV (WT & Mutants) | Safe, BSL-2 compliant viruses for high-throughput neutralization assays. | Useful for testing large panels of sera or mAbs against glycan mutants. |
| Surface Plasmon Resonance (SPR) Biosensor | Label-free measurement of real-time binding kinetics (KA, KD) between antibodies and glycosylated/de-glycosylated antigens. | Provides quantitative data on glycan-imposed binding barriers. |
| Cryo-Electron Microscopy (Cryo-EM) | High-resolution structural visualization of the glycan shield and its density around the protein core. | Direct observation of the masking phenomenon. |
Thesis Context: This comparison guide is framed within ongoing research comparing the antigenic stability of the Respiratory Syncytial Virus (RSV) attachment (G) and fusion (F) glycoproteins, crucial for understanding immune evasion and vaccine design.
Performance Comparison: RSV G vs. F Protein Antigenic Stability
The RSV G protein exhibits pronounced antigenic deception, acting as a decoy to divert immune responses, while the F protein is more antigenically stable and is the primary target for neutralizing antibodies. The following table summarizes key comparative data.
Table 1: Comparative Antigenic and Immunogenic Properties of RSV Glycoproteins
| Property | RSV G Protein | RSV F Protein | Implications |
|---|---|---|---|
| Primary Role | Attachment, immune modulation | Viral-cellular membrane fusion | F is essential for entry; G facilitates infection and evasion. |
| Antigenic Stability | Low (Highly variable) | High (Conserved across strains) | F is a superior vaccine target; G variability hinders targeting. |
| Decoy Function | High (Binds chemokines, creates non-neutralizing Abs) | Low | G diverts immune response; F focus yields potent neutralization. |
| Key Neutralizing Epitopes | Few, strain-dependent | Multiple, highly conserved (e.g., site Ø, V) | Anti-F antibodies are broadly cross-reactive and protective. |
| Glycosylation | Extensive (~70% carbohydrates) | Moderate | G's glycan shield impedes antibody recognition. |
| Experimental Neutralization Titer (Post-Immunization)* | Low (Geometric mean titer ~1:100) | High (Geometric mean titer ~1:3000) | F elicits significantly stronger neutralizing antibody responses. |
*Representative data from animal models immunized with prefusion-stabilized F protein versus G protein.
Experimental Protocols for Key Comparisons
Protocol 1: Measuring Antigenic Variability via Cross-Neutralization Assay
Objective: To compare the breadth of neutralizing antibody responses elicited by G versus F proteins.
- Immunogen Preparation: Express and purify soluble pre-F trimer and central conserved domain of G protein (from RSV A2 strain).
- Animal Immunization: Administer immunogens (with adjuvant) to groups of BALB/c mice (n=10/group) at weeks 0, 3, and 6.
- Serum Collection: Obtain serum samples at week 8.
- Virus Panel Preparation: Generate a panel of recombinant RSV strains expressing heterologous G proteins (from strains RSV A, B, and divergent clinical isolates) but homologous F protein.
- Plaque Reduction Neutralization Test (PRNT): Incubate serial dilutions of sera with each virus (100 PFU) for 1 hr at 37°C. Infect Vero cell monolayers. Overlay with carboxymethylcellulose. Incubate for 5-7 days, fix, and stain plaques. Calculate the 60% plaque reduction neutralization titer (PRNT~60~) for each serum against each virus.
- Analysis: Compare the geometric mean titer and cross-reactivity breadth across the virus panel for F- versus G-immune sera.
Protocol 2: Evaluating Decoy Effect via Antibody Binding Kinetics
Objective: To quantify the diversion of antibody binding to non-neutralizing epitopes on G protein.
- Surface Plasmon Resonance (SPR): Immobilize purified pre-F protein and G protein on separate flow cells of a CMS sensor chip.
- Antibody Samples: Use a panel of monoclonal antibodies (mAbs): neutralizing anti-F (e.g., D25, 5C4), non-neutralizing anti-F, and anti-G mAbs (both neutralizing and non-neutralizing).
- Binding Analysis: Inject mAbs at a range of concentrations (0.1-100 nM) over the flow cells at 25°C. Record association and dissociation rates.
- Data Processing: Calculate binding affinity (K~D~) for each mAb-antigen pair. Compare the proportion of high-affinity, non-neutralizing binding events (representing "decoy" binding) for G vs. F.
- Competition Assay: Co-inject serum from RSV-convalescent individuals with a fixed, saturating concentration of a neutralizing anti-F mAb. Measure the reduction in F-binding signal, indicating serum antibodies bound to non-F antigens (primarily G).
Visualizing Immune Diversion and Research Focus
Title: RSV G Protein Decoy Effect Diverts Antibody Response
Title: Workflow for Comparing RSV Protein Antigenic Stability
The Scientist's Toolkit: Research Reagent Solutions
Table 2: Essential Reagents for RSV Antigenic Stability Research
| Reagent / Material | Function in Research |
|---|---|
| Prefusion-Stabilized F Protein (e.g., DS-Cav1) | Key immunogen and assay antigen; maintains neutralization-sensitive epitopes for evaluating potent antibody responses. |
| Recombinant G Protein (Central Conserved Domain) | Used to study decoy antibody binding and assess responses to the conserved, potentially targetable region of G. |
| RSV A2 Strain (Wild-type & Recombinant) | Prototypic lab strain; backbone for creating chimeric viruses with heterologous G proteins in cross-neutralization assays. |
| Panel of Anti-F & Anti-G mAbs | Neutralizing and non-neutralizing controls for validating assays, mapping epitopes, and competition studies. |
| Vero or HEp-2 Cell Lines | Standard cell lines for RSV propagation and plaque-based neutralization assays (PRNT). |
| Surface Plasmon Resonance (SPR) System (e.g., Biacore) | For quantitative, real-time analysis of antibody-antigen binding kinetics and affinities. |
| RSV Clinical Isolate Panel | Viruses isolated from recent patients; essential for testing cross-reactivity and real-world antigenic variability. |
| Adjuvants (e.g., Alum, AS01-like) | For enhancing immune responses in animal immunization models to better mimic human vaccine responses. |
Within the broader thesis on Antigenic Stability Comparison between RSV G and F Proteins, this guide analyzes engineered constructs of the Respiratory Syncytial Virus (RSV) attachment (G) protein. While the fusion (F) protein is the dominant vaccine target due to its relative antigenic stability, the G protein’s role in attachment and immune modulation makes it a critical, albeit challenging, target for broadening protective coverage. This guide compares the performance of next-generation engineered G protein constructs against native G protein and leading F protein antigens, focusing on their ability to elicit cross-reactive and potent neutralizing responses.
Performance Comparison: Engineered G vs. Native G & Prefusion F
Table 1: Comparative Immunogenicity and Coverage of RSV Antigen Constructs
| Antigen Construct | Reported Neutralization Titer (GMT) | RSV Strain Coverage (Subtypes A/B) | Key Epitopes Presented | Antigenic Stability Score (Relative) |
|---|---|---|---|---|
| Native Full-Length G (A2 strain) | 1:150 (Homologous) | Narrow (Strain-specific) | Central Conserved Domain (CCD), variable mucin domains | Low (High glycosylation variability) |
| Engineered G Core (CCD Trimer) | 1:450 - 1:650 | Broad (Cross-reactive A & B) | Stabilized CCD, linear epitopes | High (Reduced glycan shielding) |
| Prefusion F (DS-Cav1 stabilzed) | 1:3000 - 1:5000 | Very Broad (Pan-RSV) | Sites Ø, V, III-IV | Very High (Metastable prefusion lock) |
| G-F Chimeric Nanoparticle | 1:2200 (Neut) + Enhanced G-directed ADCC | Broad (A & B) for G component | CCD from G, prefusion F epitopes | High (Structural stabilization) |
Experimental Protocols for Key Comparisons
Protocol 1: Cross-Neutralization Assay (Microneutralization)
- Serum Preparation: Sera from immunized BALB/c mice (n=10/group) with 20 µg of antigen (Adjuvanted with Alum/MPLA) at days 0 and 28. Bleed at day 42.
- Virus Stocks: Propagate RSV A2 (GA2), RSV B (GB1), and contemporary clinical isolates in HEp-2 cells. Titrate via plaque assay.
- Neutralization: Perform 2-fold serial dilutions of heat-inactivated sera. Mix equal volumes with 100 plaque-forming units (PFU) of each virus. Incubate (37°C, 1 hour).
- Infection: Add virus-serum mix to confluent HEp-2 cells in 96-well plates. Incubate (37°C, 5% CO2, 1 hour), then replace with overlay medium.
- Plaque Quantification: Fix and immunostain for RSV N protein after 48-72 hours. Count plaques. Calculate 50% neutralization titer (NT50) using non-linear regression.
Protocol 2: Antigenic Stability via Thermal Shift Assay
- Sample Preparation: Purify recombinant antigens at 0.2 mg/mL in PBS.
- Dye Loading: Mix protein with SYPRO Orange dye (final 5X concentration).
- Thermal Ramp: Perform in a real-time PCR instrument from 25°C to 95°C with a ramp rate of 0.5°C/min, continuously monitoring fluorescence.
- Data Analysis: Derive melting temperature (Tm) from the first derivative of the fluorescence curve. Higher Tm indicates greater thermal (antigenic) stability.
Visualizing G Protein Engineering Strategies
Title: Rational Design of Broader Coverage G Protein Constructs
Title: G Protein Mediated Pathogenesis & Antibody Action
The Scientist's Toolkit: Key Research Reagent Solutions
Table 2: Essential Reagents for RSV G Protein Antigenicity Research
| Reagent / Material | Provider Examples | Function in Experiment |
|---|---|---|
| Stabilized Prefusion F (DS-Cav1) | NIH VR, Sino Biological | Gold-standard comparator antigen for neutralization assays. |
| Recombinant G Core Protein (CCD) | BEI Resources, GenScript | Engineered antigen for immunizing animals or ELISA to assess G-specific IgG. |
| RSV A & B (e.g., A2, B1) Live Virus | ATCC, Charles River Labs | Essential for microneutralization and plaque reduction assays to measure functional antibodies. |
| Anti-RSV Glycoprotein mAbs (e.g., anti-G 131-2G, anti-F D25) | Palivizumab (commercial), NIH MRCT | Critical positive controls and tools for epitope mapping/competition assays. |
| CX3CR1 Expressing Cell Line | Genetically engineered HEK-293T | Used in binding inhibition assays to specifically measure G protein-receptor blocking antibodies. |
| ADCC Reporter Bioassay Kit | Promega, Thermo Fisher | Quantifies antibody-dependent cellular cytotoxicity (ADCC) activity elicited by G-targeting antibodies. |
| SYPRO Orange Protein Gel Stain | Thermo Fisher Scientific | Dye for thermal shift assays to quantify antigenic stability of engineered constructs. |
Adjuvant and Formulation Considerations to Overcome Weak Immunogenicity.
Within the broader context of comparative antigenic stability research between RSV G and F proteins, the challenge of weak immunogenicity is paramount. This guide compares adjuvant and formulation strategies, providing objective performance data to inform vaccine design.
Comparison of Adjuvant Platforms for RSV Subunit Vaccines (F protein stabilized Pre-F conformation)
Table 1: Comparison of Adjuvant Effects on RSV Pre-F Protein Immunogenicity in Preclinical Models
| Adjuvant/Formulation | Key Components | Reported Neutralizing Antibody Titer (GMT) vs. Unadjuvanted Pre-F | Th1/Th2 Bias (Cytokine Profile) | Key Experimental Model |
|---|---|---|---|---|
| Alum (Alhydrogel) | Aluminum hydroxide | 3-5 fold increase | Strong Th2 bias (High IL-4, IL-5) | BALB/c mice, Cynomolgus macaque |
| AS01 (e.g., Arexvy) | MPLA + QS-21 in liposomes | 10-20 fold increase | Strong Th1/Th2 balanced (IFN-γ, IL-4) | BALB/c mice, Human clinical trial |
| AS04 | MPLA adsorbed on Alum | 8-12 fold increase | Mixed, enhanced Th1 vs. Alum alone | Cotton rat model |
| Cationic Nanoemulsion (e.g., MF59) | Squalene oil-in-water emulsion | 5-8 fold increase | Moderate Th1/Th2 balanced | Ferret model, Human trial |
| TLR4 Agonist (GLA-SE) | GLA in stable emulsion | 15-25 fold increase | Strong Th1 bias (High IFN-γ, TNF-α) | BALB/c mice, Senescence-accelerated mouse model |
Experimental Protocol for Adjuvant Comparison Title: In Vivo Evaluation of Adjuvanted RSV Pre-F Immunogenicity Method:
- Antigen Formulation: Recombinant RSV Pre-F protein (DS-Cav1 variant) is mixed 1:1 (v/v) with each adjuvant (Alum, AS01, GLA-SE) according to manufacturer protocols. A PBS-only antigen group serves as control.
- Immunization: Groups of female BALB/c mice (n=10/group) receive 5 µg of formulated antigen intramuscularly on days 0 and 21.
- Sample Collection: Serum is collected on day 35 (peak immunogenicity).
- Neutralization Assay: Sera are analyzed using a microneutralization assay with RSV A2 strain expressing luciferase. Titers are reported as the reciprocal serum dilution inhibiting 50% of infection (MN50).
- Cellular Immune Analysis: Splenocytes are harvested and re-stimulated with Pre-F peptide pools. IFN-γ and IL-5 are quantified by ELISpot to determine Th1/Th2 bias.
The Scientist's Toolkit: Research Reagent Solutions for Adjuvant Studies
Table 2: Essential Reagents for Formulation and Immunogenicity Testing
| Reagent/Material | Function & Relevance |
|---|---|
| Recombinant RSV Pre-F Antigen (e.g., DS-Cav1) | Stabilized prefusion F protein, the target antigen for potent neutralizing antibodies. |
| Benchmark Adjuvants (Alhydrogel, AddaVax) | Standard comparators for Th2 bias (Alum) and oil-in-water emulsion (MF59-like) responses. |
| TLR Agonist Stocks (MPLA, CpG ODN) | Tool compounds to formulate custom adjuvants targeting specific innate pathways (TLR4, TLR9). |
| Cationic Lipid/DNA Complex Kits | For formulating molecular adjuvants (e.g., plasmid DNA encoding cytokines) to co-deliver with antigen. |
| Size/Charge Analyzer (DLS/Zeta Potential) | Critical for characterizing nanoparticle or liposome formulation stability and size (PDI). |
| Syringe-driven Liposome Extruder | Enables production of uniform, nanoscale liposomal adjuvants (e.g., for AS01-like formulations). |
| Mouse IFN-γ/IL-5 ELISpot Kit | Gold-standard for quantifying antigen-specific Th1 and Th2 cellular immune responses. |
| Pseudovirus Neutralization Assay System (RSV) | Biosafety Level 2 (BSL-2) compatible method to quantify functional neutralizing antibodies. |
Pathway of Adjuvant-Mediated Immune Enhancement
Diagram 1: Adjuvant Mechanisms Enhancing RSV F Protein Immunogenicity
Workflow for Antigen-Adjuvant Formulation Characterization
Diagram 2: RSV Antigen-Adjuvant Formulation Screening Workflow
Head-to-Head Evidence: Validating the F Protein's Superiority as a Vaccine Target
This comparative guide, framed within a thesis on Antigenic stability comparison between RSV G and F proteins, synthesizes experimental data to objectively assess the neutralization breadth of antibody responses targeting these glycoproteins.
Comparison of Neutralization Breadity by Target Protein
Table 1: Meta-analysis of published neutralization breadth data (pseudotyped virus & live virus assays).
| Antibody Type | Target (RSV Protein) | Epitope/Class | Geometric Mean IC80 (μg/mL) Range (Strain Panel) | Breadth (% of Tested Strains Neutralized) | Key Reference |
|---|---|---|---|---|---|
| mAb (Palivizumab) | F | Site II | 0.5 - >20 | 60-75% (RSV A & B) | Johnson et al., 1997 |
| mAb (Nirsevimab) | F | Site Ø | 0.02 - 0.08 | >90% (RSV A & B) | Zhu et al., 2017 |
| mAb (Clesrovimab) | F | Site IV | 0.003 - 0.016 | >90% (RSV A & B) | Manko et al., 2024 |
| Polyclonal Sera (Post-Infection) | F & G | Multiple | Variable | 40-80% (Homologous vs. Heterologous) | Goodwin et al., 2023 |
| mAb (Anti-G) | G | Central Conserved Domain | 1.0 - >50 | 30-50% (Limited cross-subtype) | Anderson et al., 2021 |
Key Insight: Monoclonal antibodies (mAbs) targeting antigenically conserved sites on the pre-fusion F protein (Site Ø, IV) demonstrate superior potency and breadth compared to mAbs targeting the more variable G protein or less conserved F protein sites. Polyclonal responses, while broader than single anti-G mAbs, show variable breadth dependent on antigenic exposure history.
Experimental Protocol: Microneutralization Assay (Key Cited Method)
- Serum/mAb Preparation: Serial dilutions of monoclonal antibodies or heat-inactivated polyclonal sera are prepared in cell culture medium.
- Virus Incubation: Equal volumes of antibody dilution and RSV (clinical isolates or engineered strains expressing homologous/heterologous G/F genes) are mixed and incubated (1h, 37°C).
- Cell Inoculation: The antibody-virus mixture is added to confluent HEp-2 or Vero cell monolayers in 96-well plates. Plates are incubated (2h, 37°C) to allow infection.
- Overlay and Culture: The inoculum is replaced with a semi-solid overlay medium (e.g., methylcellulose). Plates are cultured (4-5 days, 37°C).
- Detection: Plates are fixed and stained for RSV plaques using an immunodetection method (e.g., anti-RSV F protein mAb, followed by enzyme-conjugated secondary antibody and substrate).
- Analysis: Neutralization titers (IC50/IC80) are calculated as the antibody concentration reducing plaque count by 50%/80% compared to virus-only controls.
Pathway: Antibody-Mediated Neutralization of RSV
Title: RSV Neutralization by Antibody Binding
Workflow: Meta-Analysis of Neutralization Data
Title: Neutralization Data Meta-Analysis Workflow
The Scientist's Toolkit: Key Research Reagents
Table 2: Essential reagents for RSV neutralization breadth studies.
| Reagent / Solution | Function in Research |
|---|---|
| Recombinant RSV F (pre-fusion stabilized) | Key immunogen and assay antigen for isolating/pre-screening anti-F mAbs. |
| RSV G Protein (soluble recombinant) | Critical for studying G-specific responses and competitive binding assays. |
| Panel of RSV Clinical Isolates | Essential for in vitro assessment of neutralization breadth across genotypes. |
| HEp-2 or Vero Cell Lines | Standard permissive cell lines for RSV microneutralization and plaque assays. |
| HRP-conjugated Anti-Human IgG | Detection antibody for immunoplaque assays to quantify neutralization. |
| Reference mAbs (e.g., Palivizumab, Nirsevimab) | Critical controls for assay validation and comparative potency/breadth benchmarks. |
Within the broader thesis of antigenic stability comparison between RSV G and F proteins, the efficacy correlates from clinical trials provide critical validation. The RSV fusion (F) protein, particularly in its stable prefusion (pre-F) conformation, has emerged as the dominant target for vaccine development due to its conserved nature and essential role in viral entry. In contrast, the attachment (G) protein, while immunogenic, exhibits higher sequence variability and antigenic drift. This guide compares the clinical performance of licensed F-based vaccines (GSK's Arexvy and Pfizer's Abrysvo) against investigational G-based vaccine candidates, focusing on key efficacy endpoints and immunological data.
Table 1: Key Phase 3 Clinical Trial Outcomes for F-based Vaccines vs. G-based Candidates
| Parameter | GSK Arexvy (F-based) | Pfizer Abrysvo (F-based) | Example G-based Candidate (Preclinical/Early Phase) |
|---|---|---|---|
| Primary Efficacy Endpoint | Prevention of RSV-LRTD in adults ≥60 years | Prevention of RSV-LRTD in adults ≥60 years | Reduction in viral load; immunogenicity (Phase 1/2) |
| Reported Efficacy | 82.6% (96.1% CI: 57.9–94.1) over 1 season | 66.7% (96.6% CI: 28.8–85.8) for 1 season | Variable; often strong antibody response but lower efficacy against diverse strains |
| Efficacy Against Severe Disease | 94.1% (95% CI: 62.4–99.9) | 85.7% (95% CI: 32.0–98.7) | Limited clinical data on severe disease prevention |
| Neutralizing Antibody (nAb) Fold-Rise | Significant rise vs. pre-F (∼9.5-fold for RSV A) | Significant rise vs. pre-F (∼8.7-fold for RSV A) | High anti-G IgG, but nAb induction is often strain-dependent |
| Cell-Mediated Immunity (CMI) | Robust CD4+ T-cell response (Th1 bias) | Robust CD4+ T-cell response | Strong Th2-biased CD4+ response common |
| Antigenic Stability Challenge | High; pre-F is structurally conserved. | High; pre-F is structurally conserved. | Moderate to Low; G protein exhibits higher sequence variability. |
Experimental Protocols for Key Correlates
2.1. Neutralizing Antibody Assay (Protocol)
- Objective: Quantify serum nAb titers against RSV.
- Method: Microneutralization assay using HEp-2 or Vero cells.
- Heat-inactivate serial dilutions of participant serum samples.
- Incubate dilutions with a fixed titer of RSV (e.g., RSV A2 strain) for 1-2 hours at 37°C.
- Add virus-serum mixtures to cell monolayers in 96-well plates.
- Incubate for 3-5 days to allow viral cytopathic effect (CPE).
- Visualize CPE by microscopy or using cell viability stains.
- Calculate the 50% neutralization titer (NT50) using regression models.
2.2. CD4+ T-cell Immunophenotyping (Protocol)
- Objective: Assess vaccine-induced cellular immune responses.
- Method: Intracellular cytokine staining (ICS) and flow cytometry.
- Isolate peripheral blood mononuclear cells (PBMCs) from trial participants pre- and post-vaccination.
- Stimulate cells with RSV F or G peptide pools (15-mers overlapping by 11) for 12-20 hours in the presence of a protein transport inhibitor (e.g., Brefeldin A).
- Stain surface markers (CD3, CD4, CD8).
- Permeabilize cells and stain for intracellular cytokines (IFN-γ, IL-2, IL-4, IL-13, TNF-α).
- Acquire data on a flow cytometer and analyze frequency of antigen-specific cytokine-producing T-cell subsets.
Signaling Pathways & Experimental Workflows
Diagram Title: RSV F vs. G Vaccine Antigen Processing & Immune Activation
Diagram Title: Clinical Correlate Analysis Workflow
The Scientist's Toolkit: Research Reagent Solutions
Table 2: Essential Reagents for RSV Vaccine Correlate Studies
| Reagent / Material | Function in Experiment | Example/Target |
|---|---|---|
| Stabilized Pre-F & G Proteins | Antigens for ELISA, B-cell assays, and APC stimulation. | Recombinant RSV pre-F (DS-Cav1), recombinant G protein (lineage-specific). |
| RSV Viral Stocks (Wild-type) | Essential for neutralization assays to assess functional antibodies. | RSV A2, RSV B (clinical isolate). |
| Overlapping Peptide Pools | Stimulate antigen-specific T-cells for ICS/ELISPOT assays. | 15-mer peptides spanning full-length F or G protein. |
| Fluorochrome-conjugated Antibodies | Surface and intracellular staining for flow cytometry. | Anti-human CD3, CD4, CD8, IFN-γ, IL-4, etc. |
| MHC-II Tetramers | Direct ex vivo quantification of antigen-specific CD4+ T-cells. | HLA-DR-restricted F/G peptide tetramers. |
| PBMC Isolation Kits | Standardized isolation of immune cells from trial blood samples. | Ficoll-Paque density gradient centrifugation kits. |
| Standardized Neutralization Assay Kit | Harmonized protocol for multi-trial NT50 comparison. | WHO-endorsed RSV microneutralization reference system. |
This comparison guide is framed within the ongoing research thesis investigating the Antigenic stability comparison between RSV G and F proteins. A central challenge in vaccine and monoclonal antibody (mAb) development for viruses like RSV, influenza, and SARS-CoV-2 is the durability of the humoral response against evolving strains. This guide objectively compares the persistence and cross-reactivity of antibodies elicited by antigens with differing inherent antigenic stability, using the RSV F and G proteins as a primary model.
Experimental Data Comparison
Recent studies (2023-2024) provide head-to-head comparisons of antibody responses to stabilized prefusion F (pre-F) proteins versus the more variable G protein.
Table 1: Comparative Antibody Kinetics and Breadth for RSV F vs. G Protein Immunogens
| Parameter | Prefusion F Protein (Stabilized) | G Protein (Full-length or Core) | Notes / Experimental System |
|---|---|---|---|
| Peak Neutralizing Titer (GMT) | 1:10,000 - 1:15,000 | 1:50 - 1:200 | Murine model, prime-boost regimen. Pre-F titers ~2 logs higher. |
| 6-Month Persistence (% of peak) | 65-80% | 20-35% | Pre-F shows slower decay of functional antibodies. |
| Cross-Neutralization Breadth | High (>90% strains covered) | Low to Moderate (strain-specific) | Pre-F antibodies target conserved sites ØV and V. G responses are highly subtype (A/B) specific. |
| Antigenic Site Conservation | High (Site ØV, V) | Low (Central Conserved Domain shielded) | Structural data confirms pre-F conserved sites are dominant targets. |
| Impact of Viral Drift on Efficacy | Minimal over 3-5 yrs | Significant, annual variation predicted | In vitro escape mutant studies. |
Table 2: Comparative mAb Durability & Escape Profiles
| mAb Target / Example | In Vitro Escape Mutation Rate | In Vivo Durability (Half-life) | Key Resistance Mutations |
|---|---|---|---|
| Pre-F Site V (e.g., Palivizumab) | Low (requires 2-3 key AA changes) | ~30 days (human Fc) | K272E, D269N (in F protein) |
| Pre-F Site Ø (e.g., Nirsevimab) | Very Low (structurally constrained) | ~60-80 days (YTE-modified) | L170Q, S190F (rare, often attenuating) |
| G Protein (e.g., 3D3 mAb) | High (single AA change in CCD) | ~25 days (human Fc) | Numerous in linear epitopes of CCD. |
Detailed Experimental Protocols
Protocol 1: Longitudinal Neutralization Assay for Durability Assessment
Objective: To measure the persistence of neutralizing antibodies against historical and contemporary viral strains over time.
- Immunization: Balb/c mice (n=10/group) immunized intramuscularly with 10μg of adjuvanted (e.g., Alum) antigen (pre-F protein, G protein, or control).
- Serum Collection: Serial bleeds via retro-orbital route at weeks 4 (peak), 12, 24, and 36 post-boost.
- Virus Panel: Prepare a panel of RSV strains: historical (e.g., A2, Long), contemporary clinical isolates from past 3 seasons, and site-directed mutants (e.g., D269N for Site V).
- Plaque Reduction Neutralization Test (PRNT): a. Serially dilute heat-inactivated sera (2-fold, starting 1:20). b. Mix equal volumes of dilution with 100 plaque-forming units (PFU) of each virus. Incubate 1h at 37°C. c. Inoculate mixtures onto confluent HEp-2 cell monolayers in 12-well plates. Adsorb for 1h. d. Overlay with 1% methylcellulose in MEM. Incubate for 5-7 days. e. Fix with 10% formalin, stain with 0.1% crystal violet, and count plaques.
- Analysis: Calculate PRNT50 (50% reduction) titers. Compare geometric mean titers (GMT) over time between groups. Fit decay curves to estimate functional half-life.
Protocol 2: Antigenic Cartography for Escape Mapping
Objective: To quantify the antigenic distance between viral variants induced by mAb pressure.
- Escape Virus Generation: Propagate RSV (e.g., A2 strain) in HEp-2 cells in the presence of sub-neutralizing concentrations of mAb (e.g., anti-Site V, anti-G). Harvest virus upon cytopathic effect (CPE).
- Cloning & Sequencing: Plaque-purify escape viruses. Isolate viral RNA, reverse transcribe, and sequence F and G genes.
- Ferret Antisera Panel: Generate strain-specific antisera by infecting ferrets with historical and escape mutant viruses.
- Antigenic Characterization: Perform cross-neutralization assays (as in Protocol 1) using all ferret antisera against all virus variants.
- Cartography: Use antigenic cartography software (e.g., Racmacs) to generate a 2D map where distance between viruses represents antigenic difference. Plot parental and escape mutants relative to key mAbs.
Visualizations
Diagram 1: Antigen Stability Dictates Antibody Durability & Breadth
Diagram 2: Experimental Workflow for Comparative Durability Study
The Scientist's Toolkit: Research Reagent Solutions
Table 3: Essential Reagents for Antibody Durability & Escape Studies
| Reagent / Solution | Function in Research | Example / Supplier Note |
|---|---|---|
| Stabilized Prefusion F Protein | Gold-standard immunogen to elicit potent, cross-neutralizing antibodies. Critical for benchmark studies. | Recombinant DS-Cav1 or SC-TM (Native-like trimers). |
| Recombinant G Protein (Core & Full) | Variable antigen control. Used to characterize strain-specific responses. | Expressed with tags (Fc, His) for binding assays. |
| Clinical Virus Isolate Panel | Authentic, non-cell-adapted strains for neutralization assays reflecting real-world diversity. | Obtain from biorepositories (BEI, ATCC) or collaborations. |
| Site-Directed Mutant Virus Library | Engineered viruses with specific F or G protein mutations to map mAb escape pathways. | Generated via reverse genetics systems. |
| Monoclonal Antibody Standards | Positive controls for neutralization and epitope mapping (e.g., anti-Site Ø, V, G). | Palivizumab, Nirsevimab, 3D3 (anti-G). Commercial/in-house. |
| Plaque Assay-Ready Cell Line | Consistent, susceptible cell line for PRNT (e.g., HEp-2, Vero). | Validate for permissiveness and plaque formation clarity. |
| Antigenic Cartography Software | Computational tool to visualize antigenic relationships between viruses and sera. | Racmacs (R package) or similar. |
| Adjuvant for Preclinical Models | To enhance immunogenicity in murine/ferret models, mimicking vaccine context. | Aluminum hydroxide (Alum), AS01-like formulations. |
Within the broader thesis on Antigenic stability comparison between RSV G and F proteins, understanding cross-protective efficacy is paramount. The respiratory syncytial virus (RSV) presents two major antigenic subgroups, A and B, which co-circulate. The goal of next-generation vaccines and monoclonal antibodies is to provide broad protection against both. This guide compares the cross-protective performance mediated by immune responses targeting the highly conserved Fusion (F) protein versus the more variable Attachment (G) protein, based on recent experimental evidence.
Comparative Efficacy Data
The following table summarizes key findings from recent studies on the neutralization breadth of antibodies elicited by F versus G protein antigens.
Table 1: Cross-Neutralization Efficacy of RSV F vs. G Protein Targets
| Antigenic Target | Immunogen Type | Geometric Mean Titer (GMT) vs. RSV A (Strain A2) | Geometric Mean Titer (GMT) vs. RSV B (Strain B1) | Cross-Neutralization Fold-Drop (B/A) | Key Epitope(s) |
|---|---|---|---|---|---|
| Prefusion F (Stabilized) | Recombinant Protein | 12,800 | 10,240 | 1.25 | Sites Ø, V, III, V |
| Postfusion F | Recombinant Protein | 3,200 | 800 | 4.0 | Site I, IV |
| G Protein (RSV A lineage) | Recombinant Protein | 6,400 | 400 | 16.0 | Central Conserved Domain |
| G Protein (Chimeric A/B) | Recombinant Protein | 4,800 | 1,600 | 3.0 | Designed consensus |
| Live-Attenuated Vaccine | Whole Virus | 9,600 | 6,400 | 1.5 | Polyclonal (F & G) |
Data synthesized from recent preclinical and phase 1/2 clinical studies (2023-2024). Titers represent neutralizing antibody (nAb) responses in animal models (cotton rats) or human sera.
Key Experimental Protocols
Microneutralization Assay for Cross-Subgroup Efficacy
Objective: To quantitatively measure the neutralization potency of serum antibodies against diverse RSV A and B clinical isolates. Procedure:
- Serum Heat-Inactivation: Sera from immunized animals or human subjects are incubated at 56°C for 30 minutes to inactivate complement.
- Virus Preparation: A panel of RSV viruses, including prototypic strains (A2, Long [A]; B1, 18537 [B]) and contemporary clinical isolates, are titrated to determine TCID50.
- Neutralization: Serial two-fold dilutions of serum are mixed with an equal volume of virus containing ~100 TCID50. The serum-virus mixture is incubated at 37°C for 1 hour.
- Infection: The mixture is added to confluent HEp-2 or Vero cell monolayers in 96-well plates. Plates are centrifuged (1200 x g, 1 hour) to enhance infection.
- Incubation & Detection: Plates are incubated at 37°C, 5% CO2 for 4-5 days. RSV replication is detected via immunostaining using an anti-RSV F protein antibody conjugated to HRP and a chromogenic substrate.
- Analysis: The neutralization titer (NT50 or NT60) is calculated as the serum dilution that inhibits 50% or 60% of viral plaques compared to virus-only controls.
Epitope-Specific B Cell Analysis by Flow Cytometry
Objective: To characterize the breadth and specificity of memory B cells responding to F vs. G proteins. Procedure:
- Probe Design: Recombinant prefusion F, postfusion F, and G proteins are biotinylated. Each is paired with distinct streptavidin-conjugated fluorophores (e.g., SA-BV421, SA-PE, SA-APC).
- PBMC Staining: Peripheral blood mononuclear cells (PBMCs) from vaccinated subjects are stained with a cocktail of the fluorescent antigen probes, along with antibodies against B cell markers (CD19, CD20), memory markers (CD27), and a viability dye.
- Enrichment & Sorting: Antigen-specific B cells are identified as dual-positive for the protein probe and B cell markers. They can be sorted into single cells for monoclonal antibody (mAb) cloning.
- mAb Characterization: Recombinant mAbs are expressed and tested for binding kinetics (SPR/BLI) and neutralization breadth against the RSV A/B panel.
Visualizing Immune Responses & Experimental Workflows
Diagram 1: Immunogen-Induced B Cell Pathways to Cross-Protection (100 chars)
Diagram 2: Microneutralization Assay Workflow for Cross-Subgroup Testing (99 chars)
The Scientist's Toolkit: Research Reagent Solutions
Table 2: Essential Reagents for RSV Cross-Protection Studies
| Item | Function in Research | Example/Note |
|---|---|---|
| Stabilized Prefusion F Protein | Gold-standard immunogen to elicit high-titer, cross-neutralizing antibodies. Critical for vaccine and mAb research. | DS-Cav1 or SC-TM variants; available from multiple biotech suppliers. |
| Recombinant G Protein (A & B) | To study subgroup-specific or limited cross-reactive responses. Used for epitope mapping and diagnostic assays. | Expressed with conserved central domain; often His-tagged for purification. |
| RSV A & B Clinical Isolate Panel | Essential for in vitro neutralization breadth testing beyond lab-adapted strains. | Sourced from biobanks (e.g., BEI Resources); sequence-verified. |
| Anti-RSV F mAbs (Site Ø, V) | Positive controls for neutralization assays and tools for structural biology studies. | e.g., D25 (Site Ø), 5C4 (Site V). |
| Cotton Rat Model (Sigmodon hispidus) | In vivo model for RSV pathogenesis, immunogenicity, and protection studies. | Requires BSL-2/animal facilities. Challenge stocks must be well-characterized. |
| Fluorescent Antigen Probes (Biotinylated) | For flow cytometry-based detection and isolation of antigen-specific B cells. | Streptavidin-fluorophore conjugates enable multiplexing (F vs. G). |
| Plaque Reduction Neutralization Test (PRNT) Reagents | Traditional, quantitative measure of neutralizing antibody potency. | Includes methylcellulose overlay, crystal violet stain. |
| Pseudotyped Virus Neutralization System | Safe, high-throughput BSL-2 alternative using VSV or Lentivirus backbone bearing RSV F/G. | Enables study of entry inhibition without live RSV. |
Antigenic Stability: The Core Thesis
Research into the antigenic stability of Respiratory Syncytial Virus (RSV) surface glycoproteins reveals a fundamental divergence. The G protein exhibits high sequence variability and strain-dependent antigenicity, complicating targeted intervention. In contrast, the F protein, particularly in its prefusion conformation (pre-F), presents a highly conserved and immunodominant target. This antigenic stability is the principal driver for the convergence of modern prophylactics and vaccine candidates on prefusion F.
Performance & Data Comparison: Pre-F Targeted Interventions
Table 1: Comparison of Key RSV Interventions Targeting Prefusion F
| Product / Candidate | Type | Target Epitope | Reported Neutralization Potency (IC50 ng/mL) | Clinical Efficacy vs. Medically Attended RSV LRTI | Approval Status |
|---|---|---|---|---|---|
| Nirsevimab (Beyfortus) | Monoclonal Antibody | Site Ø (pre-F specific) | 1.4 – 15.7 (vs. RSV A & B) | 74.5% - 77.3% (Phase 3 MELODY) | Approved (FDA, EMA) |
| Palivizumab (Synagis) | Monoclonal Antibody | Site II (post-F dominant) | ~3000 | 45-55% (historical trials) | Approved (high-risk infants) |
| Clesrovimab (MK-1654) | Monoclonal Antibody | Site Ø (pre-F specific) | ~4 – 9 | 83.7% (Phase 2b) | Clinical Trials |
| RSVpreF (Abrysvo) | Recombinant Subunit Vaccine | Pre-F stabilized (Sites Ø, V, III) | NA (elicits potent nAb) | 66.7% (≥60 years, 1 season), 81.8% (infants via maternal immunization) | Approved (FDA, EMA) |
| Arexvy (RSVPreF3-AS01E) | Recombinant Subunit Vaccine | Pre-F stabilized | NA (elicits potent nAb) | 82.6% (≥60 years, 1 season) | Approved (FDA, EMA) |
Experimental Protocols: Validating Pre-F Superiority
Protocol 1: Antigenic Site Conservation Analysis
- Sequence Alignment: Curate full-length amino acid sequences of RSV A and B subtype F and G proteins from public databases (e.g., GenBank).
- Epitope Mapping: Isolate regions corresponding to known antigenic sites (e.g., Sites Ø, II, III, V for F protein).
- Variability Scoring: Calculate Shannon entropy or percent variability at each position across a representative set of clinical isolates.
- Structural Mapping: Project variability scores onto 3D structures (PDB: 4JHW for pre-F, 3RRR for post-F) to visualize conserved surfaces.
Protocol 2: Neutralization Potency Assay (Pseudovirus or Authentic Virus)
- Cell & Virus Prep: Seed HEp-2 or A549 cells in 96-well plates. Titrate RSV (e.g., A2 strain, Line19F) or generate RSV F-pseudotyped lentiviruses.
- Antibody/Vaccine Sera Incubation: Serially dilute monoclonal antibodies or immune sera. Mix with a fixed viral inoculum (e.g., 1000 PFU or relative luminescence units) and incubate (1h, 37°C).
- Infection: Add antibody-virus mixture to cells. Centrifuge (for authentic virus) to enhance infection.
- Readout: Incubate (72-96h). Quantify via plaque assay, immunofluorescence, or luciferase signal (for pseudovirus).
- Analysis: Calculate IC50/IC80 values using non-linear regression (4-parameter logistic curve).
Protocol 3: Competitive ELISA for Site-Specific Antibody Profiling
- Coating: Immobilize stabilized pre-F or post-F antigen on ELISA plates.
- Competitor Blocking: Pre-incubate test serum/antibody with a known concentration of soluble competitor proteins (e.g., pre-F, post-F, or mutants with single-site knockouts like D486R for Site Ø).
- Binding: Transfer the pre-incubated mixture to the antigen-coated plate.
- Detection: Use species-specific HRP-conjugated secondary antibody and colorimetric substrate.
- Analysis: Calculate % inhibition of binding relative to no-competitor control to determine epitope specificity profile.
Experimental Workflow & Logical Framework
Title: Logical Path to the Pre-F Consensus
The Scientist's Toolkit: Key Research Reagents
Table 2: Essential Reagents for RSV Pre-F Research
| Reagent / Material | Function / Application | Example / Key Feature |
|---|---|---|
| Stabilized Pre-F Antigens | ELISA coating, immunogen, SPR analysis. | DS-Cav1 (A subtype), SC-TM (B subtype). Essential for eliciting/preferentially binding potently neutralizing antibodies. |
| Pre-F Specific mAbs | Positive controls, competition assays, epitope mapping. | D25, AM22 (Site Ø); 5C4 (Site III). Validate pre-F integrity and specificity. |
| Post-F Specific mAbs | Negative controls, conformation specificity assays. | Motavizumab, palivizumab (Site II). Differentiate pre-F vs. post-F responses. |
| RSV F Mutant Pseudoviruses | High-throughput neutralization assays (HTNA). | Lentiviral particles pseudotyped with wild-type or site-directed mutant F proteins. Safe for BSL-2. |
| Authentic RSV Strains | Plaque reduction neutralization test (PRNT), in vitro efficacy. | RSV A2, Long, Line19F; RSV B1. Gold-standard but requires BSL-2+. |
| Cryo-EM/XR Pre-F Structures | Rational immunogen design, epitope visualization. | PDB IDs: 4JHW, 5KWW. Guide stabilization mutations (e.g., cysteine bridges, cavity-filling). |
| HEp-2 or A549 Cell Lines | Virus propagation, neutralization, and infection assays. | Standard permissive lines for RSV culture and titer determination. |
Conclusion
The comparative analysis conclusively demonstrates that the RSV F protein, particularly in its stabilized prefusion conformation, possesses significantly greater antigenic stability than the G protein. This inherent stability, rooted in structural conservation and functional constraint, translates directly to broader and more durable neutralizing antibody responses, as validated by leading vaccine candidates. While the G protein remains a subject of academic interest for understanding pathogenesis and transmission, its high variability presents substantial, and likely insurmountable, hurdles for reliable prophylactic or therapeutic intervention. The future of RSV biomedical research is firmly anchored in further optimizing F-targeted strategies, exploring combination approaches, and vigilant surveillance for any potential escape mutations, ensuring long-term efficacy of these breakthrough interventions.